Ontinyent Airbnb Market Analysis 2025: Short Term Rental Data & Vacation Rental Statistics in Valencian Community, Spain
Is Airbnb profitable in Ontinyent in 2025? Explore comprehensive Airbnb analytics for Ontinyent, Valencian Community, Spain to uncover income potential. This 2025 STR market report for Ontinyent, based on AirROI data from April 2024 to March 2025, reveals key trends in the niche market of 36 active listings.
Whether you're considering an Airbnb investment in Ontinyent, optimizing your existing vacation rental, or exploring rental arbitrage opportunities, understanding the Ontinyent Airbnb data is crucial. Leveraging the low regulation environment is key to maximizing your short term rental income potential. Let's dive into the specifics.
Key Ontinyent Airbnb Performance Metrics Overview
Monthly Airbnb Revenue Variations & Income Potential in Ontinyent (2025)
Understanding the monthly revenue variations for Airbnb listings in Ontinyent is key to maximizing your short term rental income potential. Seasonality significantly impacts earnings. Our analysis, based on data from the past 12 months, shows that the peak revenue month for STRs in Ontinyent is typically August, while February often presents the lowest earnings, highlighting opportunities for strategic pricing adjustments during shoulder and low seasons. Explore the typical Airbnb income in Ontinyent across different performance tiers:
- Best-in-class properties (Top 10%) achieve $3,195+ monthly, often utilizing dynamic pricing and superior guest experiences.
- Strong performing properties (Top 25%) earn $1,915 or more, indicating effective management and desirable locations/amenities.
- Typical properties (Median) generate around $1,045 per month, representing the average market performance.
- Entry-level properties (Bottom 25%) see earnings around $559, often with potential for optimization.
Average Monthly Airbnb Earnings Trend in Ontinyent
Ontinyent Airbnb Occupancy Rate Trends (2025)
Maximize your bookings by understanding the Ontinyent STR occupancy trends. Seasonal demand shifts significantly influence how often properties are booked. Typically, Maysees the highest demand (peak season occupancy), while February experiences the lowest (low season). Effective strategies, like adjusting minimum stays or offering promotions, can boost occupancy during slower periods. Here's how different property tiers perform in Ontinyent:
- Best-in-class properties (Top 10%) achieve 78%+ occupancy, indicating high desirability and potentially optimized availability.
- Strong performing properties (Top 25%) maintain 62% or higher occupancy, suggesting good market fit and guest satisfaction.
- Typical properties (Median) have an occupancy rate around 38%.
- Entry-level properties (Bottom 25%) average 18% occupancy, potentially facing higher vacancy.
Average Monthly Occupancy Rate Trend in Ontinyent
Average Daily Rate (ADR) Airbnb Trends in Ontinyent (2025)
Effective short term rental pricing strategy in Ontinyent involves understanding monthly ADR fluctuations. The Average Daily Rate (ADR) for Airbnb in Ontinyent typically peaks in July and dips lowest during February. Leveraging Airbnb dynamic pricing tools or strategies based on this seasonality can significantly boost revenue. Here's a look at the typical nightly rates achieved:
- Best-in-class properties (Top 10%) command rates of $253+ per night, often due to premium features or locations.
- Strong performing properties (Top 25%) achieve nightly rates of $124 or more.
- Typical properties (Median) charge around $74 per night.
- Entry-level properties (Bottom 25%) earn around $43 per night.
Average Daily Rate (ADR) Trend by Month in Ontinyent
Get Live Ontinyent Market Intelligence 👇

Explore Real-time Analytics
Airbnb Seasonality Analysis & Trends in Ontinyent (2025)
Peak Season (August, May, April)
- Revenue averages $2,176 per month
- Occupancy rates average 48.9%
- Daily rates average $133
Shoulder Season
- Revenue averages $1,498 per month
- Occupancy maintains around 43.0%
- Daily rates hold near $124
Low Season (January, February, March)
- Revenue drops to average $760 per month
- Occupancy decreases to average 34.3%
- Daily rates adjust to average $100
Seasonality Insights for Ontinyent
- The Airbnb seasonality in Ontinyent shows highly seasonal trends requiring careful strategy. While the sections above show seasonal averages, it's also insightful to look at the extremes:
- During the high season, the absolute peak month showcases Ontinyent's highest earning potential, with monthly revenues capable of climbing to $2,322, occupancy reaching a high of 50.4%, and ADRs peaking at $136.
- Conversely, the slowest single month of the year, typically falling within the low season, marks the market's lowest point. In this month, revenue might dip to $601, occupancy could drop to 31.2%, and ADRs may adjust down to $99.
- Understanding both the seasonal averages and these monthly peaks and troughs in revenue, occupancy, and ADR is crucial for maximizing your Airbnb profit potential in Ontinyent.
Seasonal Strategies for Maximizing Profit
- Peak Season: Maximize revenue through premium pricing and potentially longer minimum stays. Ensure high availability.
- Low Season: Offer competitive pricing, special promotions (e.g., extended stay discounts), and flexible cancellation policies. Target off-season travelers like remote workers or budget-conscious guests.
- Shoulder Seasons: Implement dynamic pricing that balances peak and low rates. Target weekend travelers or specific events. Offer slightly more flexible terms than peak season.
- Regularly analyze your own performance against these Ontinyent seasonality benchmarks and adjust your pricing and availability strategy accordingly.
Best Areas for Airbnb Investment in Ontinyent (2025)
Exploring the top neighborhoods for short-term rentals in Ontinyent? This section highlights key areas, outlining why they are attractive for hosts and guests, along with notable local attractions. Consider these locations based on your target guest profile and investment strategy.
| Neighborhood / Area | Why Host Here? (Target Guests & Appeal) | Key Attractions & Landmarks |
|---|---|---|
| Historical Center | The heart of Ontinyent, featuring charming streets, historical architecture, and cultural landmarks. Attracts tourists interested in history and local culture, providing a unique lens into the town's heritage. | Santa Maria de Ontinyent Church, La Vila, Carrer de la Cava, Convent de les Apostoles, Local markets |
| Sant Rafel | A peaceful residential area that offers a mix of tranquility and access to local amenities. Popular among families and those looking for a quiet stay close to nature and hiking paths. | Natural parks, Hiking trails, Local cafes and restaurants |
| Ontinyent Park | A scenic park area that provides recreational spaces for families and visitors. Ideal for nature lovers and people seeking outdoor activities in a serene environment. | Parc del Àguila, Playing fields, Walking trails |
| Font de la Figuera | Known for its natural beauty with rivers and scenic landscapes. Perfect for nature retreats and outdoor adventurers looking for an authentic experience outside the urban areas. | Local river trails, Nature reserves, Cascades |
| La Vila | A vibrant neighborhood that showcases the local culture and daily life of Ontinyent. Great for visitors who want to immerse themselves in the local community and experience traditional cuisine. | Local eateries, Artisan shops, Cultural events |
| Market Square | A bustling area known for its daily market and local shops. Attracts tourists eager to experience local cuisine and culture in a lively setting. | Weekly local market, Cafes, Shops |
| Els Frares | A suburban area that offers a quiet retreat with access to parks and the nearby mountains. Good for travelers seeking a calm environment while still close to the town center. | Mountain views, Quiet streets, Natural parks |
| Carrer de les Coves | An emerging area with new developments and trendy spots. Appeals to younger travelers and digital nomads looking for modern accommodations in a developed neighborhood. | Cozy cafes, New shops, Cultural activities |
Understanding Airbnb License Requirements & STR Laws in Ontinyent (2025)
While Ontinyent, Valencian Community, Spain currently shows low STR regulations, specific Airbnb license requirements might still exist or change. Always verify the latest short term rental regulations and Airbnb license requirements directly with local government authorities for Ontinyent to ensure full compliance before hosting.
(Source: AirROI data, 2025, based on 6% licensed listings)
Top Performing Airbnb Properties in Ontinyent (2025)
Benchmark your potential! Explore examples of top-performing Airbnb properties in Ontinyentbased on Trailing Twelve Month (TTM) revenue. Analyze their characteristics, revenue, occupancy rate, and ADR to understand what drives success in this market.
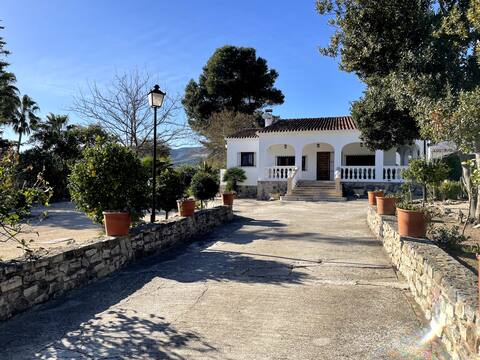
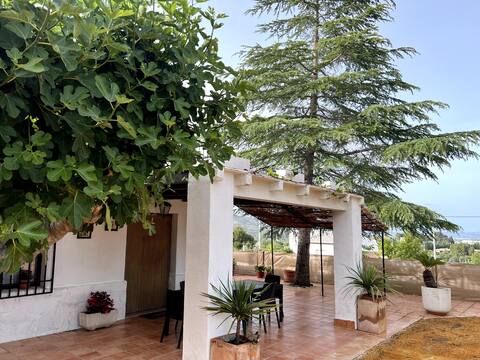
Casa los arcos Ontinyent
Entire Place • 2 bedrooms
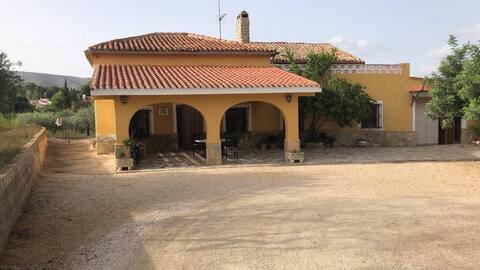
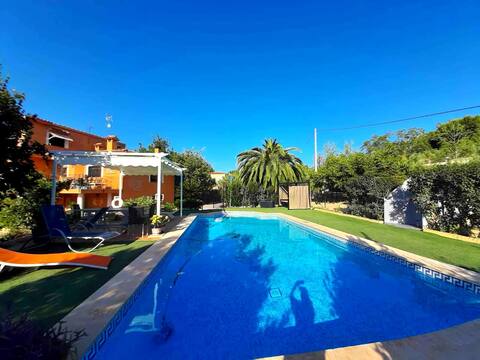
chalet en Ontinyent
Entire Place • 4 bedrooms
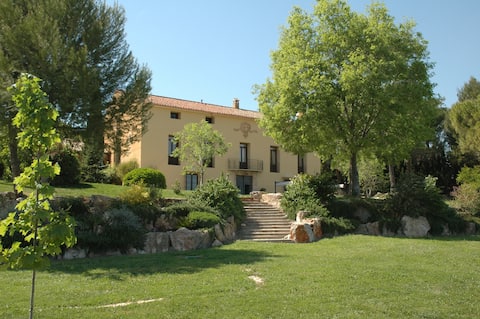
La Baronia de Dalt - Historical Villa
Entire Place • 5 bedrooms
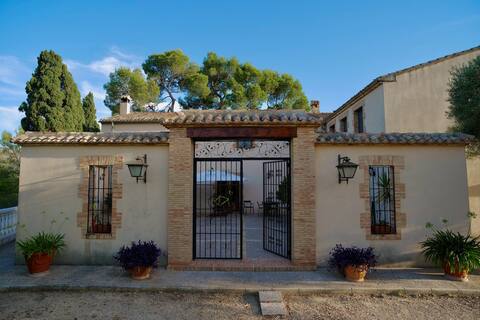
Beautifully restored 18th century rural retreat
Entire Place • 6 bedrooms
Country house in Ontinyent
Entire Place • 3 bedrooms
Beautiful Chalet, amazing views and private pool
Entire Place • 5 bedrooms
Note: Performance varies based on location, size, amenities, seasonality, and management quality. Data reflects the past 12 months.
Top Performing Airbnb Hosts in Ontinyent (2025)
Learn from the best! This table showcases top-performing Airbnb hosts in Ontinyent based on the number of properties managed and estimated total revenue over the past year. Analyze their scale and performance metrics.
| Host Name | Properties | Grossing Revenue | Stay Reviews | Avg Rating |
|---|---|---|---|---|
| Nicolette | 1 | $33,384 | 12 | 4.83/5.0 |
| Host #63741941 | 1 | $30,626 | 10 | 5.00/5.0 |
| Host #428618313 | 1 | $29,035 | 5 | 5.00/5.0 |
| Emmeline | 1 | $22,986 | 20 | 4.90/5.0 |
| Vicente | 1 | $22,702 | 43 | 4.72/5.0 |
| Lyn | 1 | $20,538 | 5 | 4.80/5.0 |
| Gareth | 1 | $17,999 | 130 | 4.88/5.0 |
| Carmen María | 1 | $17,623 | 54 | 4.70/5.0 |
| Oscar | 12 | $17,278 | 26 | 2.21/5.0 |
| Ana | 1 | $15,960 | 105 | 4.82/5.0 |
Analyzing the strategies of top hosts, such as their property selection, pricing, and guest communication, can offer valuable lessons for optimizing your own Airbnb operations in Ontinyent.
Dive Deeper: Advanced Ontinyent STR Market Data (2025)
Ready to unlock more insights? AirROI provides access to advanced metrics and comprehensive Airbnb data for Ontinyent. Explore detailed analytics beyond this report to refine your investment strategy, optimize pricing, and maximize your vacation rental profits.
Explore Advanced MetricsOntinyent Short-Term Rental Market Composition (2025): Property & Room Types
Room Type Distribution
Property Type Distribution
Market Composition Insights for Ontinyent
- The Ontinyent Airbnb market composition is heavily skewed towards Entire Home/Apt listings, which make up 50% of the 36 active rentals. This indicates strong guest preference for privacy and space.
- However, a notable 44.4% share for Private Rooms suggests opportunities for budget-conscious travelers or hosts renting out spare rooms.
- Looking at the property type distribution in Ontinyent, Apartment/Condo properties are the most common (58.3%), reflecting the local real estate landscape.
- Houses represent a significant 27.8% portion, catering likely to families or larger groups.
- The presence of 13.9% Hotel/Boutique listings indicates integration with traditional hospitality.
Ontinyent Airbnb Room Capacity Analysis (2025): Bedroom Distribution
Distribution of Listings by Number of Bedrooms
Room Capacity Insights for Ontinyent
- The dominant room capacity in Ontinyent is 1 bedroom listings, making up 30.6% of the market. This suggests a strong demand for properties suitable for couples or solo travelers.
- Together, 1 bedroom and 3 bedrooms properties represent 47.3% of the active Airbnb listings in Ontinyent, indicating a high concentration in these sizes.
- A significant 41.7% of listings offer 3+ bedrooms, catering to larger groups and families seeking more space in Ontinyent.
Ontinyent Vacation Rental Guest Capacity Trends (2025)
Distribution of Listings by Guest Capacity
Guest Capacity Insights for Ontinyent
- The most common guest capacity trend in Ontinyent vacation rentals is listings accommodating 4 guests (22.2%). This suggests the primary traveler segment is likely small families or groups.
- Properties designed for 4 guests and 1 guest dominate the Ontinyent STR market, accounting for 41.6% of listings.
- 22.3% of properties accommodate 6+ guests, serving the market segment for larger families or group travel in Ontinyent.
- On average, properties in Ontinyent are equipped to host 3.4 guests.
Ontinyent Airbnb Booking Patterns (2025): Available vs. Booked Days
Available Days Distribution
Booked Days Distribution
Booking Pattern Insights for Ontinyent
- The most common availability pattern in Ontinyent falls within the 271-366 days range, representing 69.4% of listings. This suggests many properties have significant open periods on their calendars.
- Approximately 80.5% of listings show high availability (181+ days open annually), indicating potential for increased bookings or specific owner usage patterns.
- For booked days, the 31-90 days range is most frequent in Ontinyent (38.9%), reflecting common guest stay durations or potential owner blocking patterns.
- A notable 19.5% of properties secure long booking periods (181+ days booked per year), highlighting successful long-term rental strategies or significant owner usage.
Ontinyent Airbnb Minimum Stay Requirements Analysis
Distribution of Listings by Minimum Night Requirement
1 Night
19 listings
59.4% of total
2 Nights
11 listings
34.4% of total
3 Nights
1 listings
3.1% of total
4-6 Nights
1 listings
3.1% of total
Key Insights
- The most prevalent minimum stay requirement in Ontinyent is 1 Night, adopted by 59.4% of listings. This highlights the market's preference for shorter, flexible bookings.
- A strong majority (93.8%) of the Ontinyent Airbnb data shows acceptance of very short stays (1-2 nights), indicating a dynamic, high-turnover market.
Recommendations
- Align with the market by considering a 1 Night minimum stay, as 59.4% of Ontinyent hosts use this setting.
- Adjust minimum nights based on seasonality – potentially shorter during low season and longer during peak demand periods in Ontinyent.
Ontinyent Airbnb Cancellation Policy Trends Analysis (2025)
Flexible
12 listings
54.5% of total
Moderate
6 listings
27.3% of total
Firm
2 listings
9.1% of total
Strict
2 listings
9.1% of total
Cancellation Policy Insights for Ontinyent
- The prevailing Airbnb cancellation policy trend in Ontinyent is Flexible, used by 54.5% of listings.
- The market strongly favors guest-friendly terms, with 81.8% of listings offering Flexible or Moderate policies. This suggests guests in Ontinyent may expect booking flexibility.
- Strict cancellation policies are quite rare (9.1%), potentially making listings with this policy less competitive unless justified by high demand or property type.
Recommendations for Hosts
- Consider adopting a Flexible policy to align with the 54.5% market standard in Ontinyent.
- Given the high prevalence of Flexible policies (54.5%), offering this can enhance booking appeal, especially during shoulder seasons.
- Using a Strict policy might deter some guests, as only 9.1% of listings use it. Evaluate if potential revenue protection outweighs possible lower booking rates.
- Regularly review your cancellation policy against competitors and market demand shifts in Ontinyent.
Ontinyent STR Booking Lead Time Analysis (2025)
Average Booking Lead Time by Month
Booking Lead Time Insights for Ontinyent
- The overall average booking lead time for vacation rentals in Ontinyent is 41 days.
- Guests book furthest in advance for stays during June (average 101 days), likely coinciding with peak travel demand or local events.
- The shortest booking windows occur for stays in March (average 27 days), indicating more last-minute travel plans during this time.
- Seasonally, Summer (64 days avg.) sees the longest lead times, while Winter (31 days avg.) has the shortest, reflecting typical travel planning cycles.
Recommendations for Hosts
- Use the overall average lead time (41 days) as a baseline for your pricing and availability strategy in Ontinyent.
- For June stays, consider implementing length-of-stay discounts or slightly higher rates for bookings made less than 101 days out to capitalize on advance planning.
- Target marketing efforts for the Summer season well in advance (at least 64 days) to capture early planners.
- Monitor your own booking lead times against these Ontinyent averages to identify opportunities for dynamic pricing adjustments.
Popular & Essential Airbnb Amenities in Ontinyent (2025)
Amenity Prevalence
Amenity Insights for Ontinyent
- Essential amenities in Ontinyent that guests expect include: Kitchen, Washer. Lacking these (any) could significantly impact bookings.
- Popular amenities like Wifi, TV, Air conditioning are common but not universal. Offering these can provide a competitive edge.
- Warning: Wifi is not universally provided but is considered essential globally. Ensure reliable Wifi is offered.
Recommendations for Hosts
- Ensure your listing includes all essential amenities for Ontinyent: Kitchen, Washer.
- Prioritize adding missing essentials: Washer.
- Consider adding popular differentiators like Wifi or TV to increase appeal.
- Highlight unique or less common amenities you offer (e.g., hot tub, dedicated workspace, EV charger) in your listing description and photos.
- Regularly check competitor amenities in Ontinyent to stay competitive.
Ontinyent Airbnb Guest Demographics & Profile Analysis (2025)
Guest Profile Summary for Ontinyent
- The typical guest profile for Airbnb in Ontinyent consists of a mix of domestic (58%) and international guests, often arriving from nearby Valencia, typically belonging to the Post-2000s (Gen Z/Alpha) group (50%), primarily speaking English or Spanish.
- Domestic travelers account for 58.2% of guests.
- Key international markets include Spain (58.2%) and United Kingdom (10.9%).
- Top languages spoken are English (34%) followed by Spanish (34%).
- A significant demographic segment is the Post-2000s (Gen Z/Alpha) group, representing 50% of guests.
Recommendations for Hosts
- Balance marketing efforts between domestic and international channels based on the guest mix.
- Tailor amenities and listing descriptions to appeal to the dominant Post-2000s (Gen Z/Alpha) demographic (e.g., highlight fast WiFi, smart home features, local guides).
- Highlight unique local experiences or amenities relevant to the primary guest profile.
- Consider seasonal promotions aligned with peak travel times for key origin markets.
Nearby Short-Term Rental Market Comparison
How does the Ontinyent Airbnb market stack up against its neighbors? Compare key performance metrics like average monthly revenue, ADR, and occupancy rates in surrounding areas to understand the broader regional STR landscape.
| Market | Active Properties | Monthly Revenue | Daily Rate | Avg. Occupancy |
|---|---|---|---|---|
| Macastre | 13 | $2,924 | $296.93 | 42% |
| Corbera | 13 | $2,721 | $206.87 | 41% |
| Bétera | 31 | $2,711 | $222.77 | 46% |
| l'Eliana | 33 | $2,510 | $298.45 | 43% |
| San Antonio de Benagéber | 11 | $2,374 | $335.55 | 40% |
| Manises | 25 | $2,352 | $175.71 | 38% |
| Olocau | 11 | $2,245 | $308.22 | 36% |
| Alboraia / Alboraya | 272 | $2,220 | $186.05 | 49% |
| la Pobla de Vallbona | 27 | $2,163 | $193.69 | 49% |
| Riba-roja de Túria | 21 | $2,132 | $221.03 | 41% |