Miramar Airbnb Market Analysis 2025: Short Term Rental Data & Vacation Rental Statistics in Valencian Community, Spain
Is Airbnb profitable in Miramar in 2025? Explore comprehensive Airbnb analytics for Miramar, Valencian Community, Spain to uncover income potential. This 2025 STR market report for Miramar, based on AirROI data from April 2024 to March 2025, reveals key trends in the niche market of 55 active listings.
Whether you're considering an Airbnb investment in Miramar, optimizing your existing vacation rental, or exploring rental arbitrage opportunities, understanding the Miramar Airbnb data is crucial. Understanding the local regulations is key to maximizing your short term rental income potential. Let's dive into the specifics.
Key Miramar Airbnb Performance Metrics Overview
Monthly Airbnb Revenue Variations & Income Potential in Miramar (2025)
Understanding the monthly revenue variations for Airbnb listings in Miramar is key to maximizing your short term rental income potential. Seasonality significantly impacts earnings. Our analysis, based on data from the past 12 months, shows that the peak revenue month for STRs in Miramar is typically August, while January often presents the lowest earnings, highlighting opportunities for strategic pricing adjustments during shoulder and low seasons. Explore the typical Airbnb income in Miramar across different performance tiers:
- Best-in-class properties (Top 10%) achieve $2,713+ monthly, often utilizing dynamic pricing and superior guest experiences.
- Strong performing properties (Top 25%) earn $1,868 or more, indicating effective management and desirable locations/amenities.
- Typical properties (Median) generate around $1,194 per month, representing the average market performance.
- Entry-level properties (Bottom 25%) see earnings around $618, often with potential for optimization.
Average Monthly Airbnb Earnings Trend in Miramar
Miramar Airbnb Occupancy Rate Trends (2025)
Maximize your bookings by understanding the Miramar STR occupancy trends. Seasonal demand shifts significantly influence how often properties are booked. Typically, Augustsees the highest demand (peak season occupancy), while January experiences the lowest (low season). Effective strategies, like adjusting minimum stays or offering promotions, can boost occupancy during slower periods. Here's how different property tiers perform in Miramar:
- Best-in-class properties (Top 10%) achieve 79%+ occupancy, indicating high desirability and potentially optimized availability.
- Strong performing properties (Top 25%) maintain 50% or higher occupancy, suggesting good market fit and guest satisfaction.
- Typical properties (Median) have an occupancy rate around 31%.
- Entry-level properties (Bottom 25%) average 16% occupancy, potentially facing higher vacancy.
Average Monthly Occupancy Rate Trend in Miramar
Average Daily Rate (ADR) Airbnb Trends in Miramar (2025)
Effective short term rental pricing strategy in Miramar involves understanding monthly ADR fluctuations. The Average Daily Rate (ADR) for Airbnb in Miramar typically peaks in August and dips lowest during February. Leveraging Airbnb dynamic pricing tools or strategies based on this seasonality can significantly boost revenue. Here's a look at the typical nightly rates achieved:
- Best-in-class properties (Top 10%) command rates of $180+ per night, often due to premium features or locations.
- Strong performing properties (Top 25%) achieve nightly rates of $116 or more.
- Typical properties (Median) charge around $91 per night.
- Entry-level properties (Bottom 25%) earn around $76 per night.
Average Daily Rate (ADR) Trend by Month in Miramar
Get Live Miramar Market Intelligence 👇

Explore Real-time Analytics
Airbnb Seasonality Analysis & Trends in Miramar (2025)
Peak Season (August, July, June)
- Revenue averages $2,639 per month
- Occupancy rates average 57.4%
- Daily rates average $119
Shoulder Season
- Revenue averages $1,219 per month
- Occupancy maintains around 34.6%
- Daily rates hold near $110
Low Season (January, March, December)
- Revenue drops to average $641 per month
- Occupancy decreases to average 23.7%
- Daily rates adjust to average $105
Seasonality Insights for Miramar
- The Airbnb seasonality in Miramar shows highly seasonal trends requiring careful strategy. While the sections above show seasonal averages, it's also insightful to look at the extremes:
- During the high season, the absolute peak month showcases Miramar's highest earning potential, with monthly revenues capable of climbing to $2,890, occupancy reaching a high of 68.7%, and ADRs peaking at $120.
- Conversely, the slowest single month of the year, typically falling within the low season, marks the market's lowest point. In this month, revenue might dip to $562, occupancy could drop to 20.1%, and ADRs may adjust down to $101.
- Understanding both the seasonal averages and these monthly peaks and troughs in revenue, occupancy, and ADR is crucial for maximizing your Airbnb profit potential in Miramar.
Seasonal Strategies for Maximizing Profit
- Peak Season: Maximize revenue through premium pricing and potentially longer minimum stays. Ensure high availability.
- Low Season: Offer competitive pricing, special promotions (e.g., extended stay discounts), and flexible cancellation policies. Target off-season travelers like remote workers or budget-conscious guests.
- Shoulder Seasons: Implement dynamic pricing that balances peak and low rates. Target weekend travelers or specific events. Offer slightly more flexible terms than peak season.
- Regularly analyze your own performance against these Miramar seasonality benchmarks and adjust your pricing and availability strategy accordingly.
Best Areas for Airbnb Investment in Miramar (2025)
Exploring the top neighborhoods for short-term rentals in Miramar? This section highlights key areas, outlining why they are attractive for hosts and guests, along with notable local attractions. Consider these locations based on your target guest profile and investment strategy.
| Neighborhood / Area | Why Host Here? (Target Guests & Appeal) | Key Attractions & Landmarks |
|---|---|---|
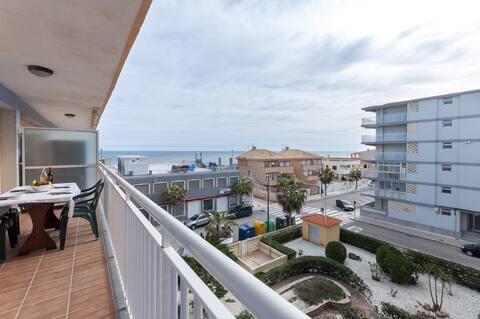
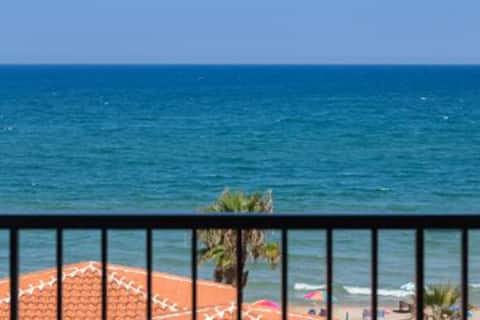
| Playa de Miramar | A beautiful beach area with golden sands attracting families and tourists. The beachfront promenade offers bars and restaurants, ideal for vacationers seeking relaxation and leisure activities. | Miramar Beach, Miramar Marina, Local seafood restaurants, Beachfront cafes, Water sports activities |
| Centro de Miramar | The downtown area with shops and cultural attractions. It is a vibrant hub that appeals to tourists, offering easy access to local events and historical sites. | Miramar Town Hall, Local markets, Cultural festivals, Parks and gardens, Shopping streets |
| Miramar Golf Club | An ideal area for golf enthusiasts. It features a well-kept golf course and caters to both tourists and residents looking for recreational activities in nature. | Golf course, Clubhouse with dining, Nature trails, Picnic areas, Golf tournaments |
| La Albufera | A beautiful natural park nearby that attracts nature lovers and bird watchers. Offers a unique experience for tourists interested in outdoor activities, such as boating and hiking. | La Albufera Natural Park, Boat tours, Birdwatching, Local paella restaurants, Scenic viewpoints |
| Urbanizaciones de Miramar | Residential areas that offer a unique mix of local living and tourism. Ideal for families looking for a home-like stay with easy access to attractions and amenities. | Local playgrounds, Community parks, Residential markets, Family-friendly restaurants, Cultural events |
| El Saler Beach | Located a bit further but offers stunning scenery and a more tranquil beach experience. Perfect for travelers looking to escape the crowds. | Quiet beach areas, Sand dunes, Beach bars, Charming seaside promenades, Water sports |
| Miramar Nature Reserve | A protected area that showcases the local flora and fauna. A great spot for eco-tourism and attracting visitors interested in conservation and nature walks. | Nature trails, Wildlife observing, Educational programs, Scenic landscapes, Photography opportunities |
| Cultural Center of Miramar | A hub for artistic and cultural events. Attracts tourists interested in local culture, music, and performances, making it a vibrant area for short-term rentals. | Art exhibitions, Live music events, Theater performances, Workshops, Community events |
Understanding Airbnb License Requirements & STR Laws in Miramar (2025)
With 24% of listings showing registration in 2025, understanding potential Airbnb license requirements is crucial in Miramar. Always verify the latest short term rental regulations and Airbnb license requirements directly with local government authorities for Miramar to ensure full compliance before hosting.
(Source: AirROI data, 2025, based on 24% licensed listings)
Top Performing Airbnb Properties in Miramar (2025)
Benchmark your potential! Explore examples of top-performing Airbnb properties in Miramarbased on Trailing Twelve Month (TTM) revenue. Analyze their characteristics, revenue, occupancy rate, and ADR to understand what drives success in this market.
Amanecer (marenys)
Entire Place • 3 bedrooms

House on the beach a few meters from the sea with garage
Entire Place • 2 bedrooms

Second line swimming pool flat facing the sea
Entire Place • 3 bedrooms

1st line, elevator air ac. and private parking
Entire Place • 3 bedrooms

Apartment in Playa de Miramar
Entire Place • 1 bedroom
Miramar beach ocean view
Entire Place • 3 bedrooms
Note: Performance varies based on location, size, amenities, seasonality, and management quality. Data reflects the past 12 months.
Top Performing Airbnb Hosts in Miramar (2025)
Learn from the best! This table showcases top-performing Airbnb hosts in Miramar based on the number of properties managed and estimated total revenue over the past year. Analyze their scale and performance metrics.
| Host Name | Properties | Grossing Revenue | Stay Reviews | Avg Rating |
|---|---|---|---|---|
| Host #80839530 | 1 | $48,467 | 3 | 3.33/5.0 |
| Paula | 1 | $28,769 | 11 | 5.00/5.0 |
| Arnau | 1 | $28,217 | 54 | 4.96/5.0 |
| David | 1 | $26,750 | 23 | 4.61/5.0 |
| Saul | 1 | $23,434 | 22 | 4.82/5.0 |
| Teresa | 1 | $22,919 | 52 | 4.60/5.0 |
| Bruno | 1 | $22,357 | 24 | 4.67/5.0 |
| Sara | 1 | $20,604 | 13 | 4.62/5.0 |
| Aurelio | 1 | $20,053 | 26 | 4.62/5.0 |
| Julia | 1 | $19,581 | 70 | 4.71/5.0 |
Analyzing the strategies of top hosts, such as their property selection, pricing, and guest communication, can offer valuable lessons for optimizing your own Airbnb operations in Miramar.
Dive Deeper: Advanced Miramar STR Market Data (2025)
Ready to unlock more insights? AirROI provides access to advanced metrics and comprehensive Airbnb data for Miramar. Explore detailed analytics beyond this report to refine your investment strategy, optimize pricing, and maximize your vacation rental profits.
Explore Advanced MetricsMiramar Short-Term Rental Market Composition (2025): Property & Room Types
Room Type Distribution
Property Type Distribution
Market Composition Insights for Miramar
- The Miramar Airbnb market composition is heavily skewed towards Entire Home/Apt listings, which make up 100% of the 55 active rentals. This indicates strong guest preference for privacy and space.
- Looking at the property type distribution in Miramar, Apartment/Condo properties are the most common (76.4%), reflecting the local real estate landscape.
- Houses represent a significant 21.8% portion, catering likely to families or larger groups.
- Smaller segments like others (combined 1.8%) offer potential for unique stay experiences.
Miramar Airbnb Room Capacity Analysis (2025): Bedroom Distribution
Distribution of Listings by Number of Bedrooms
Room Capacity Insights for Miramar
- The dominant room capacity in Miramar is 3 bedrooms listings, making up 40% of the market. This suggests a strong demand for properties suitable for families or small groups.
- Together, 3 bedrooms and 2 bedrooms properties represent 80.0% of the active Airbnb listings in Miramar, indicating a high concentration in these sizes.
- A significant 40.0% of listings offer 3+ bedrooms, catering to larger groups and families seeking more space in Miramar.
Miramar Vacation Rental Guest Capacity Trends (2025)
Distribution of Listings by Guest Capacity
Guest Capacity Insights for Miramar
- The most common guest capacity trend in Miramar vacation rentals is listings accommodating 4 guests (36.4%). This suggests the primary traveler segment is likely small families or groups.
- Properties designed for 4 guests and 6 guests dominate the Miramar STR market, accounting for 65.5% of listings.
- 36.4% of properties accommodate 6+ guests, serving the market segment for larger families or group travel in Miramar.
- On average, properties in Miramar are equipped to host 4.9 guests.
Miramar Airbnb Booking Patterns (2025): Available vs. Booked Days
Available Days Distribution
Booked Days Distribution
Booking Pattern Insights for Miramar
- The most common availability pattern in Miramar falls within the 271-366 days range, representing 58.2% of listings. This suggests many properties have significant open periods on their calendars.
- Approximately 87.3% of listings show high availability (181+ days open annually), indicating potential for increased bookings or specific owner usage patterns.
- For booked days, the 31-90 days range is most frequent in Miramar (40%), reflecting common guest stay durations or potential owner blocking patterns.
- A notable 14.5% of properties secure long booking periods (181+ days booked per year), highlighting successful long-term rental strategies or significant owner usage.
Miramar Airbnb Minimum Stay Requirements Analysis
Distribution of Listings by Minimum Night Requirement
1 Night
3 listings
5.9% of total
2 Nights
12 listings
23.5% of total
3 Nights
6 listings
11.8% of total
4-6 Nights
10 listings
19.6% of total
7-29 Nights
13 listings
25.5% of total
30+ Nights
7 listings
13.7% of total
Key Insights
- The most prevalent minimum stay requirement in Miramar is 7-29 Nights, adopted by 25.5% of listings. This highlights the market's preference for shorter, flexible bookings.
- A significant segment (13.7%) caters to monthly stays (30+ nights) in Miramar, pointing to opportunities in the extended-stay market.
Recommendations
- Align with the market by considering a 7-29 Nights minimum stay, as 25.5% of Miramar hosts use this setting.
- If feasible, allowing 1-night stays, especially midweek or during low season, could capture last-minute bookings, as only 5.9% currently do.
- Explore offering discounts for stays of 30+ nights to attract the 13.7% of the market seeking extended stays.
- Adjust minimum nights based on seasonality – potentially shorter during low season and longer during peak demand periods in Miramar.
Miramar Airbnb Cancellation Policy Trends Analysis (2025)
Flexible
6 listings
14.6% of total
Moderate
12 listings
29.3% of total
Firm
15 listings
36.6% of total
Strict
8 listings
19.5% of total
Cancellation Policy Insights for Miramar
- The prevailing Airbnb cancellation policy trend in Miramar is Firm, used by 36.6% of listings.
- A majority (56.1%) of hosts in Miramar utilize Firm or Strict policies, indicating a market where hosts prioritize booking security.
Recommendations for Hosts
- Consider adopting a Firm policy to align with the 36.6% market standard in Miramar.
- Regularly review your cancellation policy against competitors and market demand shifts in Miramar.
Miramar STR Booking Lead Time Analysis (2025)
Average Booking Lead Time by Month
Booking Lead Time Insights for Miramar
- The overall average booking lead time for vacation rentals in Miramar is 46 days.
- Guests book furthest in advance for stays during July (average 116 days), likely coinciding with peak travel demand or local events.
- The shortest booking windows occur for stays in January (average 28 days), indicating more last-minute travel plans during this time.
- Seasonally, Summer (81 days avg.) sees the longest lead times, while Spring (45 days avg.) has the shortest, reflecting typical travel planning cycles.
Recommendations for Hosts
- Use the overall average lead time (46 days) as a baseline for your pricing and availability strategy in Miramar.
- For July stays, consider implementing length-of-stay discounts or slightly higher rates for bookings made less than 116 days out to capitalize on advance planning.
- Target marketing efforts for the Summer season well in advance (at least 81 days) to capture early planners.
- Monitor your own booking lead times against these Miramar averages to identify opportunities for dynamic pricing adjustments.
Popular & Essential Airbnb Amenities in Miramar (2025)
Amenity Prevalence
Amenity Insights for Miramar
- Essential amenities in Miramar that guests expect include: TV, Washer, Kitchen. Lacking these (any) could significantly impact bookings.
- Popular amenities like Hot water, Essentials, Wifi are common but not universal. Offering these can provide a competitive edge.
- Warning: Wifi is not universally provided but is considered essential globally. Ensure reliable Wifi is offered.
Recommendations for Hosts
- Ensure your listing includes all essential amenities for Miramar: TV, Washer, Kitchen.
- Prioritize adding missing essentials: Washer, Kitchen.
- Consider adding popular differentiators like Hot water or Essentials to increase appeal.
- Highlight unique or less common amenities you offer (e.g., hot tub, dedicated workspace, EV charger) in your listing description and photos.
- Regularly check competitor amenities in Miramar to stay competitive.
Miramar Airbnb Guest Demographics & Profile Analysis (2025)
Guest Profile Summary for Miramar
- The typical guest profile for Airbnb in Miramar consists of a mix of domestic (59%) and international guests, often arriving from nearby Madrid, typically belonging to the Post-2000s (Gen Z/Alpha) group (50%), primarily speaking Spanish or English.
- Domestic travelers account for 58.5% of guests.
- Key international markets include Spain (58.5%) and France (15%).
- Top languages spoken are Spanish (34.3%) followed by English (29.5%).
- A significant demographic segment is the Post-2000s (Gen Z/Alpha) group, representing 50% of guests.
Recommendations for Hosts
- Balance marketing efforts between domestic and international channels based on the guest mix.
- Tailor amenities and listing descriptions to appeal to the dominant Post-2000s (Gen Z/Alpha) demographic (e.g., highlight fast WiFi, smart home features, local guides).
- Highlight unique local experiences or amenities relevant to the primary guest profile.
- Consider seasonal promotions aligned with peak travel times for key origin markets.
Nearby Short-Term Rental Market Comparison
How does the Miramar Airbnb market stack up against its neighbors? Compare key performance metrics like average monthly revenue, ADR, and occupancy rates in surrounding areas to understand the broader regional STR landscape.
| Market | Active Properties | Monthly Revenue | Daily Rate | Avg. Occupancy |
|---|---|---|---|---|
| Macastre | 13 | $2,924 | $296.93 | 42% |
| Corbera | 13 | $2,721 | $206.87 | 41% |
| Bétera | 31 | $2,711 | $222.77 | 46% |
| l'Eliana | 33 | $2,510 | $298.45 | 43% |
| San Antonio de Benagéber | 11 | $2,374 | $335.55 | 40% |
| Manises | 25 | $2,352 | $175.71 | 38% |
| Olocau | 11 | $2,245 | $308.22 | 36% |
| Alboraia / Alboraya | 272 | $2,220 | $186.05 | 49% |
| la Pobla de Vallbona | 27 | $2,163 | $193.69 | 49% |
| Riba-roja de Túria | 21 | $2,132 | $221.03 | 41% |