Los Montesinos Airbnb Market Analysis 2025: Short Term Rental Data & Vacation Rental Statistics in Valencian Community, Spain
Is Airbnb profitable in Los Montesinos in 2025? Explore comprehensive Airbnb analytics for Los Montesinos, Valencian Community, Spain to uncover income potential. This 2025 STR market report for Los Montesinos, based on AirROI data from April 2024 to March 2025, reveals key trends in the niche market of 39 active listings.
Whether you're considering an Airbnb investment in Los Montesinos, optimizing your existing vacation rental, or exploring rental arbitrage opportunities, understanding the Los Montesinos Airbnb data is crucial. Understanding the local regulations is key to maximizing your short term rental income potential. Let's dive into the specifics.
Key Los Montesinos Airbnb Performance Metrics Overview
Monthly Airbnb Revenue Variations & Income Potential in Los Montesinos (2025)
Understanding the monthly revenue variations for Airbnb listings in Los Montesinos is key to maximizing your short term rental income potential. Seasonality significantly impacts earnings. Our analysis, based on data from the past 12 months, shows that the peak revenue month for STRs in Los Montesinos is typically August, while January often presents the lowest earnings, highlighting opportunities for strategic pricing adjustments during shoulder and low seasons. Explore the typical Airbnb income in Los Montesinos across different performance tiers:
- Best-in-class properties (Top 10%) achieve $4,704+ monthly, often utilizing dynamic pricing and superior guest experiences.
- Strong performing properties (Top 25%) earn $3,550 or more, indicating effective management and desirable locations/amenities.
- Typical properties (Median) generate around $1,750 per month, representing the average market performance.
- Entry-level properties (Bottom 25%) see earnings around $819, often with potential for optimization.
Average Monthly Airbnb Earnings Trend in Los Montesinos
Los Montesinos Airbnb Occupancy Rate Trends (2025)
Maximize your bookings by understanding the Los Montesinos STR occupancy trends. Seasonal demand shifts significantly influence how often properties are booked. Typically, Augustsees the highest demand (peak season occupancy), while January experiences the lowest (low season). Effective strategies, like adjusting minimum stays or offering promotions, can boost occupancy during slower periods. Here's how different property tiers perform in Los Montesinos:
- Best-in-class properties (Top 10%) achieve 67%+ occupancy, indicating high desirability and potentially optimized availability.
- Strong performing properties (Top 25%) maintain 50% or higher occupancy, suggesting good market fit and guest satisfaction.
- Typical properties (Median) have an occupancy rate around 36%.
- Entry-level properties (Bottom 25%) average 20% occupancy, potentially facing higher vacancy.
Average Monthly Occupancy Rate Trend in Los Montesinos
Average Daily Rate (ADR) Airbnb Trends in Los Montesinos (2025)
Effective short term rental pricing strategy in Los Montesinos involves understanding monthly ADR fluctuations. The Average Daily Rate (ADR) for Airbnb in Los Montesinos typically peaks in August and dips lowest during February. Leveraging Airbnb dynamic pricing tools or strategies based on this seasonality can significantly boost revenue. Here's a look at the typical nightly rates achieved:
- Best-in-class properties (Top 10%) command rates of $224+ per night, often due to premium features or locations.
- Strong performing properties (Top 25%) achieve nightly rates of $181 or more.
- Typical properties (Median) charge around $129 per night.
- Entry-level properties (Bottom 25%) earn around $71 per night.
Average Daily Rate (ADR) Trend by Month in Los Montesinos
Get Live Los Montesinos Market Intelligence 👇

Explore Real-time Analytics
Airbnb Seasonality Analysis & Trends in Los Montesinos (2025)
Peak Season (August, May, July)
- Revenue averages $3,931 per month
- Occupancy rates average 58.4%
- Daily rates average $154
Shoulder Season
- Revenue averages $2,194 per month
- Occupancy maintains around 36.8%
- Daily rates hold near $142
Low Season (January, March, November)
- Revenue drops to average $968 per month
- Occupancy decreases to average 23.8%
- Daily rates adjust to average $129
Seasonality Insights for Los Montesinos
- The Airbnb seasonality in Los Montesinos shows highly seasonal trends requiring careful strategy. While the sections above show seasonal averages, it's also insightful to look at the extremes:
- During the high season, the absolute peak month showcases Los Montesinos's highest earning potential, with monthly revenues capable of climbing to $4,662, occupancy reaching a high of 86.0%, and ADRs peaking at $157.
- Conversely, the slowest single month of the year, typically falling within the low season, marks the market's lowest point. In this month, revenue might dip to $835, occupancy could drop to 18.4%, and ADRs may adjust down to $127.
- Understanding both the seasonal averages and these monthly peaks and troughs in revenue, occupancy, and ADR is crucial for maximizing your Airbnb profit potential in Los Montesinos.
Seasonal Strategies for Maximizing Profit
- Peak Season: Maximize revenue through premium pricing and potentially longer minimum stays. Ensure high availability.
- Low Season: Offer competitive pricing, special promotions (e.g., extended stay discounts), and flexible cancellation policies. Target off-season travelers like remote workers or budget-conscious guests.
- Shoulder Seasons: Implement dynamic pricing that balances peak and low rates. Target weekend travelers or specific events. Offer slightly more flexible terms than peak season.
- Regularly analyze your own performance against these Los Montesinos seasonality benchmarks and adjust your pricing and availability strategy accordingly.
Best Areas for Airbnb Investment in Los Montesinos (2025)
Exploring the top neighborhoods for short-term rentals in Los Montesinos? This section highlights key areas, outlining why they are attractive for hosts and guests, along with notable local attractions. Consider these locations based on your target guest profile and investment strategy.
| Neighborhood / Area | Why Host Here? (Target Guests & Appeal) | Key Attractions & Landmarks |
|---|---|---|
| La Zenia | A popular coastal area with beautiful beaches and a vibrant atmosphere. Ideal for tourists looking for sun and sea, close to shopping and dining options. | La Zenia Beach, Zenia Boulevard Shopping Centre, Cabo Roig Beach, Playa Flamenca, Las Ramblas Golf Course |
| Torre de la Horadada | A charming seaside town with stunning beaches and a relaxed vibe. Great for families and those seeking a tranquil getaway. | Playa de las Higuericas, Playa del Puerto, Marina de Torre de la Horadada, Torre de la Horadada Lighthouse, Paseo Marítimo |
| San Miguel de Salinas | A picturesque village located inland with panoramic views of the surrounding countryside. Attractive for those looking for a quieter stay with local charm. | San Miguel de Salinas Town Centre, La Ermita de la Virgen de la Esperanza, Salt Lakes of Torrevieja, Local markets |
| El Mojón | A quieter coastal area known for its beautiful beaches. Perfect for those seeking a peaceful retreat with access to the sea. | Playa de El Mojón, Natural Park of Salinas de San Pedro, Beach bars and restaurants |
| Guardamar del Segura | A vibrant town with extensive sandy beaches and natural parks. Great for outdoor activities and relaxation. | Guardamar Beach, Dunes of Guardamar Natural Park, El Moncayo Beach, Local parks and markets |
| Los Alcázares | A lovely coastal town known for its warm temperatures and water activities. Popular among tourists for its beachfront and leisure options. | Los Alcázares Beach, Las Carrascosas Beach, Mar Menor lagoon, Local restaurants and shops |
| Rojales | An inland town offering a mix of Spanish culture and nature, attracting those interested in the local lifestyle and amenities. | Cuevas del Rodeo, La Marquesa Golf, Local parks, Traditional Spanish fiestas |
| Costa Blanca | The broader coastal region known for its stunning beaches and tourist infrastructure. A top choice for vacationers from all over Europe. | Benidorm, Alicante Beaches, Altea Old Town, Torre del Benidorm |
Understanding Airbnb License Requirements & STR Laws in Los Montesinos (2025)
With 26% of listings showing registration in 2025, understanding potential Airbnb license requirements is crucial in Los Montesinos. Always verify the latest short term rental regulations and Airbnb license requirements directly with local government authorities for Los Montesinos to ensure full compliance before hosting.
(Source: AirROI data, 2025, based on 26% licensed listings)
Top Performing Airbnb Properties in Los Montesinos (2025)
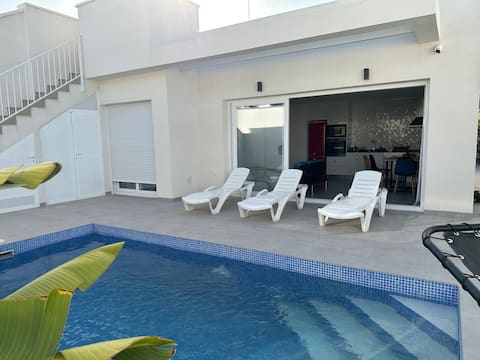
Benchmark your potential! Explore examples of top-performing Airbnb properties in Los Montesinosbased on Trailing Twelve Month (TTM) revenue. Analyze their characteristics, revenue, occupancy rate, and ADR to understand what drives success in this market.

Sunshine Villa by Fidalsa
Entire Place • 4 bedrooms
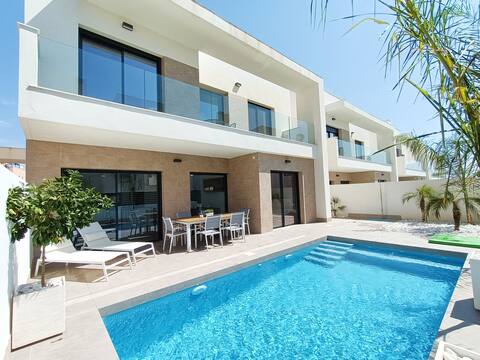
Villa de Luxury la Laguna
Entire Place • 3 bedrooms
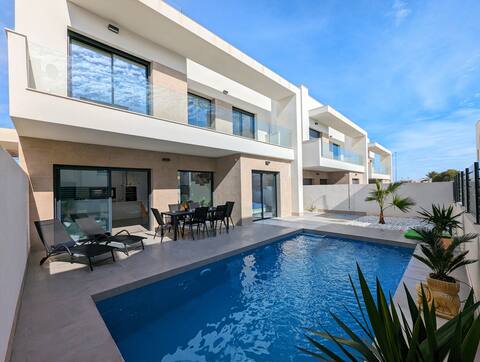
Luxury new build villa with private pool
Entire Place • 3 bedrooms

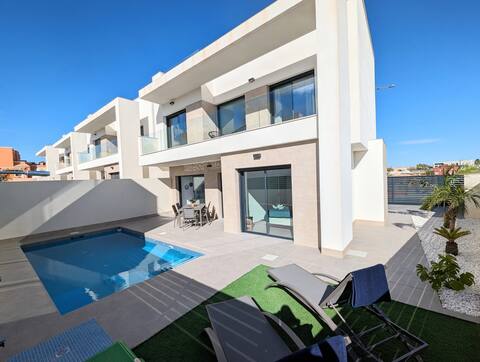
Mediterranean Boutique Villa ~ The Delano
Entire Place • 3 bedrooms
Large new modern Villa with private pool
Entire Place • 3 bedrooms
Large corner new build villa with private pool
Entire Place • 3 bedrooms
Note: Performance varies based on location, size, amenities, seasonality, and management quality. Data reflects the past 12 months.
Top Performing Airbnb Hosts in Los Montesinos (2025)
Learn from the best! This table showcases top-performing Airbnb hosts in Los Montesinos based on the number of properties managed and estimated total revenue over the past year. Analyze their scale and performance metrics.
| Host Name | Properties | Grossing Revenue | Stay Reviews | Avg Rating |
|---|---|---|---|---|
| Lorena | 11 | $300,998 | 105 | 4.40/5.0 |
| Fidalsaholidays | 1 | $78,105 | 14 | 4.57/5.0 |
| Sunrise Apartments | 7 | $50,136 | 9 | 1.31/5.0 |
| Ivan Antonio | 1 | $47,960 | 11 | 4.73/5.0 |
| Host #161528325 | 1 | $40,770 | 0 | 0.00/5.0 |
| Host #230387156 | 1 | $23,280 | 1 | 0.00/5.0 |
| Zoe Elizabeth | 1 | $22,663 | 4 | 4.75/5.0 |
| Host #87353354 | 2 | $19,877 | 1 | 0.00/5.0 |
| Carmen | 3 | $18,901 | 35 | 4.92/5.0 |
| Alicia | 1 | $14,179 | 4 | 5.00/5.0 |
Analyzing the strategies of top hosts, such as their property selection, pricing, and guest communication, can offer valuable lessons for optimizing your own Airbnb operations in Los Montesinos.
Dive Deeper: Advanced Los Montesinos STR Market Data (2025)
Ready to unlock more insights? AirROI provides access to advanced metrics and comprehensive Airbnb data for Los Montesinos. Explore detailed analytics beyond this report to refine your investment strategy, optimize pricing, and maximize your vacation rental profits.
Explore Advanced MetricsLos Montesinos Short-Term Rental Market Composition (2025): Property & Room Types
Room Type Distribution
Property Type Distribution
Market Composition Insights for Los Montesinos
- The Los Montesinos Airbnb market composition is heavily skewed towards Entire Home/Apt listings, which make up 100% of the 39 active rentals. This indicates strong guest preference for privacy and space.
- Looking at the property type distribution in Los Montesinos, House properties are the most common (53.8%), reflecting the local real estate landscape.
- Houses represent a significant 53.8% portion, catering likely to families or larger groups.
- Smaller segments like hotel/boutique (combined 2.6%) offer potential for unique stay experiences.
Los Montesinos Airbnb Room Capacity Analysis (2025): Bedroom Distribution
Distribution of Listings by Number of Bedrooms
Room Capacity Insights for Los Montesinos
- The dominant room capacity in Los Montesinos is 3 bedrooms listings, making up 48.7% of the market. This suggests a strong demand for properties suitable for families or small groups.
- Together, 3 bedrooms and 2 bedrooms properties represent 71.8% of the active Airbnb listings in Los Montesinos, indicating a high concentration in these sizes.
- A significant 59.0% of listings offer 3+ bedrooms, catering to larger groups and families seeking more space in Los Montesinos.
Los Montesinos Vacation Rental Guest Capacity Trends (2025)
Distribution of Listings by Guest Capacity
Guest Capacity Insights for Los Montesinos
- The most common guest capacity trend in Los Montesinos vacation rentals is listings accommodating 6 guests (43.6%). This suggests the primary traveler segment is likely larger groups.
- Properties designed for 6 guests and 4 guests dominate the Los Montesinos STR market, accounting for 56.4% of listings.
- 59.0% of properties accommodate 6+ guests, serving the market segment for larger families or group travel in Los Montesinos.
- On average, properties in Los Montesinos are equipped to host 5.2 guests.
Los Montesinos Airbnb Booking Patterns (2025): Available vs. Booked Days
Available Days Distribution
Booked Days Distribution
Booking Pattern Insights for Los Montesinos
- The most common availability pattern in Los Montesinos falls within the 271-366 days range, representing 61.5% of listings. This suggests many properties have significant open periods on their calendars.
- Approximately 87.1% of listings show high availability (181+ days open annually), indicating potential for increased bookings or specific owner usage patterns.
- For booked days, the 31-90 days range is most frequent in Los Montesinos (46.2%), reflecting common guest stay durations or potential owner blocking patterns.
- A notable 15.4% of properties secure long booking periods (181+ days booked per year), highlighting successful long-term rental strategies or significant owner usage.
Los Montesinos Airbnb Minimum Stay Requirements Analysis
Distribution of Listings by Minimum Night Requirement
2 Nights
7 listings
18.4% of total
3 Nights
2 listings
5.3% of total
4-6 Nights
15 listings
39.5% of total
7-29 Nights
5 listings
13.2% of total
30+ Nights
9 listings
23.7% of total
Key Insights
- The most prevalent minimum stay requirement in Los Montesinos is 4-6 Nights, adopted by 39.5% of listings. This highlights the market's preference for longer commitments.
- Very short stays (1-2 nights) are less common (18.4%), suggesting hosts prefer slightly longer bookings to optimize turnover.
- A significant segment (23.7%) caters to monthly stays (30+ nights) in Los Montesinos, pointing to opportunities in the extended-stay market.
Recommendations
- Align with the market by considering a 4-6 Nights minimum stay, as 39.5% of Los Montesinos hosts use this setting.
- Explore offering discounts for stays of 30+ nights to attract the 23.7% of the market seeking extended stays.
- Adjust minimum nights based on seasonality – potentially shorter during low season and longer during peak demand periods in Los Montesinos.
Los Montesinos Airbnb Cancellation Policy Trends Analysis (2025)
Super Strict 60 Days
1 listings
4% of total
Flexible
6 listings
24% of total
Moderate
5 listings
20% of total
Firm
10 listings
40% of total
Strict
3 listings
12% of total
Cancellation Policy Insights for Los Montesinos
- The prevailing Airbnb cancellation policy trend in Los Montesinos is Firm, used by 40% of listings.
- A majority (52.0%) of hosts in Los Montesinos utilize Firm or Strict policies, indicating a market where hosts prioritize booking security.
Recommendations for Hosts
- Consider adopting a Firm policy to align with the 40% market standard in Los Montesinos.
- Using a Strict policy might deter some guests, as only 12% of listings use it. Evaluate if potential revenue protection outweighs possible lower booking rates.
- Regularly review your cancellation policy against competitors and market demand shifts in Los Montesinos.
Los Montesinos STR Booking Lead Time Analysis (2025)
Average Booking Lead Time by Month
Booking Lead Time Insights for Los Montesinos
- The overall average booking lead time for vacation rentals in Los Montesinos is 47 days.
- Guests book furthest in advance for stays during May (average 112 days), likely coinciding with peak travel demand or local events.
- The shortest booking windows occur for stays in February (average 25 days), indicating more last-minute travel plans during this time.
- Seasonally, Summer (84 days avg.) sees the longest lead times, while Winter (48 days avg.) has the shortest, reflecting typical travel planning cycles.
Recommendations for Hosts
- Use the overall average lead time (47 days) as a baseline for your pricing and availability strategy in Los Montesinos.
- For May stays, consider implementing length-of-stay discounts or slightly higher rates for bookings made less than 112 days out to capitalize on advance planning.
- Target marketing efforts for the Summer season well in advance (at least 84 days) to capture early planners.
- Monitor your own booking lead times against these Los Montesinos averages to identify opportunities for dynamic pricing adjustments.
Popular & Essential Airbnb Amenities in Los Montesinos (2025)
Amenity Prevalence
Amenity Insights for Los Montesinos
- Essential amenities in Los Montesinos that guests expect include: TV, Kitchen, Washer, Air conditioning, Wifi. Lacking these (any) could significantly impact bookings.
- Popular amenities like Hot water, Essentials, Heating are common but not universal. Offering these can provide a competitive edge.
Recommendations for Hosts
- Ensure your listing includes all essential amenities for Los Montesinos: TV, Kitchen, Washer, Air conditioning, Wifi.
- Prioritize adding missing essentials: Wifi.
- Consider adding popular differentiators like Hot water or Essentials to increase appeal.
- Highlight unique or less common amenities you offer (e.g., hot tub, dedicated workspace, EV charger) in your listing description and photos.
- Regularly check competitor amenities in Los Montesinos to stay competitive.
Los Montesinos Airbnb Guest Demographics & Profile Analysis (2025)
Guest Profile Summary for Los Montesinos
- The typical guest profile for Airbnb in Los Montesinos consists of predominantly international visitors (83%), with top international origins including France, typically belonging to the Post-2000s (Gen Z/Alpha) group (50%), primarily speaking English or French.
- Domestic travelers account for 17.4% of guests.
- Key international markets include United Kingdom (25.6%) and France (20.9%).
- Top languages spoken are English (42.7%) followed by French (14.6%).
- A significant demographic segment is the Post-2000s (Gen Z/Alpha) group, representing 50% of guests.
Recommendations for Hosts
- Focus marketing internationally, particularly towards travelers from France.
- Tailor amenities and listing descriptions to appeal to the dominant Post-2000s (Gen Z/Alpha) demographic (e.g., highlight fast WiFi, smart home features, local guides).
- Highlight unique local experiences or amenities relevant to the primary guest profile.
- Consider seasonal promotions aligned with peak travel times for key origin markets.
Nearby Short-Term Rental Market Comparison
How does the Los Montesinos Airbnb market stack up against its neighbors? Compare key performance metrics like average monthly revenue, ADR, and occupancy rates in surrounding areas to understand the broader regional STR landscape.
| Market | Active Properties | Monthly Revenue | Daily Rate | Avg. Occupancy |
|---|---|---|---|---|
| Macastre | 13 | $2,924 | $296.93 | 42% |
| Corbera | 13 | $2,721 | $206.87 | 41% |
| Bétera | 31 | $2,711 | $222.77 | 46% |
| l'Eliana | 33 | $2,510 | $298.45 | 43% |
| San Antonio de Benagéber | 11 | $2,374 | $335.55 | 40% |
| Manises | 25 | $2,352 | $175.71 | 38% |
| Olocau | 11 | $2,245 | $308.22 | 36% |
| Alboraia / Alboraya | 272 | $2,220 | $186.05 | 49% |
| la Pobla de Vallbona | 27 | $2,163 | $193.69 | 49% |
| Riba-roja de Túria | 21 | $2,132 | $221.03 | 41% |