Llíber Airbnb Market Analysis 2025: Short Term Rental Data & Vacation Rental Statistics in Valencian Community, Spain
Is Airbnb profitable in Llíber in 2025? Explore comprehensive Airbnb analytics for Llíber, Valencian Community, Spain to uncover income potential. This 2025 STR market report for Llíber, based on AirROI data from April 2024 to March 2025, reveals key trends in the niche market of 25 active listings.
Whether you're considering an Airbnb investment in Llíber, optimizing your existing vacation rental, or exploring rental arbitrage opportunities, understanding the Llíber Airbnb data is crucial. Understanding the local regulations is key to maximizing your short term rental income potential. Let's dive into the specifics.
Key Llíber Airbnb Performance Metrics Overview
Monthly Airbnb Revenue Variations & Income Potential in Llíber (2025)
Understanding the monthly revenue variations for Airbnb listings in Llíber is key to maximizing your short term rental income potential. Seasonality significantly impacts earnings. Our analysis, based on data from the past 12 months, shows that the peak revenue month for STRs in Llíber is typically August, while March often presents the lowest earnings, highlighting opportunities for strategic pricing adjustments during shoulder and low seasons. Explore the typical Airbnb income in Llíber across different performance tiers:
- Best-in-class properties (Top 10%) achieve $3,124+ monthly, often utilizing dynamic pricing and superior guest experiences.
- Strong performing properties (Top 25%) earn $2,034 or more, indicating effective management and desirable locations/amenities.
- Typical properties (Median) generate around $1,382 per month, representing the average market performance.
- Entry-level properties (Bottom 25%) see earnings around $844, often with potential for optimization.
Average Monthly Airbnb Earnings Trend in Llíber
Llíber Airbnb Occupancy Rate Trends (2025)
Maximize your bookings by understanding the Llíber STR occupancy trends. Seasonal demand shifts significantly influence how often properties are booked. Typically, Augustsees the highest demand (peak season occupancy), while March experiences the lowest (low season). Effective strategies, like adjusting minimum stays or offering promotions, can boost occupancy during slower periods. Here's how different property tiers perform in Llíber:
- Best-in-class properties (Top 10%) achieve 79%+ occupancy, indicating high desirability and potentially optimized availability.
- Strong performing properties (Top 25%) maintain 62% or higher occupancy, suggesting good market fit and guest satisfaction.
- Typical properties (Median) have an occupancy rate around 44%.
- Entry-level properties (Bottom 25%) average 22% occupancy, potentially facing higher vacancy.
Average Monthly Occupancy Rate Trend in Llíber
Average Daily Rate (ADR) Airbnb Trends in Llíber (2025)
Effective short term rental pricing strategy in Llíber involves understanding monthly ADR fluctuations. The Average Daily Rate (ADR) for Airbnb in Llíber typically peaks in August and dips lowest during December. Leveraging Airbnb dynamic pricing tools or strategies based on this seasonality can significantly boost revenue. Here's a look at the typical nightly rates achieved:
- Best-in-class properties (Top 10%) command rates of $284+ per night, often due to premium features or locations.
- Strong performing properties (Top 25%) achieve nightly rates of $147 or more.
- Typical properties (Median) charge around $109 per night.
- Entry-level properties (Bottom 25%) earn around $78 per night.
Average Daily Rate (ADR) Trend by Month in Llíber
Get Live Llíber Market Intelligence 👇

Explore Real-time Analytics
Airbnb Seasonality Analysis & Trends in Llíber (2025)
Peak Season (August, July, September)
- Revenue averages $2,413 per month
- Occupancy rates average 64.0%
- Daily rates average $168
Shoulder Season
- Revenue averages $1,526 per month
- Occupancy maintains around 41.5%
- Daily rates hold near $149
Low Season (February, March, November)
- Revenue drops to average $868 per month
- Occupancy decreases to average 28.9%
- Daily rates adjust to average $129
Seasonality Insights for Llíber
- The Airbnb seasonality in Llíber shows highly seasonal trends requiring careful strategy. While the sections above show seasonal averages, it's also insightful to look at the extremes:
- During the high season, the absolute peak month showcases Llíber's highest earning potential, with monthly revenues capable of climbing to $2,975, occupancy reaching a high of 74.2%, and ADRs peaking at $172.
- Conversely, the slowest single month of the year, typically falling within the low season, marks the market's lowest point. In this month, revenue might dip to $698, occupancy could drop to 25.4%, and ADRs may adjust down to $126.
- Understanding both the seasonal averages and these monthly peaks and troughs in revenue, occupancy, and ADR is crucial for maximizing your Airbnb profit potential in Llíber.
Seasonal Strategies for Maximizing Profit
- Peak Season: Maximize revenue through premium pricing and potentially longer minimum stays. Ensure high availability.
- Low Season: Offer competitive pricing, special promotions (e.g., extended stay discounts), and flexible cancellation policies. Target off-season travelers like remote workers or budget-conscious guests.
- Shoulder Seasons: Implement dynamic pricing that balances peak and low rates. Target weekend travelers or specific events. Offer slightly more flexible terms than peak season.
- Regularly analyze your own performance against these Llíber seasonality benchmarks and adjust your pricing and availability strategy accordingly.
Best Areas for Airbnb Investment in Llíber (2025)
Exploring the top neighborhoods for short-term rentals in Llíber? This section highlights key areas, outlining why they are attractive for hosts and guests, along with notable local attractions. Consider these locations based on your target guest profile and investment strategy.
| Neighborhood / Area | Why Host Here? (Target Guests & Appeal) | Key Attractions & Landmarks |
|---|---|---|
| Llíber Town Center | Historic town center with traditional architecture and local charm, perfect for visitors who want to experience authentic Spanish culture. | Church of Llíber, Local markets, Quaint cafes, Artisan shops |
| Jalon Valley | Famous for its stunning scenery and wine production, this area attracts visitors for hiking, cycling, and wine tasting, making it a lucrative spot for Airbnb hosts. | Jalon Valley vineyards, Hiking trails, Local bodegas, Natural parks |
| Pedreguer | Nearby town with vibrant local markets and proximity to Spanish coast beaches, appealing to tourists looking for a more local stay. | Pedreguer market, Monte Solana, Diverse restaurants, Village festivals |
| Denia | A short drive away, Denia is known for its beaches, castles and water sports, attracting a large number of tourists during the summer season. | Denia Castle, Las Marinas Beach, Denia Marina, Water sports |
| Moraira | Charming coastal town known for its stunning beaches and Mediterranean lifestyle, perfect for beach lovers and luxury seekers. | Moraira Beach, El Portet Beach, Local seafood restaurants, Torre de Moraira |
| Benissa | Historical town with beautiful coastal views and hiking routes. It attracts both culture enthusiasts and nature lovers. | Benissa coast, Hiking trails, Local fiestas, Art galleries |
| Calpe | Popular beach destination with iconic rock formations and a vibrant promenade, ideal for tourists looking for beach and nightlife. | Ifach Rock, Calpe Beach, Promenade, Various restaurants and bars |
| Altea | Artistic town known for its scenic old town with cobbled streets and art galleries, attracting visitors seeking cultural experiences. | Old Town (Casco Antiguo), Church of Nuestra Señora del Consuelo, Art galleries, Beachfront promenade |
Understanding Airbnb License Requirements & STR Laws in Llíber (2025)
With 20% of listings showing registration in 2025, understanding potential Airbnb license requirements is crucial in Llíber. Always verify the latest short term rental regulations and Airbnb license requirements directly with local government authorities for Llíber to ensure full compliance before hosting.
(Source: AirROI data, 2025, based on 20% licensed listings)
Top Performing Airbnb Properties in Llíber (2025)
Benchmark your potential! Explore examples of top-performing Airbnb properties in Llíberbased on Trailing Twelve Month (TTM) revenue. Analyze their characteristics, revenue, occupancy rate, and ADR to understand what drives success in this market.
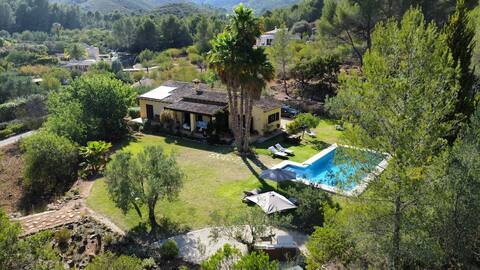
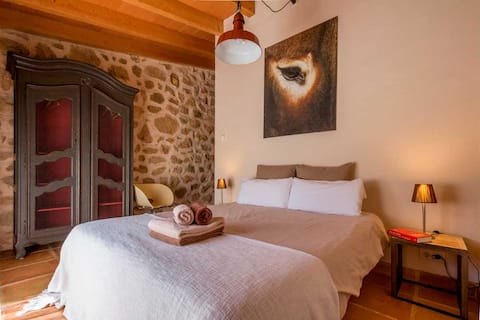
Romantic Finca with pool
Entire Place • 3 bedrooms
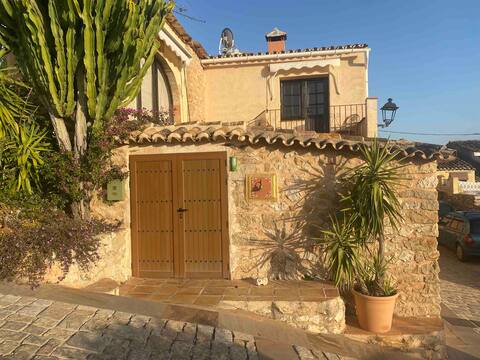
Village cottage in Lliber in Jalon Valley.
Entire Place • 2 bedrooms

Ca la Vall | Your Mediterranean stay
Entire Place • 2 bedrooms
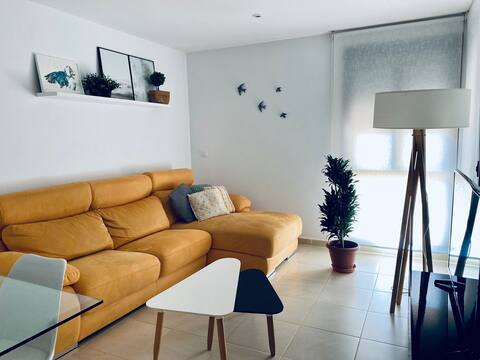
Apartamento Pàmpol
Entire Place • 2 bedrooms
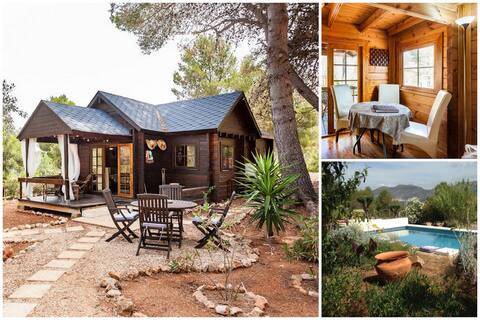
Cabana - sfeervol chalet (rust ruimte zee (30 min)
Entire Place • 1 bedroom
Agriturismo and Casa Rural Refugio Marnes room 2
Private Room • 1 bedroom
Note: Performance varies based on location, size, amenities, seasonality, and management quality. Data reflects the past 12 months.
Top Performing Airbnb Hosts in Llíber (2025)
Learn from the best! This table showcases top-performing Airbnb hosts in Llíber based on the number of properties managed and estimated total revenue over the past year. Analyze their scale and performance metrics.
| Host Name | Properties | Grossing Revenue | Stay Reviews | Avg Rating |
|---|---|---|---|---|
| Julia | 1 | $44,320 | 75 | 4.95/5.0 |
| Bram | 3 | $32,176 | 64 | 4.95/5.0 |
| Host #347120084 | 3 | $30,742 | 22 | 3.21/5.0 |
| Raf Y San | 1 | $27,605 | 12 | 5.00/5.0 |
| Marco & Isabelle | 1 | $26,651 | 19 | 4.95/5.0 |
| Laia | 1 | $24,962 | 26 | 4.96/5.0 |
| Host #3102249 | 2 | $22,238 | 7 | 2.50/5.0 |
| Conny | 2 | $21,527 | 69 | 4.93/5.0 |
| Host #16231867 | 1 | $20,898 | 16 | 5.00/5.0 |
| Fiona | 1 | $17,946 | 68 | 4.68/5.0 |
Analyzing the strategies of top hosts, such as their property selection, pricing, and guest communication, can offer valuable lessons for optimizing your own Airbnb operations in Llíber.
Dive Deeper: Advanced Llíber STR Market Data (2025)
Ready to unlock more insights? AirROI provides access to advanced metrics and comprehensive Airbnb data for Llíber. Explore detailed analytics beyond this report to refine your investment strategy, optimize pricing, and maximize your vacation rental profits.
Explore Advanced MetricsLlíber Short-Term Rental Market Composition (2025): Property & Room Types
Room Type Distribution
Property Type Distribution
Market Composition Insights for Llíber
- The Llíber Airbnb market composition is heavily skewed towards Entire Home/Apt listings, which make up 72% of the 25 active rentals. This indicates strong guest preference for privacy and space.
- Looking at the property type distribution in Llíber, House properties are the most common (40%), reflecting the local real estate landscape.
- Houses represent a significant 40% portion, catering likely to families or larger groups.
- The presence of 32% Hotel/Boutique listings indicates integration with traditional hospitality.
- Smaller segments like outdoor/unique (combined 4.0%) offer potential for unique stay experiences.
Llíber Airbnb Room Capacity Analysis (2025): Bedroom Distribution
Distribution of Listings by Number of Bedrooms
Room Capacity Insights for Llíber
- The dominant room capacity in Llíber is 2 bedrooms listings, making up 52% of the market. This suggests a strong demand for properties suitable for couples or solo travelers.
- Together, 2 bedrooms and 1 bedroom properties represent 76.0% of the active Airbnb listings in Llíber, indicating a high concentration in these sizes.
Llíber Vacation Rental Guest Capacity Trends (2025)
Distribution of Listings by Guest Capacity
Guest Capacity Insights for Llíber
- The most common guest capacity trend in Llíber vacation rentals is listings accommodating 4 guests (36%). This suggests the primary traveler segment is likely small families or groups.
- Properties designed for 4 guests and 2 guests dominate the Llíber STR market, accounting for 60.0% of listings.
- 24.0% of properties accommodate 6+ guests, serving the market segment for larger families or group travel in Llíber.
- On average, properties in Llíber are equipped to host 3.7 guests.
Llíber Airbnb Booking Patterns (2025): Available vs. Booked Days
Available Days Distribution
Booked Days Distribution
Booking Pattern Insights for Llíber
- The most common availability pattern in Llíber falls within the 181-270 days range, representing 40% of listings. This suggests many properties have significant open periods on their calendars.
- Approximately 72.0% of listings show high availability (181+ days open annually), indicating potential for increased bookings or specific owner usage patterns.
- For booked days, the 91-180 days range is most frequent in Llíber (44%), reflecting common guest stay durations or potential owner blocking patterns.
- A notable 28.0% of properties secure long booking periods (181+ days booked per year), highlighting successful long-term rental strategies or significant owner usage.
Llíber Airbnb Minimum Stay Requirements Analysis
Distribution of Listings by Minimum Night Requirement
1 Night
2 listings
9.1% of total
2 Nights
3 listings
13.6% of total
3 Nights
3 listings
13.6% of total
4-6 Nights
7 listings
31.8% of total
7-29 Nights
3 listings
13.6% of total
30+ Nights
4 listings
18.2% of total
Key Insights
- The most prevalent minimum stay requirement in Llíber is 4-6 Nights, adopted by 31.8% of listings. This highlights the market's preference for longer commitments.
- A significant segment (18.2%) caters to monthly stays (30+ nights) in Llíber, pointing to opportunities in the extended-stay market.
Recommendations
- Align with the market by considering a 4-6 Nights minimum stay, as 31.8% of Llíber hosts use this setting.
- If feasible, allowing 1-night stays, especially midweek or during low season, could capture last-minute bookings, as only 9.1% currently do.
- Explore offering discounts for stays of 30+ nights to attract the 18.2% of the market seeking extended stays.
- Adjust minimum nights based on seasonality – potentially shorter during low season and longer during peak demand periods in Llíber.
Llíber Airbnb Cancellation Policy Trends Analysis (2025)
Flexible
5 listings
25% of total
Moderate
2 listings
10% of total
Firm
7 listings
35% of total
Strict
6 listings
30% of total
Cancellation Policy Insights for Llíber
- The prevailing Airbnb cancellation policy trend in Llíber is Firm, used by 35% of listings.
- A majority (65.0%) of hosts in Llíber utilize Firm or Strict policies, indicating a market where hosts prioritize booking security.
Recommendations for Hosts
- Consider adopting a Firm policy to align with the 35% market standard in Llíber.
- Regularly review your cancellation policy against competitors and market demand shifts in Llíber.
Llíber STR Booking Lead Time Analysis (2025)
Average Booking Lead Time by Month
Booking Lead Time Insights for Llíber
- The overall average booking lead time for vacation rentals in Llíber is 81 days.
- Guests book furthest in advance for stays during April (average 110 days), likely coinciding with peak travel demand or local events.
- The shortest booking windows occur for stays in January (average 62 days), indicating more last-minute travel plans during this time.
- Seasonally, Spring (102 days avg.) sees the longest lead times, while Winter (75 days avg.) has the shortest, reflecting typical travel planning cycles.
Recommendations for Hosts
- Use the overall average lead time (81 days) as a baseline for your pricing and availability strategy in Llíber.
- For April stays, consider implementing length-of-stay discounts or slightly higher rates for bookings made less than 110 days out to capitalize on advance planning.
- Target marketing efforts for the Spring season well in advance (at least 102 days) to capture early planners.
- Monitor your own booking lead times against these Llíber averages to identify opportunities for dynamic pricing adjustments.
Popular & Essential Airbnb Amenities in Llíber (2025)
Amenity Prevalence
Amenity Insights for Llíber
- Essential amenities in Llíber that guests expect include: Essentials, Heating, Washer, Hot water, Kitchen, Wifi. Lacking these (any) could significantly impact bookings.
- Popular amenities like Air conditioning, Pool, Hangers are common but not universal. Offering these can provide a competitive edge.
- A pool is a highly desired but not standard amenity, making it a key feature for attracting guests seeking leisure in Llíber.
Recommendations for Hosts
- Ensure your listing includes all essential amenities for Llíber: Essentials, Heating, Washer, Hot water, Kitchen, Wifi.
- Prioritize adding missing essentials: Kitchen, Wifi.
- Consider adding popular differentiators like Air conditioning or Pool to increase appeal.
- Highlight unique or less common amenities you offer (e.g., hot tub, dedicated workspace, EV charger) in your listing description and photos.
- Regularly check competitor amenities in Llíber to stay competitive.
Llíber Airbnb Guest Demographics & Profile Analysis (2025)
Guest Profile Summary for Llíber
- The typical guest profile for Airbnb in Llíber consists of predominantly international visitors (75%), with top international origins including United Kingdom, typically belonging to the Post-2000s (Gen Z/Alpha) group (50%), primarily speaking English or Spanish.
- Domestic travelers account for 24.7% of guests.
- Key international markets include Spain (24.7%) and United Kingdom (21.2%).
- Top languages spoken are English (36.7%) followed by Spanish (17.4%).
- A significant demographic segment is the Post-2000s (Gen Z/Alpha) group, representing 50% of guests.
Recommendations for Hosts
- Focus marketing internationally, particularly towards travelers from United Kingdom.
- Tailor amenities and listing descriptions to appeal to the dominant Post-2000s (Gen Z/Alpha) demographic (e.g., highlight fast WiFi, smart home features, local guides).
- Highlight unique local experiences or amenities relevant to the primary guest profile.
- Consider seasonal promotions aligned with peak travel times for key origin markets.
Nearby Short-Term Rental Market Comparison
How does the Llíber Airbnb market stack up against its neighbors? Compare key performance metrics like average monthly revenue, ADR, and occupancy rates in surrounding areas to understand the broader regional STR landscape.
| Market | Active Properties | Monthly Revenue | Daily Rate | Avg. Occupancy |
|---|---|---|---|---|
| sa Carroca | 98 | $10,551 | $862.81 | 52% |
| Can Germà | 25 | $9,819 | $927.22 | 47% |
| Can Tomàs | 26 | $9,321 | $878.17 | 47% |
| Es Cubells | 31 | $8,883 | $1002.54 | 54% |
| Sant Rafel de sa Creu | 46 | $7,518 | $730.00 | 45% |
| Vista Mar | 64 | $7,047 | $750.94 | 46% |
| Vista Alegre | 18 | $6,413 | $1214.28 | 42% |
| Sant Josep de sa Talaia | 256 | $6,308 | $699.24 | 48% |
| Cala Carbó | 18 | $6,303 | $901.65 | 37% |
| Sant Jordi de ses Salines | 74 | $5,337 | $527.40 | 49% |