Enguera Airbnb Market Analysis 2025: Short Term Rental Data & Vacation Rental Statistics in Valencian Community, Spain
Is Airbnb profitable in Enguera in 2025? Explore comprehensive Airbnb analytics for Enguera, Valencian Community, Spain to uncover income potential. This 2025 STR market report for Enguera, based on AirROI data from April 2024 to March 2025, reveals key trends in the niche market of 17 active listings.
Whether you're considering an Airbnb investment in Enguera, optimizing your existing vacation rental, or exploring rental arbitrage opportunities, understanding the Enguera Airbnb data is crucial. Understanding the local regulations is key to maximizing your short term rental income potential. Let's dive into the specifics.
Key Enguera Airbnb Performance Metrics Overview
Monthly Airbnb Revenue Variations & Income Potential in Enguera (2025)
Understanding the monthly revenue variations for Airbnb listings in Enguera is key to maximizing your short term rental income potential. Seasonality significantly impacts earnings. Our analysis, based on data from the past 12 months, shows that the peak revenue month for STRs in Enguera is typically August, while January often presents the lowest earnings, highlighting opportunities for strategic pricing adjustments during shoulder and low seasons. Explore the typical Airbnb income in Enguera across different performance tiers:
- Best-in-class properties (Top 10%) achieve $2,680+ monthly, often utilizing dynamic pricing and superior guest experiences.
- Strong performing properties (Top 25%) earn $1,440 or more, indicating effective management and desirable locations/amenities.
- Typical properties (Median) generate around $822 per month, representing the average market performance.
- Entry-level properties (Bottom 25%) see earnings around $372, often with potential for optimization.
Average Monthly Airbnb Earnings Trend in Enguera
Enguera Airbnb Occupancy Rate Trends (2025)
Maximize your bookings by understanding the Enguera STR occupancy trends. Seasonal demand shifts significantly influence how often properties are booked. Typically, Augustsees the highest demand (peak season occupancy), while January experiences the lowest (low season). Effective strategies, like adjusting minimum stays or offering promotions, can boost occupancy during slower periods. Here's how different property tiers perform in Enguera:
- Best-in-class properties (Top 10%) achieve 61%+ occupancy, indicating high desirability and potentially optimized availability.
- Strong performing properties (Top 25%) maintain 40% or higher occupancy, suggesting good market fit and guest satisfaction.
- Typical properties (Median) have an occupancy rate around 22%.
- Entry-level properties (Bottom 25%) average 9% occupancy, potentially facing higher vacancy.
Average Monthly Occupancy Rate Trend in Enguera
Average Daily Rate (ADR) Airbnb Trends in Enguera (2025)
Effective short term rental pricing strategy in Enguera involves understanding monthly ADR fluctuations. The Average Daily Rate (ADR) for Airbnb in Enguera typically peaks in June and dips lowest during February. Leveraging Airbnb dynamic pricing tools or strategies based on this seasonality can significantly boost revenue. Here's a look at the typical nightly rates achieved:
- Best-in-class properties (Top 10%) command rates of $259+ per night, often due to premium features or locations.
- Strong performing properties (Top 25%) achieve nightly rates of $136 or more.
- Typical properties (Median) charge around $94 per night.
- Entry-level properties (Bottom 25%) earn around $66 per night.
Average Daily Rate (ADR) Trend by Month in Enguera
Get Live Enguera Market Intelligence 👇

Explore Real-time Analytics
Airbnb Seasonality Analysis & Trends in Enguera (2025)
Peak Season (August, May, June)
- Revenue averages $1,850 per month
- Occupancy rates average 39.3%
- Daily rates average $147
Shoulder Season
- Revenue averages $1,163 per month
- Occupancy maintains around 27.6%
- Daily rates hold near $131
Low Season (January, February, December)
- Revenue drops to average $627 per month
- Occupancy decreases to average 17.8%
- Daily rates adjust to average $100
Seasonality Insights for Enguera
- The Airbnb seasonality in Enguera shows highly seasonal trends requiring careful strategy. While the sections above show seasonal averages, it's also insightful to look at the extremes:
- During the high season, the absolute peak month showcases Enguera's highest earning potential, with monthly revenues capable of climbing to $1,976, occupancy reaching a high of 48.0%, and ADRs peaking at $149.
- Conversely, the slowest single month of the year, typically falling within the low season, marks the market's lowest point. In this month, revenue might dip to $505, occupancy could drop to 13.8%, and ADRs may adjust down to $98.
- Understanding both the seasonal averages and these monthly peaks and troughs in revenue, occupancy, and ADR is crucial for maximizing your Airbnb profit potential in Enguera.
Seasonal Strategies for Maximizing Profit
- Peak Season: Maximize revenue through premium pricing and potentially longer minimum stays. Ensure high availability.
- Low Season: Offer competitive pricing, special promotions (e.g., extended stay discounts), and flexible cancellation policies. Target off-season travelers like remote workers or budget-conscious guests.
- Shoulder Seasons: Implement dynamic pricing that balances peak and low rates. Target weekend travelers or specific events. Offer slightly more flexible terms than peak season.
- Regularly analyze your own performance against these Enguera seasonality benchmarks and adjust your pricing and availability strategy accordingly.
Best Areas for Airbnb Investment in Enguera (2025)
Exploring the top neighborhoods for short-term rentals in Enguera? This section highlights key areas, outlining why they are attractive for hosts and guests, along with notable local attractions. Consider these locations based on your target guest profile and investment strategy.
| Neighborhood / Area | Why Host Here? (Target Guests & Appeal) | Key Attractions & Landmarks |
|---|---|---|
| Enguera Town Center | The heart of Enguera, featuring charming streets and local shops. A great spot for visitors wanting a taste of authentic Spanish life and culture. | Enguera Castle, Plaza de la Villa, Iglesia de San Juan Bautista, Museo de Enguera |
| Sierra de Enguera | A natural park area perfect for nature lovers and outdoor enthusiasts. Ideal for those seeking adventure activities such as hiking and birdwatching. | Natural Park of the Sierra de Enguera, Hiking trails, Scenic viewpoints |
| Cultural Villages | Enguera is surrounded by other small cultural villages that offer a unique glimpse into local traditions and practices. Attracts tourists who enjoy exploring lesser-known locations. | Chulilla, Bocairent, Ayora |
| Historical Sites | Enguera boasts a rich history with various historical ruins and sites, making it attractive for history buffs and educational tours. | Roman ruins, Traditional Spanish architecture |
| Artisan Craft Shops | The area has several artisan craft shops where visitors can purchase handmade goods, highlighting local culture. | Local crafts, Artisan workshops |
| Local Gastronomy | Food enthusiasts can find local gastronomy experiences, including traditional dining and cooking classes that celebrate Spanish cuisine. | Tapas cooking classes, Local gastronomy tours |
| Nearby Natural Attractions | Close to natural attractions such as rivers and hills, suitable for eco-tourism and relaxation. | Río de Enguera, Campsites, Natural swimming areas |
Understanding Airbnb License Requirements & STR Laws in Enguera (2025)
With 18% of listings showing registration in 2025, understanding potential Airbnb license requirements is crucial in Enguera. Always verify the latest short term rental regulations and Airbnb license requirements directly with local government authorities for Enguera to ensure full compliance before hosting.
(Source: AirROI data, 2025, based on 18% licensed listings)
Top Performing Airbnb Properties in Enguera (2025)
Benchmark your potential! Explore examples of top-performing Airbnb properties in Enguerabased on Trailing Twelve Month (TTM) revenue. Analyze their characteristics, revenue, occupancy rate, and ADR to understand what drives success in this market.
Beautiful house surrounded by nature
Entire Place • 3 bedrooms

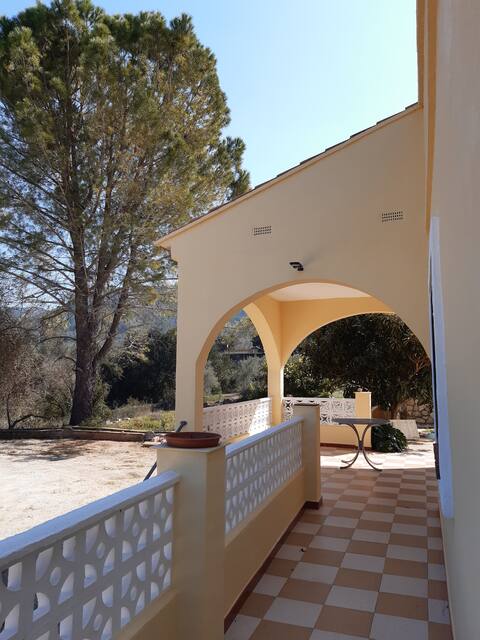
Quiet luxury villa in the heart of nature
Entire Place • 4 bedrooms

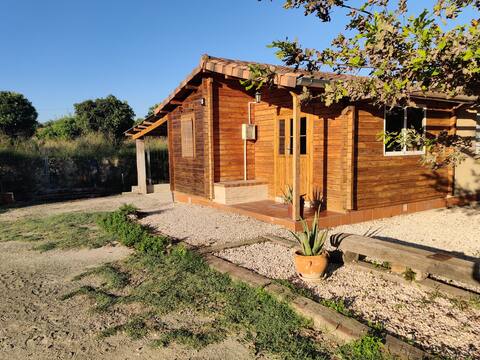
Cabin with pool among olive trees.
Entire Place • 1 bedroom

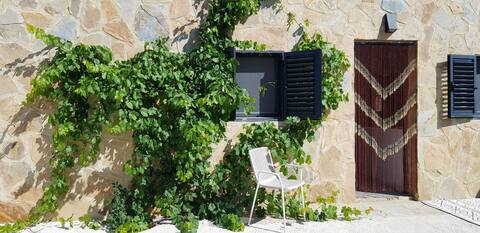
The House of the Chellero
Entire Place • 1 bedroom
Cheerful cottage with pool in summer
Entire Place • 2 bedrooms
Casa rural Yeguada Vistabella.
Entire Place • 1 bedroom
Note: Performance varies based on location, size, amenities, seasonality, and management quality. Data reflects the past 12 months.
Top Performing Airbnb Hosts in Enguera (2025)
Learn from the best! This table showcases top-performing Airbnb hosts in Enguera based on the number of properties managed and estimated total revenue over the past year. Analyze their scale and performance metrics.
| Host Name | Properties | Grossing Revenue | Stay Reviews | Avg Rating |
|---|---|---|---|---|
| Katia | 1 | $48,163 | 28 | 4.79/5.0 |
| Nathalie | 1 | $21,513 | 36 | 4.94/5.0 |
| BenAmil | 1 | $20,038 | 41 | 4.71/5.0 |
| Luis | 1 | $17,727 | 17 | 4.94/5.0 |
| Heredad La Boquilla | 3 | $17,490 | 16 | 4.83/5.0 |
| Gloria | 2 | $14,579 | 21 | 4.93/5.0 |
| Host #151559089 | 1 | $8,665 | 1 | 0.00/5.0 |
| Host #160425855 | 1 | $8,092 | 0 | 0.00/5.0 |
| Jeroen | 1 | $7,496 | 91 | 4.93/5.0 |
| Maria Herminia | 1 | $7,457 | 48 | 4.69/5.0 |
Analyzing the strategies of top hosts, such as their property selection, pricing, and guest communication, can offer valuable lessons for optimizing your own Airbnb operations in Enguera.
Dive Deeper: Advanced Enguera STR Market Data (2025)
Ready to unlock more insights? AirROI provides access to advanced metrics and comprehensive Airbnb data for Enguera. Explore detailed analytics beyond this report to refine your investment strategy, optimize pricing, and maximize your vacation rental profits.
Explore Advanced MetricsEnguera Short-Term Rental Market Composition (2025): Property & Room Types
Room Type Distribution
Property Type Distribution
Market Composition Insights for Enguera
- The Enguera Airbnb market composition is heavily skewed towards Entire Home/Apt listings, which make up 94.1% of the 17 active rentals. This indicates strong guest preference for privacy and space.
- Looking at the property type distribution in Enguera, House properties are the most common (76.5%), reflecting the local real estate landscape.
- Houses represent a significant 76.5% portion, catering likely to families or larger groups.
- The presence of 5.9% Hotel/Boutique listings indicates integration with traditional hospitality.
Enguera Airbnb Room Capacity Analysis (2025): Bedroom Distribution
Distribution of Listings by Number of Bedrooms
Room Capacity Insights for Enguera
- The dominant room capacity in Enguera is 1 bedroom listings, making up 41.2% of the market. This suggests a strong demand for properties suitable for couples or solo travelers.
- Together, 1 bedroom and 3 bedrooms properties represent 70.6% of the active Airbnb listings in Enguera, indicating a high concentration in these sizes.
- A significant 41.2% of listings offer 3+ bedrooms, catering to larger groups and families seeking more space in Enguera.
Enguera Vacation Rental Guest Capacity Trends (2025)
Distribution of Listings by Guest Capacity
Guest Capacity Insights for Enguera
- The most common guest capacity trend in Enguera vacation rentals is listings accommodating 2 guests (29.4%). This suggests the primary traveler segment is likely couples or solo travelers.
- Properties designed for 2 guests and 4 guests dominate the Enguera STR market, accounting for 47.0% of listings.
- 35.3% of properties accommodate 6+ guests, serving the market segment for larger families or group travel in Enguera.
- On average, properties in Enguera are equipped to host 4.2 guests.
Enguera Airbnb Booking Patterns (2025): Available vs. Booked Days
Available Days Distribution
Booked Days Distribution
Booking Pattern Insights for Enguera
- The most common availability pattern in Enguera falls within the 271-366 days range, representing 64.7% of listings. This suggests many properties have significant open periods on their calendars.
- Approximately 88.2% of listings show high availability (181+ days open annually), indicating potential for increased bookings or specific owner usage patterns.
- For booked days, the 31-90 days range is most frequent in Enguera (41.2%), reflecting common guest stay durations or potential owner blocking patterns.
- A notable 11.8% of properties secure long booking periods (181+ days booked per year), highlighting successful long-term rental strategies or significant owner usage.
Enguera Airbnb Minimum Stay Requirements Analysis
Distribution of Listings by Minimum Night Requirement
1 Night
1 listings
5.9% of total
2 Nights
11 listings
64.7% of total
3 Nights
2 listings
11.8% of total
30+ Nights
3 listings
17.6% of total
Key Insights
- The most prevalent minimum stay requirement in Enguera is 2 Nights, adopted by 64.7% of listings. This highlights the market's preference for shorter, flexible bookings.
- A strong majority (70.6%) of the Enguera Airbnb data shows acceptance of very short stays (1-2 nights), indicating a dynamic, high-turnover market.
- A significant segment (17.6%) caters to monthly stays (30+ nights) in Enguera, pointing to opportunities in the extended-stay market.
Recommendations
- Align with the market by considering a 2 Nights minimum stay, as 64.7% of Enguera hosts use this setting.
- If feasible, allowing 1-night stays, especially midweek or during low season, could capture last-minute bookings, as only 5.9% currently do.
- A 2-night minimum appears standard (64.7%). Consider this for weekends or peak periods.
- Explore offering discounts for stays of 30+ nights to attract the 17.6% of the market seeking extended stays.
- Adjust minimum nights based on seasonality – potentially shorter during low season and longer during peak demand periods in Enguera.
Enguera Airbnb Cancellation Policy Trends Analysis (2025)
Flexible
2 listings
14.3% of total
Moderate
4 listings
28.6% of total
Firm
5 listings
35.7% of total
Strict
3 listings
21.4% of total
Cancellation Policy Insights for Enguera
- The prevailing Airbnb cancellation policy trend in Enguera is Firm, used by 35.7% of listings.
- A majority (57.1%) of hosts in Enguera utilize Firm or Strict policies, indicating a market where hosts prioritize booking security.
Recommendations for Hosts
- Consider adopting a Firm policy to align with the 35.7% market standard in Enguera.
- Regularly review your cancellation policy against competitors and market demand shifts in Enguera.
Enguera STR Booking Lead Time Analysis (2025)
Average Booking Lead Time by Month
Booking Lead Time Insights for Enguera
- The overall average booking lead time for vacation rentals in Enguera is 34 days.
- Guests book furthest in advance for stays during August (average 69 days), likely coinciding with peak travel demand or local events.
- The shortest booking windows occur for stays in March (average 16 days), indicating more last-minute travel plans during this time.
- Seasonally, Summer (53 days avg.) sees the longest lead times, while Spring (32 days avg.) has the shortest, reflecting typical travel planning cycles.
Recommendations for Hosts
- Use the overall average lead time (34 days) as a baseline for your pricing and availability strategy in Enguera.
- For August stays, consider implementing length-of-stay discounts or slightly higher rates for bookings made less than 69 days out to capitalize on advance planning.
- Target marketing efforts for the Summer season well in advance (at least 53 days) to capture early planners.
- Monitor your own booking lead times against these Enguera averages to identify opportunities for dynamic pricing adjustments.
Popular & Essential Airbnb Amenities in Enguera (2025)
Amenity Prevalence
Amenity Insights for Enguera
- Essential amenities in Enguera that guests expect include: Essentials, Hot water, Kitchen. Lacking these (any) could significantly impact bookings.
- Popular amenities like Dishes and silverware, Refrigerator, Heating are common but not universal. Offering these can provide a competitive edge.
- Warning: Wifi is not universally provided but is considered essential globally. Ensure reliable Wifi is offered.
Recommendations for Hosts
- Ensure your listing includes all essential amenities for Enguera: Essentials, Hot water, Kitchen.
- Consider adding popular differentiators like Dishes and silverware or Refrigerator to increase appeal.
- Highlight unique or less common amenities you offer (e.g., hot tub, dedicated workspace, EV charger) in your listing description and photos.
- Regularly check competitor amenities in Enguera to stay competitive.
Enguera Airbnb Guest Demographics & Profile Analysis (2025)
Guest Profile Summary for Enguera
- The typical guest profile for Airbnb in Enguera consists of primarily domestic travelers (65%), often arriving from nearby Valencia, typically belonging to the Post-2000s (Gen Z/Alpha) group (50%), primarily speaking English or Spanish.
- Domestic travelers account for 65.3% of guests.
- Key international markets include Spain (65.3%) and Netherlands (9.7%).
- Top languages spoken are English (34%) followed by Spanish (29.8%).
- A significant demographic segment is the Post-2000s (Gen Z/Alpha) group, representing 50% of guests.
Recommendations for Hosts
- Target domestic marketing efforts towards travelers from Valencia and Alicante.
- Tailor amenities and listing descriptions to appeal to the dominant Post-2000s (Gen Z/Alpha) demographic (e.g., highlight fast WiFi, smart home features, local guides).
- Highlight unique local experiences or amenities relevant to the primary guest profile.
- Consider seasonal promotions aligned with peak travel times for key origin markets.
Nearby Short-Term Rental Market Comparison
How does the Enguera Airbnb market stack up against its neighbors? Compare key performance metrics like average monthly revenue, ADR, and occupancy rates in surrounding areas to understand the broader regional STR landscape.
| Market | Active Properties | Monthly Revenue | Daily Rate | Avg. Occupancy |
|---|---|---|---|---|
| Macastre | 13 | $2,924 | $296.93 | 42% |
| Corbera | 13 | $2,721 | $206.87 | 41% |
| Bétera | 31 | $2,711 | $222.77 | 46% |
| l'Eliana | 33 | $2,510 | $298.45 | 43% |
| San Antonio de Benagéber | 11 | $2,374 | $335.55 | 40% |
| Manises | 25 | $2,352 | $175.71 | 38% |
| Olocau | 11 | $2,245 | $308.22 | 36% |
| Alboraia / Alboraya | 272 | $2,220 | $186.05 | 49% |
| la Pobla de Vallbona | 27 | $2,163 | $193.69 | 49% |
| Riba-roja de Túria | 21 | $2,132 | $221.03 | 41% |