els Poblets Airbnb Market Analysis 2025: Short Term Rental Data & Vacation Rental Statistics in Valencian Community, Spain
Is Airbnb profitable in els Poblets in 2025? Explore comprehensive Airbnb analytics for els Poblets, Valencian Community, Spain to uncover income potential. This 2025 STR market report for els Poblets, based on AirROI data from April 2024 to March 2025, reveals key trends in the niche market of 102 active listings.
Whether you're considering an Airbnb investment in els Poblets, optimizing your existing vacation rental, or exploring rental arbitrage opportunities, understanding the els Poblets Airbnb data is crucial. Navigating the high regulation landscape is key to maximizing your short term rental income potential. Let's dive into the specifics.
Key els Poblets Airbnb Performance Metrics Overview
Monthly Airbnb Revenue Variations & Income Potential in els Poblets (2025)
Understanding the monthly revenue variations for Airbnb listings in els Poblets is key to maximizing your short term rental income potential. Seasonality significantly impacts earnings. Our analysis, based on data from the past 12 months, shows that the peak revenue month for STRs in els Poblets is typically August, while December often presents the lowest earnings, highlighting opportunities for strategic pricing adjustments during shoulder and low seasons. Explore the typical Airbnb income in els Poblets across different performance tiers:
- Best-in-class properties (Top 10%) achieve $3,962+ monthly, often utilizing dynamic pricing and superior guest experiences.
- Strong performing properties (Top 25%) earn $2,206 or more, indicating effective management and desirable locations/amenities.
- Typical properties (Median) generate around $1,129 per month, representing the average market performance.
- Entry-level properties (Bottom 25%) see earnings around $499, often with potential for optimization.
Average Monthly Airbnb Earnings Trend in els Poblets
els Poblets Airbnb Occupancy Rate Trends (2025)
Maximize your bookings by understanding the els Poblets STR occupancy trends. Seasonal demand shifts significantly influence how often properties are booked. Typically, Augustsees the highest demand (peak season occupancy), while December experiences the lowest (low season). Effective strategies, like adjusting minimum stays or offering promotions, can boost occupancy during slower periods. Here's how different property tiers perform in els Poblets:
- Best-in-class properties (Top 10%) achieve 73%+ occupancy, indicating high desirability and potentially optimized availability.
- Strong performing properties (Top 25%) maintain 47% or higher occupancy, suggesting good market fit and guest satisfaction.
- Typical properties (Median) have an occupancy rate around 24%.
- Entry-level properties (Bottom 25%) average 11% occupancy, potentially facing higher vacancy.
Average Monthly Occupancy Rate Trend in els Poblets
Average Daily Rate (ADR) Airbnb Trends in els Poblets (2025)
Effective short term rental pricing strategy in els Poblets involves understanding monthly ADR fluctuations. The Average Daily Rate (ADR) for Airbnb in els Poblets typically peaks in August and dips lowest during December. Leveraging Airbnb dynamic pricing tools or strategies based on this seasonality can significantly boost revenue. Here's a look at the typical nightly rates achieved:
- Best-in-class properties (Top 10%) command rates of $262+ per night, often due to premium features or locations.
- Strong performing properties (Top 25%) achieve nightly rates of $197 or more.
- Typical properties (Median) charge around $144 per night.
- Entry-level properties (Bottom 25%) earn around $103 per night.
Average Daily Rate (ADR) Trend by Month in els Poblets
Get Live els Poblets Market Intelligence 👇

Explore Real-time Analytics
Airbnb Seasonality Analysis & Trends in els Poblets (2025)
Peak Season (August, July, May)
- Revenue averages $2,886 per month
- Occupancy rates average 45.9%
- Daily rates average $174
Shoulder Season
- Revenue averages $1,506 per month
- Occupancy maintains around 30.5%
- Daily rates hold near $160
Low Season (January, February, December)
- Revenue drops to average $768 per month
- Occupancy decreases to average 21.8%
- Daily rates adjust to average $149
Seasonality Insights for els Poblets
- The Airbnb seasonality in els Poblets shows highly seasonal trends requiring careful strategy. While the sections above show seasonal averages, it's also insightful to look at the extremes:
- During the high season, the absolute peak month showcases els Poblets's highest earning potential, with monthly revenues capable of climbing to $3,795, occupancy reaching a high of 60.5%, and ADRs peaking at $181.
- Conversely, the slowest single month of the year, typically falling within the low season, marks the market's lowest point. In this month, revenue might dip to $760, occupancy could drop to 19.9%, and ADRs may adjust down to $148.
- Understanding both the seasonal averages and these monthly peaks and troughs in revenue, occupancy, and ADR is crucial for maximizing your Airbnb profit potential in els Poblets.
Seasonal Strategies for Maximizing Profit
- Peak Season: Maximize revenue through premium pricing and potentially longer minimum stays. Ensure high availability.
- Low Season: Offer competitive pricing, special promotions (e.g., extended stay discounts), and flexible cancellation policies. Target off-season travelers like remote workers or budget-conscious guests.
- Shoulder Seasons: Implement dynamic pricing that balances peak and low rates. Target weekend travelers or specific events. Offer slightly more flexible terms than peak season.
- Regularly analyze your own performance against these els Poblets seasonality benchmarks and adjust your pricing and availability strategy accordingly.
Best Areas for Airbnb Investment in els Poblets (2025)
Exploring the top neighborhoods for short-term rentals in els Poblets? This section highlights key areas, outlining why they are attractive for hosts and guests, along with notable local attractions. Consider these locations based on your target guest profile and investment strategy.
| Neighborhood / Area | Why Host Here? (Target Guests & Appeal) | Key Attractions & Landmarks |
|---|---|---|
| Playa de les Deveses | A popular beach with fine sand and clear waters, ideal for families and sunbathers. Great for hosting guests looking for a relaxing vacation by the sea. | Les Deveses Beach, Water sports activities, Local beach bars, Natural landscapes, Family-friendly restaurants |
| Els Poblets Town Center | A charming traditional village with local culture and history. Offers a more authentic Spanish experience with local shops and cafes. | Church of the Assumption, Local markets, Pueblo viejo, Village festivals, Nearby hiking trails |
| Montgó Natural Park | A beautiful natural area with hiking trails and stunning views. Perfect for outdoor enthusiasts and nature lovers. | Hiking trails, Flora and fauna, Stunning views from Montgó peak, Photography spots, Picnic areas |
| Las Marinas | This area combines residential and tourist developments, making it popular for both long-term and vacation rentals, with proximity to the beach. | Long sandy beaches, Restaurants and bars, Water sports, Children's playgrounds, Nearby golf courses |
| Dénia | Just a short drive from Els Poblets, Dénia is a bustling tourist town with a vibrant marina, famous for its seafood and historical castle. | Dénia Castle, Marina and seafood restaurants, Dénia beach, Local festivals, Montgó Natural Park nearby |
| Pedreguer | A nearby town that attracts those looking for a more rural lifestyle while still being close to the coast; offers cultural experiences. | Local vineyards, Historic sites, Traditional Spanish cuisine, Cultural events, Scenic countryside |
| Javea | A well-known coastal town that attracts tourists for its stunning beaches and vibrant nightlife, making it ideal for short-term rentals. | Arenal Beach, Historic old town, Javea Port, Water activities, Cafés and nightlife |
| Els Poblets Marina | With direct access to the sea, the marina is attractive for sailing enthusiasts and guests looking to relax by the waterfront. | Marina facilities, Water sports, Wonderful views, Restaurants with sea views, Promenade walks |
Understanding Airbnb License Requirements & STR Laws in els Poblets (2025)
Yes, els Poblets, Valencian Community, Spain enforces high STR regulations. Obtaining a license and ensuring compliance is almost certainly required according to current 2025 STR laws. Always verify the latest short term rental regulations and Airbnb license requirements directly with local government authorities for els Poblets to ensure full compliance before hosting.
(Source: AirROI data, 2025, based on 32% licensed listings)
Top Performing Airbnb Properties in els Poblets (2025)
Benchmark your potential! Explore examples of top-performing Airbnb properties in els Pobletsbased on Trailing Twelve Month (TTM) revenue. Analyze their characteristics, revenue, occupancy rate, and ADR to understand what drives success in this market.
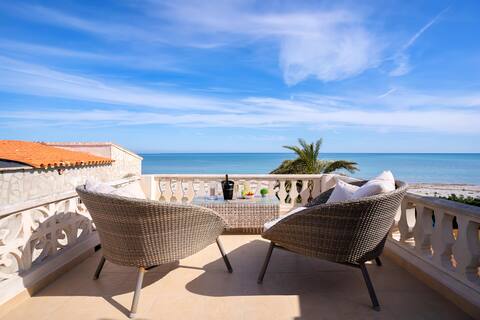
Beach Villa Denia
Entire Place • 4 bedrooms
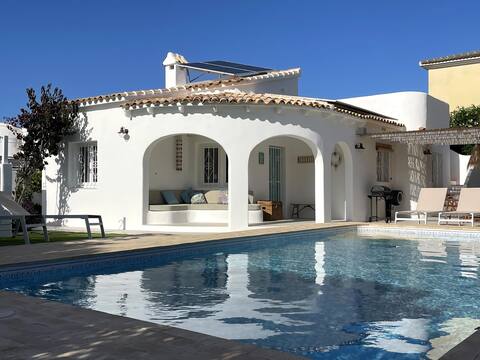
Casita Bombón with a pool and garden on the beach
Entire Place • 2 bedrooms
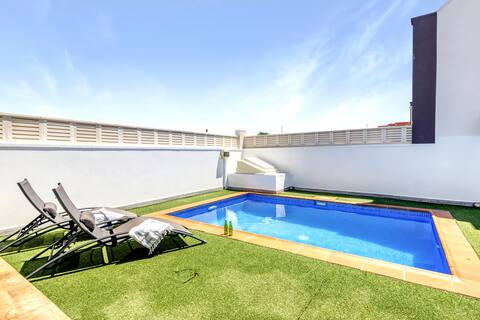
Townhouse|Private Poo|3bathrooms|Free Parking
Entire Place • 3 bedrooms
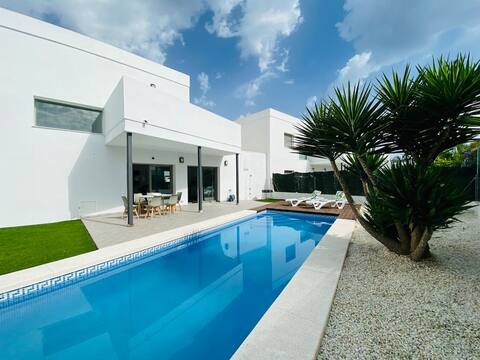
Casa Coco stylish beach house with pool&Sundeck
Entire Place • 3 bedrooms
La Casita de la Sirena a few steps from the sea
Entire Place • 2 bedrooms
ocean front
Entire Place • 3 bedrooms
Note: Performance varies based on location, size, amenities, seasonality, and management quality. Data reflects the past 12 months.
Top Performing Airbnb Hosts in els Poblets (2025)
Learn from the best! This table showcases top-performing Airbnb hosts in els Poblets based on the number of properties managed and estimated total revenue over the past year. Analyze their scale and performance metrics.
| Host Name | Properties | Grossing Revenue | Stay Reviews | Avg Rating |
|---|---|---|---|---|
| Happy In The Sun | 11 | $107,967 | 14 | 0.89/5.0 |
| Lucía | 2 | $82,260 | 62 | 4.97/5.0 |
| Anton | 3 | $76,129 | 101 | 4.69/5.0 |
| Alex - Interhome Group | 4 | $59,176 | 14 | 3.46/5.0 |
| Petr | 1 | $57,628 | 11 | 4.91/5.0 |
| Maria Villalba | 1 | $45,262 | 38 | 4.82/5.0 |
| Till | 1 | $36,413 | 12 | 4.92/5.0 |
| Mili Al Sol Alquileres | 4 | $35,111 | 12 | 3.37/5.0 |
| Jana | 1 | $34,001 | 6 | 5.00/5.0 |
| Sebastian | 4 | $31,071 | 12 | 3.38/5.0 |
Analyzing the strategies of top hosts, such as their property selection, pricing, and guest communication, can offer valuable lessons for optimizing your own Airbnb operations in els Poblets.
Dive Deeper: Advanced els Poblets STR Market Data (2025)
Ready to unlock more insights? AirROI provides access to advanced metrics and comprehensive Airbnb data for els Poblets. Explore detailed analytics beyond this report to refine your investment strategy, optimize pricing, and maximize your vacation rental profits.
Explore Advanced Metricsels Poblets Short-Term Rental Market Composition (2025): Property & Room Types
Room Type Distribution
Property Type Distribution
Market Composition Insights for els Poblets
- The els Poblets Airbnb market composition is heavily skewed towards Entire Home/Apt listings, which make up 97.1% of the 102 active rentals. This indicates strong guest preference for privacy and space.
- Looking at the property type distribution in els Poblets, House properties are the most common (82.4%), reflecting the local real estate landscape.
- Houses represent a significant 82.4% portion, catering likely to families or larger groups.
- Smaller segments like others, hotel/boutique (combined 3.0%) offer potential for unique stay experiences.
els Poblets Airbnb Room Capacity Analysis (2025): Bedroom Distribution
Distribution of Listings by Number of Bedrooms
Room Capacity Insights for els Poblets
- The dominant room capacity in els Poblets is 2 bedrooms listings, making up 45.1% of the market. This suggests a strong demand for properties suitable for couples or solo travelers.
- Together, 2 bedrooms and 3 bedrooms properties represent 79.4% of the active Airbnb listings in els Poblets, indicating a high concentration in these sizes.
- A significant 43.2% of listings offer 3+ bedrooms, catering to larger groups and families seeking more space in els Poblets.
els Poblets Vacation Rental Guest Capacity Trends (2025)
Distribution of Listings by Guest Capacity
Guest Capacity Insights for els Poblets
- The most common guest capacity trend in els Poblets vacation rentals is listings accommodating 4 guests (41.2%). This suggests the primary traveler segment is likely small families or groups.
- Properties designed for 4 guests and 6 guests dominate the els Poblets STR market, accounting for 67.7% of listings.
- 40.2% of properties accommodate 6+ guests, serving the market segment for larger families or group travel in els Poblets.
- On average, properties in els Poblets are equipped to host 4.9 guests.
els Poblets Airbnb Booking Patterns (2025): Available vs. Booked Days
Available Days Distribution
Booked Days Distribution
Booking Pattern Insights for els Poblets
- The most common availability pattern in els Poblets falls within the 271-366 days range, representing 79.4% of listings. This suggests many properties have significant open periods on their calendars.
- Approximately 94.1% of listings show high availability (181+ days open annually), indicating potential for increased bookings or specific owner usage patterns.
- For booked days, the 31-90 days range is most frequent in els Poblets (54.9%), reflecting common guest stay durations or potential owner blocking patterns.
- A notable 5.9% of properties secure long booking periods (181+ days booked per year), highlighting successful long-term rental strategies or significant owner usage.
els Poblets Airbnb Minimum Stay Requirements Analysis
Distribution of Listings by Minimum Night Requirement
1 Night
11 listings
11.7% of total
2 Nights
9 listings
9.6% of total
3 Nights
11 listings
11.7% of total
4-6 Nights
33 listings
35.1% of total
7-29 Nights
17 listings
18.1% of total
30+ Nights
13 listings
13.8% of total
Key Insights
- The most prevalent minimum stay requirement in els Poblets is 4-6 Nights, adopted by 35.1% of listings. This highlights the market's preference for longer commitments.
- A significant segment (13.8%) caters to monthly stays (30+ nights) in els Poblets, pointing to opportunities in the extended-stay market.
Recommendations
- Align with the market by considering a 4-6 Nights minimum stay, as 35.1% of els Poblets hosts use this setting.
- If feasible, allowing 1-night stays, especially midweek or during low season, could capture last-minute bookings, as only 11.7% currently do.
- Explore offering discounts for stays of 30+ nights to attract the 13.8% of the market seeking extended stays.
- Adjust minimum nights based on seasonality – potentially shorter during low season and longer during peak demand periods in els Poblets.
els Poblets Airbnb Cancellation Policy Trends Analysis (2025)
Super Strict 30 Days
5 listings
6.3% of total
Super Strict 60 Days
1 listings
1.3% of total
Flexible
14 listings
17.7% of total
Moderate
12 listings
15.2% of total
Firm
18 listings
22.8% of total
Strict
29 listings
36.7% of total
Cancellation Policy Insights for els Poblets
- The prevailing Airbnb cancellation policy trend in els Poblets is Strict, used by 36.7% of listings.
- A majority (59.5%) of hosts in els Poblets utilize Firm or Strict policies, indicating a market where hosts prioritize booking security.
Recommendations for Hosts
- Consider adopting a Strict policy to align with the 36.7% market standard in els Poblets.
- With 36.7% using Strict terms, this is a viable option in els Poblets, particularly for high-value properties or during peak demand periods.
- Regularly review your cancellation policy against competitors and market demand shifts in els Poblets.
els Poblets STR Booking Lead Time Analysis (2025)
Average Booking Lead Time by Month
Booking Lead Time Insights for els Poblets
- The overall average booking lead time for vacation rentals in els Poblets is 74 days.
- Guests book furthest in advance for stays during February (average 96 days), likely coinciding with peak travel demand or local events.
- The shortest booking windows occur for stays in December (average 40 days), indicating more last-minute travel plans during this time.
- Seasonally, Summer (86 days avg.) sees the longest lead times, while Winter (64 days avg.) has the shortest, reflecting typical travel planning cycles.
Recommendations for Hosts
- Use the overall average lead time (74 days) as a baseline for your pricing and availability strategy in els Poblets.
- For February stays, consider implementing length-of-stay discounts or slightly higher rates for bookings made less than 96 days out to capitalize on advance planning.
- Target marketing efforts for the Summer season well in advance (at least 86 days) to capture early planners.
- Monitor your own booking lead times against these els Poblets averages to identify opportunities for dynamic pricing adjustments.
Popular & Essential Airbnb Amenities in els Poblets (2025)
Amenity Prevalence
Amenity Insights for els Poblets
- Essential amenities in els Poblets that guests expect include: Washer, Kitchen, TV. Lacking these (any) could significantly impact bookings.
- Popular amenities like Air conditioning, Refrigerator, Wifi are common but not universal. Offering these can provide a competitive edge.
- A pool is a highly desired but not standard amenity, making it a key feature for attracting guests seeking leisure in els Poblets.
- Warning: Wifi is not universally provided but is considered essential globally. Ensure reliable Wifi is offered.
Recommendations for Hosts
- Ensure your listing includes all essential amenities for els Poblets: Washer, Kitchen, TV.
- Prioritize adding missing essentials: Kitchen, TV.
- Consider adding popular differentiators like Air conditioning or Refrigerator to increase appeal.
- Highlight unique or less common amenities you offer (e.g., hot tub, dedicated workspace, EV charger) in your listing description and photos.
- Regularly check competitor amenities in els Poblets to stay competitive.
els Poblets Airbnb Guest Demographics & Profile Analysis (2025)
Guest Profile Summary for els Poblets
- The typical guest profile for Airbnb in els Poblets consists of a mix of domestic (43%) and international guests, with top international origins including France, typically belonging to the Post-2000s (Gen Z/Alpha) group (50%), primarily speaking English or Spanish.
- Domestic travelers account for 43.1% of guests.
- Key international markets include Spain (43.1%) and France (13.2%).
- Top languages spoken are English (37.1%) followed by Spanish (21.2%).
- A significant demographic segment is the Post-2000s (Gen Z/Alpha) group, representing 50% of guests.
Recommendations for Hosts
- Balance marketing efforts between domestic and international channels based on the guest mix.
- Tailor amenities and listing descriptions to appeal to the dominant Post-2000s (Gen Z/Alpha) demographic (e.g., highlight fast WiFi, smart home features, local guides).
- Highlight unique local experiences or amenities relevant to the primary guest profile.
- Consider seasonal promotions aligned with peak travel times for key origin markets.
Nearby Short-Term Rental Market Comparison
How does the els Poblets Airbnb market stack up against its neighbors? Compare key performance metrics like average monthly revenue, ADR, and occupancy rates in surrounding areas to understand the broader regional STR landscape.
| Market | Active Properties | Monthly Revenue | Daily Rate | Avg. Occupancy |
|---|---|---|---|---|
| sa Carroca | 98 | $10,551 | $862.81 | 52% |
| Can Germà | 25 | $9,819 | $927.22 | 47% |
| Can Tomàs | 26 | $9,321 | $878.17 | 47% |
| Es Cubells | 31 | $8,883 | $1002.54 | 54% |
| Sant Rafel de sa Creu | 46 | $7,518 | $730.00 | 45% |
| Vista Mar | 64 | $7,047 | $750.94 | 46% |
| Vista Alegre | 18 | $6,413 | $1214.28 | 42% |
| Sant Josep de sa Talaia | 256 | $6,308 | $699.24 | 48% |
| Cala Carbó | 18 | $6,303 | $901.65 | 37% |
| Sant Jordi de ses Salines | 74 | $5,337 | $527.40 | 49% |