el Puig de Santa Maria Airbnb Market Analysis 2025: Short Term Rental Data & Vacation Rental Statistics in Valencian Community, Spain
Is Airbnb profitable in el Puig de Santa Maria in 2025? Explore comprehensive Airbnb analytics for el Puig de Santa Maria, Valencian Community, Spain to uncover income potential. This 2025 STR market report for el Puig de Santa Maria, based on AirROI data from April 2024 to March 2025, reveals key trends in the niche market of 79 active listings.
Whether you're considering an Airbnb investment in el Puig de Santa Maria, optimizing your existing vacation rental, or exploring rental arbitrage opportunities, understanding the el Puig de Santa Maria Airbnb data is crucial. Understanding the local regulations is key to maximizing your short term rental income potential. Let's dive into the specifics.
Key el Puig de Santa Maria Airbnb Performance Metrics Overview
Monthly Airbnb Revenue Variations & Income Potential in el Puig de Santa Maria (2025)
Understanding the monthly revenue variations for Airbnb listings in el Puig de Santa Maria is key to maximizing your short term rental income potential. Seasonality significantly impacts earnings. Our analysis, based on data from the past 12 months, shows that the peak revenue month for STRs in el Puig de Santa Maria is typically August, while February often presents the lowest earnings, highlighting opportunities for strategic pricing adjustments during shoulder and low seasons. Explore the typical Airbnb income in el Puig de Santa Maria across different performance tiers:
- Best-in-class properties (Top 10%) achieve $3,867+ monthly, often utilizing dynamic pricing and superior guest experiences.
- Strong performing properties (Top 25%) earn $2,871 or more, indicating effective management and desirable locations/amenities.
- Typical properties (Median) generate around $1,792 per month, representing the average market performance.
- Entry-level properties (Bottom 25%) see earnings around $762, often with potential for optimization.
Average Monthly Airbnb Earnings Trend in el Puig de Santa Maria
el Puig de Santa Maria Airbnb Occupancy Rate Trends (2025)
Maximize your bookings by understanding the el Puig de Santa Maria STR occupancy trends. Seasonal demand shifts significantly influence how often properties are booked. Typically, Augustsees the highest demand (peak season occupancy), while January experiences the lowest (low season). Effective strategies, like adjusting minimum stays or offering promotions, can boost occupancy during slower periods. Here's how different property tiers perform in el Puig de Santa Maria:
- Best-in-class properties (Top 10%) achieve 80%+ occupancy, indicating high desirability and potentially optimized availability.
- Strong performing properties (Top 25%) maintain 63% or higher occupancy, suggesting good market fit and guest satisfaction.
- Typical properties (Median) have an occupancy rate around 38%.
- Entry-level properties (Bottom 25%) average 17% occupancy, potentially facing higher vacancy.
Average Monthly Occupancy Rate Trend in el Puig de Santa Maria
Average Daily Rate (ADR) Airbnb Trends in el Puig de Santa Maria (2025)
Effective short term rental pricing strategy in el Puig de Santa Maria involves understanding monthly ADR fluctuations. The Average Daily Rate (ADR) for Airbnb in el Puig de Santa Maria typically peaks in August and dips lowest during February. Leveraging Airbnb dynamic pricing tools or strategies based on this seasonality can significantly boost revenue. Here's a look at the typical nightly rates achieved:
- Best-in-class properties (Top 10%) command rates of $213+ per night, often due to premium features or locations.
- Strong performing properties (Top 25%) achieve nightly rates of $159 or more.
- Typical properties (Median) charge around $120 per night.
- Entry-level properties (Bottom 25%) earn around $91 per night.
Average Daily Rate (ADR) Trend by Month in el Puig de Santa Maria
Get Live el Puig de Santa Maria Market Intelligence 👇

Explore Real-time Analytics
Airbnb Seasonality Analysis & Trends in el Puig de Santa Maria (2025)
Peak Season (August, July, May)
- Revenue averages $3,355 per month
- Occupancy rates average 57.9%
- Daily rates average $145
Shoulder Season
- Revenue averages $2,011 per month
- Occupancy maintains around 40.9%
- Daily rates hold near $139
Low Season (January, February, March)
- Revenue drops to average $969 per month
- Occupancy decreases to average 26.3%
- Daily rates adjust to average $137
Seasonality Insights for el Puig de Santa Maria
- The Airbnb seasonality in el Puig de Santa Maria shows highly seasonal trends requiring careful strategy. While the sections above show seasonal averages, it's also insightful to look at the extremes:
- During the high season, the absolute peak month showcases el Puig de Santa Maria's highest earning potential, with monthly revenues capable of climbing to $3,651, occupancy reaching a high of 64.8%, and ADRs peaking at $149.
- Conversely, the slowest single month of the year, typically falling within the low season, marks the market's lowest point. In this month, revenue might dip to $844, occupancy could drop to 24.2%, and ADRs may adjust down to $132.
- Understanding both the seasonal averages and these monthly peaks and troughs in revenue, occupancy, and ADR is crucial for maximizing your Airbnb profit potential in el Puig de Santa Maria.
Seasonal Strategies for Maximizing Profit
- Peak Season: Maximize revenue through premium pricing and potentially longer minimum stays. Ensure high availability.
- Low Season: Offer competitive pricing, special promotions (e.g., extended stay discounts), and flexible cancellation policies. Target off-season travelers like remote workers or budget-conscious guests.
- Shoulder Seasons: Implement dynamic pricing that balances peak and low rates. Target weekend travelers or specific events. Offer slightly more flexible terms than peak season.
- Regularly analyze your own performance against these el Puig de Santa Maria seasonality benchmarks and adjust your pricing and availability strategy accordingly.
Best Areas for Airbnb Investment in el Puig de Santa Maria (2025)
Exploring the top neighborhoods for short-term rentals in el Puig de Santa Maria? This section highlights key areas, outlining why they are attractive for hosts and guests, along with notable local attractions. Consider these locations based on your target guest profile and investment strategy.
| Neighborhood / Area | Why Host Here? (Target Guests & Appeal) | Key Attractions & Landmarks |
|---|---|---|
| Playa de Puig | A beautiful beach area known for its golden sands and inviting waters. Ideal for families and tourists looking to enjoy sun and sea, with various beachfront activities and restaurants nearby. | Puig Beach, Chiringuito Beach Bar, Watersports Rentals, Beach Volleyball Courts, Local Seafood Restaurants |
| Puig Historical Center | Rich in history and culture, this area features beautiful architecture and heritage sites. Attracts tourists interested in Valencian history and traditional experiences. | Monastery of Santa Maria, Puig Castle, Plaza del Ayuntamiento, Church of San Pedro, El Puig Museum |
| El Puig Natural Park | A serene natural park ideal for outdoor enthusiasts and those seeking a quiet retreat. Offers hiking trails, picnic areas, and a chance to enjoy nature away from the city. | Natural Park Trails, Picnic Areas, Bird Watching Spots, Cycling Paths, Community Events |
| Valencia City Center | Just a short drive away, Valencia offers a vibrant city experience with top attractions. Perfect for guests who want access to historical sites, shopping, and nightlife. | City of Arts and Sciences, Valencia Cathedral, Central Market, Turia Gardens, Malvarrosa Beach |
| Malvarrosa Beach | Famous beach with a lively promenade, bustling restaurants, and vibrant nightlife. Perfect for those looking for a lively beach experience. | Malvarrosa Beach Promenade, Beach Bars, Water Sports, Night Clubs, Cultural Festivals |
| Bardaji Park | A local park that serves as a community hub, great for those seeking family-friendly activities, playgrounds, and green spaces. | Playgrounds, Sports Facilities, Picnic Areas, Walking Trails, Local Events |
| Pinedo Beach | Another beautiful beach close to El Puig, known for its tranquility and scenic views. Attracts visitors looking to relax and enjoy the coastal beauty. | Quiet Beach Areas, Sunset Views, Local Fish Restaurants, Walking Trails, Water Activities |
| Ribera del Xuquer | A picturesque river area that provides beautiful landscapes and outdoor activities like cycling and hiking. Great for nature lovers. | River Trails, Cycling Routes, Nature Observation, Local Parks, Outdoor Recreational Activities |
Understanding Airbnb License Requirements & STR Laws in el Puig de Santa Maria (2025)
With 27% of listings showing registration in 2025, understanding potential Airbnb license requirements is crucial in el Puig de Santa Maria. Always verify the latest short term rental regulations and Airbnb license requirements directly with local government authorities for el Puig de Santa Maria to ensure full compliance before hosting.
(Source: AirROI data, 2025, based on 27% licensed listings)
Top Performing Airbnb Properties in el Puig de Santa Maria (2025)
Benchmark your potential! Explore examples of top-performing Airbnb properties in el Puig de Santa Mariabased on Trailing Twelve Month (TTM) revenue. Analyze their characteristics, revenue, occupancy rate, and ADR to understand what drives success in this market.
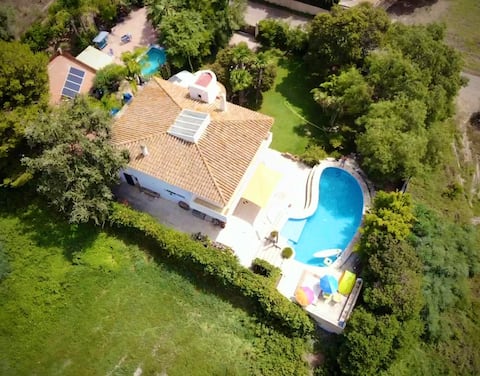
Nice house with pool near the beach
Entire Place • 4 bedrooms

Chalet PuigVal 50m from the beach
Entire Place • 5 bedrooms

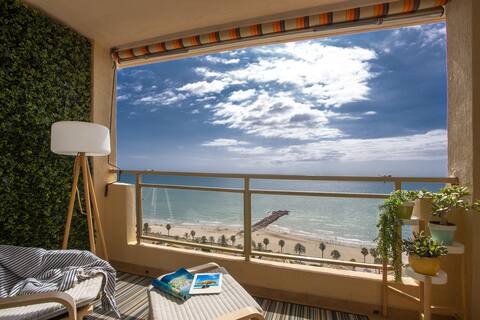
Golden sunset apartment
Entire Place • 3 bedrooms
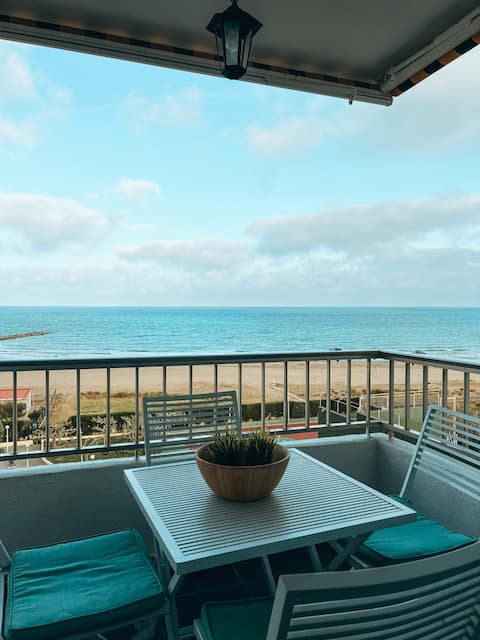
El Puig Beach II
Entire Place • 3 bedrooms
Hera 3BR | Swimming pool | Beach | BBQ
Entire Place • 3 bedrooms
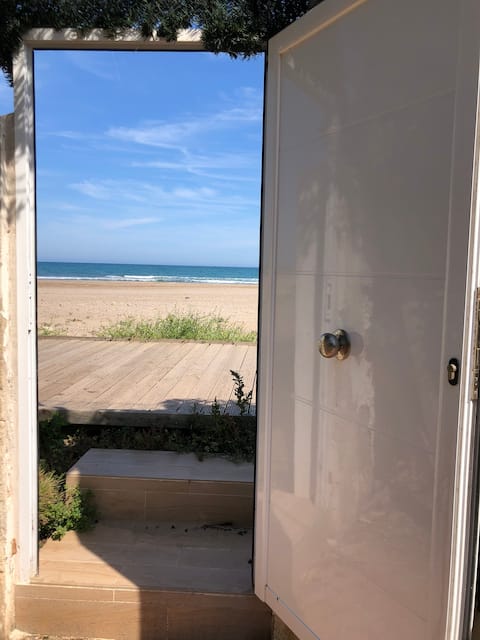
Chalet Mamalú. (Puig beach direct access)
Entire Place • 2 bedrooms
Note: Performance varies based on location, size, amenities, seasonality, and management quality. Data reflects the past 12 months.
Top Performing Airbnb Hosts in el Puig de Santa Maria (2025)
Learn from the best! This table showcases top-performing Airbnb hosts in el Puig de Santa Maria based on the number of properties managed and estimated total revenue over the past year. Analyze their scale and performance metrics.
| Host Name | Properties | Grossing Revenue | Stay Reviews | Avg Rating |
|---|---|---|---|---|
| Maria Jesus Y María Pilar | 4 | $83,287 | 81 | 4.95/5.0 |
| ACHousing | 2 | $78,065 | 156 | 4.86/5.0 |
| Rent And Rest | 2 | $65,728 | 162 | 4.87/5.0 |
| Host #416313777 | 1 | $63,422 | 86 | 4.70/5.0 |
| Ellen | 2 | $57,293 | 122 | 4.95/5.0 |
| Mr.Becker | 1 | $49,706 | 3 | 5.00/5.0 |
| SingularStays | 1 | $47,798 | 8 | 4.00/5.0 |
| Stl Apartamentos | 3 | $38,422 | 57 | 1.59/5.0 |
| Host #479824052 | 1 | $37,168 | 0 | 0.00/5.0 |
| Pablo | 1 | $34,842 | 117 | 4.97/5.0 |
Analyzing the strategies of top hosts, such as their property selection, pricing, and guest communication, can offer valuable lessons for optimizing your own Airbnb operations in el Puig de Santa Maria.
Dive Deeper: Advanced el Puig de Santa Maria STR Market Data (2025)
Ready to unlock more insights? AirROI provides access to advanced metrics and comprehensive Airbnb data for el Puig de Santa Maria. Explore detailed analytics beyond this report to refine your investment strategy, optimize pricing, and maximize your vacation rental profits.
Explore Advanced Metricsel Puig de Santa Maria Short-Term Rental Market Composition (2025): Property & Room Types
Room Type Distribution
Property Type Distribution
Market Composition Insights for el Puig de Santa Maria
- The el Puig de Santa Maria Airbnb market composition is heavily skewed towards Entire Home/Apt listings, which make up 93.7% of the 79 active rentals. This indicates strong guest preference for privacy and space.
- Looking at the property type distribution in el Puig de Santa Maria, Apartment/Condo properties are the most common (70.9%), reflecting the local real estate landscape.
- Houses represent a significant 21.5% portion, catering likely to families or larger groups.
- Smaller segments like hotel/boutique, outdoor/unique, others (combined 7.6%) offer potential for unique stay experiences.
el Puig de Santa Maria Airbnb Room Capacity Analysis (2025): Bedroom Distribution
Distribution of Listings by Number of Bedrooms
Room Capacity Insights for el Puig de Santa Maria
- The dominant room capacity in el Puig de Santa Maria is 2 bedrooms listings, making up 39.2% of the market. This suggests a strong demand for properties suitable for couples or solo travelers.
- Together, 2 bedrooms and 3 bedrooms properties represent 68.3% of the active Airbnb listings in el Puig de Santa Maria, indicating a high concentration in these sizes.
- A significant 35.4% of listings offer 3+ bedrooms, catering to larger groups and families seeking more space in el Puig de Santa Maria.
el Puig de Santa Maria Vacation Rental Guest Capacity Trends (2025)
Distribution of Listings by Guest Capacity
Guest Capacity Insights for el Puig de Santa Maria
- The most common guest capacity trend in el Puig de Santa Maria vacation rentals is listings accommodating 4 guests (31.6%). This suggests the primary traveler segment is likely small families or groups.
- Properties designed for 4 guests and 6 guests dominate the el Puig de Santa Maria STR market, accounting for 53.1% of listings.
- 34.2% of properties accommodate 6+ guests, serving the market segment for larger families or group travel in el Puig de Santa Maria.
- On average, properties in el Puig de Santa Maria are equipped to host 4.9 guests.
el Puig de Santa Maria Airbnb Booking Patterns (2025): Available vs. Booked Days
Available Days Distribution
Booked Days Distribution
Booking Pattern Insights for el Puig de Santa Maria
- The most common availability pattern in el Puig de Santa Maria falls within the 271-366 days range, representing 49.4% of listings. This suggests many properties have significant open periods on their calendars.
- Approximately 86.1% of listings show high availability (181+ days open annually), indicating potential for increased bookings or specific owner usage patterns.
- For booked days, the 91-180 days range is most frequent in el Puig de Santa Maria (36.7%), reflecting common guest stay durations or potential owner blocking patterns.
- A notable 15.2% of properties secure long booking periods (181+ days booked per year), highlighting successful long-term rental strategies or significant owner usage.
el Puig de Santa Maria Airbnb Minimum Stay Requirements Analysis
Distribution of Listings by Minimum Night Requirement
1 Night
6 listings
9% of total
2 Nights
22 listings
32.8% of total
3 Nights
15 listings
22.4% of total
4-6 Nights
11 listings
16.4% of total
7-29 Nights
5 listings
7.5% of total
30+ Nights
8 listings
11.9% of total
Key Insights
- The most prevalent minimum stay requirement in el Puig de Santa Maria is 2 Nights, adopted by 32.8% of listings. This highlights the market's preference for shorter, flexible bookings.
- A significant segment (11.9%) caters to monthly stays (30+ nights) in el Puig de Santa Maria, pointing to opportunities in the extended-stay market.
Recommendations
- Align with the market by considering a 2 Nights minimum stay, as 32.8% of el Puig de Santa Maria hosts use this setting.
- If feasible, allowing 1-night stays, especially midweek or during low season, could capture last-minute bookings, as only 9% currently do.
- A 2-night minimum appears standard (32.8%). Consider this for weekends or peak periods.
- Explore offering discounts for stays of 30+ nights to attract the 11.9% of the market seeking extended stays.
- Adjust minimum nights based on seasonality – potentially shorter during low season and longer during peak demand periods in el Puig de Santa Maria.
el Puig de Santa Maria Airbnb Cancellation Policy Trends Analysis (2025)
Super Strict 60 Days
1 listings
1.7% of total
Flexible
9 listings
15.5% of total
Moderate
11 listings
19% of total
Firm
24 listings
41.4% of total
Strict
13 listings
22.4% of total
Cancellation Policy Insights for el Puig de Santa Maria
- The prevailing Airbnb cancellation policy trend in el Puig de Santa Maria is Firm, used by 41.4% of listings.
- A majority (63.8%) of hosts in el Puig de Santa Maria utilize Firm or Strict policies, indicating a market where hosts prioritize booking security.
Recommendations for Hosts
- Consider adopting a Firm policy to align with the 41.4% market standard in el Puig de Santa Maria.
- Regularly review your cancellation policy against competitors and market demand shifts in el Puig de Santa Maria.
el Puig de Santa Maria STR Booking Lead Time Analysis (2025)
Average Booking Lead Time by Month
Booking Lead Time Insights for el Puig de Santa Maria
- The overall average booking lead time for vacation rentals in el Puig de Santa Maria is 58 days.
- Guests book furthest in advance for stays during July (average 126 days), likely coinciding with peak travel demand or local events.
- The shortest booking windows occur for stays in April (average 47 days), indicating more last-minute travel plans during this time.
- Seasonally, Summer (94 days avg.) sees the longest lead times, while Winter (59 days avg.) has the shortest, reflecting typical travel planning cycles.
Recommendations for Hosts
- Use the overall average lead time (58 days) as a baseline for your pricing and availability strategy in el Puig de Santa Maria.
- For July stays, consider implementing length-of-stay discounts or slightly higher rates for bookings made less than 126 days out to capitalize on advance planning.
- Target marketing efforts for the Summer season well in advance (at least 94 days) to capture early planners.
- Monitor your own booking lead times against these el Puig de Santa Maria averages to identify opportunities for dynamic pricing adjustments.
Popular & Essential Airbnb Amenities in el Puig de Santa Maria (2025)
Amenity Prevalence
Amenity Insights for el Puig de Santa Maria
- Essential amenities in el Puig de Santa Maria that guests expect include: Kitchen, TV, Washer. Lacking these (any) could significantly impact bookings.
- Popular amenities like Hot water, Essentials, Heating are common but not universal. Offering these can provide a competitive edge.
- A pool is a highly desired but not standard amenity, making it a key feature for attracting guests seeking leisure in el Puig de Santa Maria.
- Warning: Wifi is not universally provided but is considered essential globally. Ensure reliable Wifi is offered.
Recommendations for Hosts
- Ensure your listing includes all essential amenities for el Puig de Santa Maria: Kitchen, TV, Washer.
- Prioritize adding missing essentials: Kitchen, TV, Washer.
- Consider adding popular differentiators like Hot water or Essentials to increase appeal.
- Highlight unique or less common amenities you offer (e.g., hot tub, dedicated workspace, EV charger) in your listing description and photos.
- Regularly check competitor amenities in el Puig de Santa Maria to stay competitive.
el Puig de Santa Maria Airbnb Guest Demographics & Profile Analysis (2025)
Guest Profile Summary for el Puig de Santa Maria
- The typical guest profile for Airbnb in el Puig de Santa Maria consists of a mix of domestic (41%) and international guests, with top international origins including France, typically belonging to the Post-2000s (Gen Z/Alpha) group (50%), primarily speaking English or Spanish.
- Domestic travelers account for 40.7% of guests.
- Key international markets include Spain (40.7%) and France (12.7%).
- Top languages spoken are English (33.1%) followed by Spanish (26.3%).
- A significant demographic segment is the Post-2000s (Gen Z/Alpha) group, representing 50% of guests.
Recommendations for Hosts
- Balance marketing efforts between domestic and international channels based on the guest mix.
- Tailor amenities and listing descriptions to appeal to the dominant Post-2000s (Gen Z/Alpha) demographic (e.g., highlight fast WiFi, smart home features, local guides).
- Highlight unique local experiences or amenities relevant to the primary guest profile.
- Consider seasonal promotions aligned with peak travel times for key origin markets.
Nearby Short-Term Rental Market Comparison
How does the el Puig de Santa Maria Airbnb market stack up against its neighbors? Compare key performance metrics like average monthly revenue, ADR, and occupancy rates in surrounding areas to understand the broader regional STR landscape.
| Market | Active Properties | Monthly Revenue | Daily Rate | Avg. Occupancy |
|---|---|---|---|---|
| Macastre | 13 | $2,924 | $296.93 | 42% |
| Corbera | 13 | $2,721 | $206.87 | 41% |
| Bétera | 31 | $2,711 | $222.77 | 46% |
| l'Eliana | 33 | $2,510 | $298.45 | 43% |
| San Antonio de Benagéber | 11 | $2,374 | $335.55 | 40% |
| Manises | 25 | $2,352 | $175.71 | 38% |
| Olocau | 11 | $2,245 | $308.22 | 36% |
| Alboraia / Alboraya | 272 | $2,220 | $186.05 | 49% |
| la Pobla de Vallbona | 27 | $2,163 | $193.69 | 49% |
| Riba-roja de Túria | 21 | $2,132 | $221.03 | 41% |