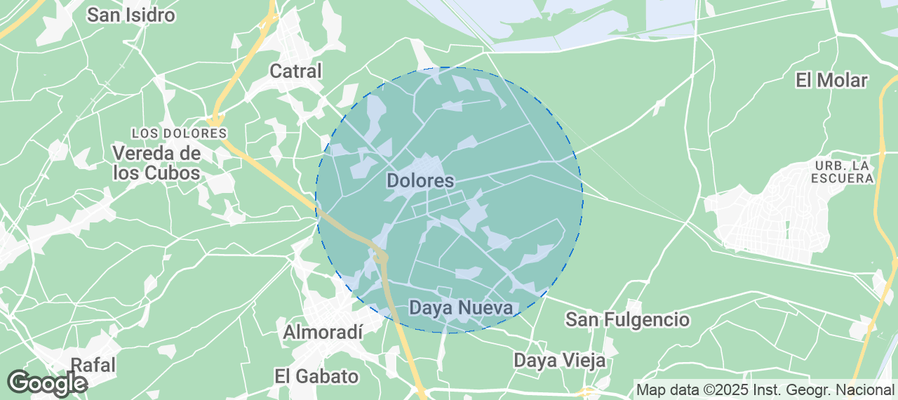
Dolores Airbnb Market Analysis 2025: Short Term Rental Data & Vacation Rental Statistics in Valencian Community, Spain
Is Airbnb profitable in Dolores in 2025? Explore comprehensive Airbnb analytics for Dolores, Valencian Community, Spain to uncover income potential. This 2025 STR market report for Dolores, based on AirROI data from April 2024 to March 2025, reveals key trends in the niche market of 21 active listings.
Whether you're considering an Airbnb investment in Dolores, optimizing your existing vacation rental, or exploring rental arbitrage opportunities, understanding the Dolores Airbnb data is crucial. Leveraging the low regulation environment is key to maximizing your short term rental income potential. Let's dive into the specifics.
Key Dolores Airbnb Performance Metrics Overview
Monthly Airbnb Revenue Variations & Income Potential in Dolores (2025)
Understanding the monthly revenue variations for Airbnb listings in Dolores is key to maximizing your short term rental income potential. Seasonality significantly impacts earnings. Our analysis, based on data from the past 12 months, shows that the peak revenue month for STRs in Dolores is typically August, while February often presents the lowest earnings, highlighting opportunities for strategic pricing adjustments during shoulder and low seasons. Explore the typical Airbnb income in Dolores across different performance tiers:
- Best-in-class properties (Top 10%) achieve $3,414+ monthly, often utilizing dynamic pricing and superior guest experiences.
- Strong performing properties (Top 25%) earn $2,046 or more, indicating effective management and desirable locations/amenities.
- Typical properties (Median) generate around $1,006 per month, representing the average market performance.
- Entry-level properties (Bottom 25%) see earnings around $674, often with potential for optimization.
Average Monthly Airbnb Earnings Trend in Dolores
Dolores Airbnb Occupancy Rate Trends (2025)
Maximize your bookings by understanding the Dolores STR occupancy trends. Seasonal demand shifts significantly influence how often properties are booked. Typically, Augustsees the highest demand (peak season occupancy), while February experiences the lowest (low season). Effective strategies, like adjusting minimum stays or offering promotions, can boost occupancy during slower periods. Here's how different property tiers perform in Dolores:
- Best-in-class properties (Top 10%) achieve 76%+ occupancy, indicating high desirability and potentially optimized availability.
- Strong performing properties (Top 25%) maintain 53% or higher occupancy, suggesting good market fit and guest satisfaction.
- Typical properties (Median) have an occupancy rate around 37%.
- Entry-level properties (Bottom 25%) average 25% occupancy, potentially facing higher vacancy.
Average Monthly Occupancy Rate Trend in Dolores
Average Daily Rate (ADR) Airbnb Trends in Dolores (2025)
Effective short term rental pricing strategy in Dolores involves understanding monthly ADR fluctuations. The Average Daily Rate (ADR) for Airbnb in Dolores typically peaks in July and dips lowest during March. Leveraging Airbnb dynamic pricing tools or strategies based on this seasonality can significantly boost revenue. Here's a look at the typical nightly rates achieved:
- Best-in-class properties (Top 10%) command rates of $302+ per night, often due to premium features or locations.
- Strong performing properties (Top 25%) achieve nightly rates of $220 or more.
- Typical properties (Median) charge around $88 per night.
- Entry-level properties (Bottom 25%) earn around $53 per night.
Average Daily Rate (ADR) Trend by Month in Dolores
Get Live Dolores Market Intelligence 👇
Explore Real-time Analytics
Airbnb Seasonality Analysis & Trends in Dolores (2025)
Peak Season (August, July, April)
- Revenue averages $2,750 per month
- Occupancy rates average 59.4%
- Daily rates average $166
Shoulder Season
- Revenue averages $1,562 per month
- Occupancy maintains around 39.5%
- Daily rates hold near $144
Low Season (January, February, December)
- Revenue drops to average $739 per month
- Occupancy decreases to average 27.9%
- Daily rates adjust to average $109
Seasonality Insights for Dolores
- The Airbnb seasonality in Dolores shows highly seasonal trends requiring careful strategy. While the sections above show seasonal averages, it's also insightful to look at the extremes:
- During the high season, the absolute peak month showcases Dolores's highest earning potential, with monthly revenues capable of climbing to $2,986, occupancy reaching a high of 78.4%, and ADRs peaking at $172.
- Conversely, the slowest single month of the year, typically falling within the low season, marks the market's lowest point. In this month, revenue might dip to $577, occupancy could drop to 24.7%, and ADRs may adjust down to $107.
- Understanding both the seasonal averages and these monthly peaks and troughs in revenue, occupancy, and ADR is crucial for maximizing your Airbnb profit potential in Dolores.
Seasonal Strategies for Maximizing Profit
- Peak Season: Maximize revenue through premium pricing and potentially longer minimum stays. Ensure high availability.
- Low Season: Offer competitive pricing, special promotions (e.g., extended stay discounts), and flexible cancellation policies. Target off-season travelers like remote workers or budget-conscious guests.
- Shoulder Seasons: Implement dynamic pricing that balances peak and low rates. Target weekend travelers or specific events. Offer slightly more flexible terms than peak season.
- Regularly analyze your own performance against these Dolores seasonality benchmarks and adjust your pricing and availability strategy accordingly.
Best Areas for Airbnb Investment in Dolores (2025)
Exploring the top neighborhoods for short-term rentals in Dolores? This section highlights key areas, outlining why they are attractive for hosts and guests, along with notable local attractions. Consider these locations based on your target guest profile and investment strategy.
| Neighborhood / Area | Why Host Here? (Target Guests & Appeal) | Key Attractions & Landmarks |
|---|---|---|
| Dolores Center | The heart of Dolores, featuring charming local shops and eateries. A great location for visitors wanting to experience the authentic Spanish lifestyle while being within reach of attractions. | Local markets, Cultural festivals, Plaza de Dolores |
| Natural Park of El Hondo | A beautiful natural area nearby attract tourists for its stunning landscapes and birdwatching opportunities. Ideal for nature lovers and outdoor enthusiasts. | Birdwatching, Hiking trails, Picnic areas |
| Dolores Beach | Located near the coast, this beach area is perfect for sun-seekers and water sports enthusiasts, offering a relaxing seaside experience. | Beach cafes, Water sports, Beach volleyball |
| Museo de la Huerta | A cultural gem showcasing the history and agriculture of the region. Attracts travelers interested in local heritage and education. | Agricultural exhibits, Workshops, Cultural events |
| Los Montesinos | A quaint nearby town known for its tranquility and small-town charm, appealing to those looking for a peaceful retreat. | Local parks, Casual dining, Community events |
| Torrevieja | A bustling coastal city with vibrant nightlife, shops, and restaurants, popular among tourists seeking a lively environment close to Dolores. | Seaside promenades, Nightlife, Shopping centers |
| La Mata Beach | A popular beach destination known for its soft sands and clear waters. Perfect for families and beachgoers looking to enjoy the sun. | Beachfront restaurants, Water activities, Promenade |
| Villamartín | An upscale residential community known for its golf courses and modern amenities. Attracts visitors interested in leisure and golf getaways. | Golf courses, Shopping plazas, Dining options |
Understanding Airbnb License Requirements & STR Laws in Dolores (2025)
While Dolores, Valencian Community, Spain currently shows low STR regulations, specific Airbnb license requirements might still exist or change. Always verify the latest short term rental regulations and Airbnb license requirements directly with local government authorities for Dolores to ensure full compliance before hosting.
(Source: AirROI data, 2025, based on 10% licensed listings)
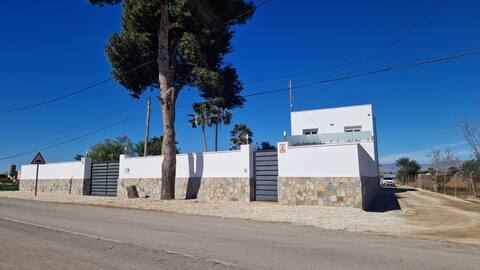
Top Performing Airbnb Properties in Dolores (2025)
Benchmark your potential! Explore examples of top-performing Airbnb properties in Doloresbased on Trailing Twelve Month (TTM) revenue. Analyze their characteristics, revenue, occupancy rate, and ADR to understand what drives success in this market.
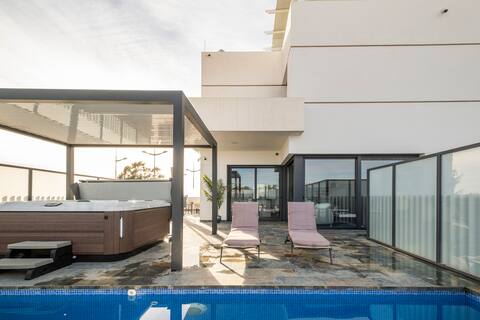
Fee4Me Villa with pool in Dolores, Alicante
Entire Place • 3 bedrooms
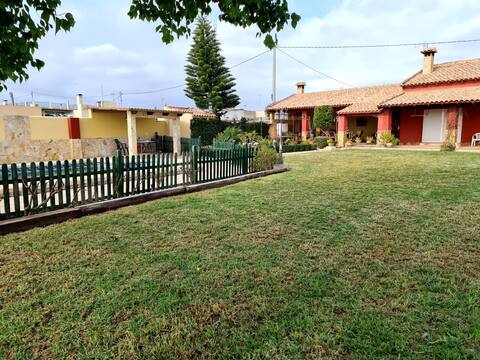
Casa vacacional, pet friendly
Entire Place • 2 bedrooms

Fidalsa Sunny Valley
Entire Place • 3 bedrooms
Casamar-Dolores 1
Entire Place • 3 bedrooms
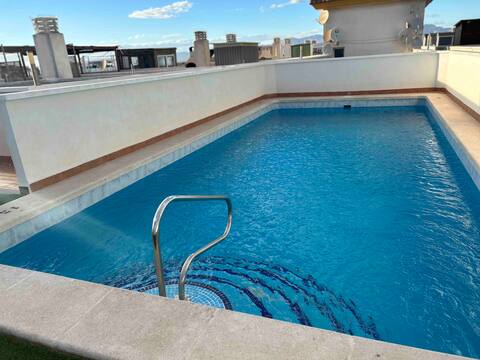
Apartment with a swimming pool
Entire Place • 2 bedrooms
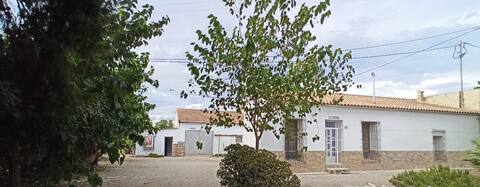
Casa Rural "La Tórtola"
Entire Place • 3 bedrooms
Note: Performance varies based on location, size, amenities, seasonality, and management quality. Data reflects the past 12 months.
Top Performing Airbnb Hosts in Dolores (2025)
Learn from the best! This table showcases top-performing Airbnb hosts in Dolores based on the number of properties managed and estimated total revenue over the past year. Analyze their scale and performance metrics.
| Host Name | Properties | Grossing Revenue | Stay Reviews | Avg Rating |
|---|---|---|---|---|
| Gianluca Y Vanessa | 1 | $74,258 | 15 | 4.87/5.0 |
| Michael | 6 | $46,619 | 264 | 4.86/5.0 |
| Laura | 1 | $29,518 | 32 | 5.00/5.0 |
| Host #133498544 | 2 | $24,778 | 0 | 0.00/5.0 |
| Host #2679647 | 1 | $23,734 | 25 | 4.16/5.0 |
| Aurelie | 1 | $13,776 | 13 | 4.85/5.0 |
| Host #139439516 | 1 | $12,011 | 2 | 0.00/5.0 |
| Gema | 1 | $11,587 | 42 | 4.86/5.0 |
| Jose | 1 | $11,032 | 7 | 4.86/5.0 |
| Eduardo&Elena | 1 | $10,615 | 54 | 4.78/5.0 |
Analyzing the strategies of top hosts, such as their property selection, pricing, and guest communication, can offer valuable lessons for optimizing your own Airbnb operations in Dolores.
Dive Deeper: Advanced Dolores STR Market Data (2025)
Ready to unlock more insights? AirROI provides access to advanced metrics and comprehensive Airbnb data for Dolores. Explore detailed analytics beyond this report to refine your investment strategy, optimize pricing, and maximize your vacation rental profits.
Explore Advanced MetricsDolores Short-Term Rental Market Composition (2025): Property & Room Types
Room Type Distribution
Property Type Distribution
Market Composition Insights for Dolores
- The Dolores Airbnb market composition is heavily skewed towards Entire Home/Apt listings, which make up 95.2% of the 21 active rentals. This indicates strong guest preference for privacy and space.
- Looking at the property type distribution in Dolores, House properties are the most common (57.1%), reflecting the local real estate landscape.
- Houses represent a significant 57.1% portion, catering likely to families or larger groups.
- Smaller segments like others (combined 4.8%) offer potential for unique stay experiences.
Dolores Airbnb Room Capacity Analysis (2025): Bedroom Distribution
Distribution of Listings by Number of Bedrooms
Room Capacity Insights for Dolores
- The dominant room capacity in Dolores is 3 bedrooms listings, making up 38.1% of the market. This suggests a strong demand for properties suitable for families or small groups.
- Together, 3 bedrooms and 2 bedrooms properties represent 61.9% of the active Airbnb listings in Dolores, indicating a high concentration in these sizes.
- A significant 42.9% of listings offer 3+ bedrooms, catering to larger groups and families seeking more space in Dolores.
Dolores Vacation Rental Guest Capacity Trends (2025)
Distribution of Listings by Guest Capacity
Guest Capacity Insights for Dolores
- The most common guest capacity trend in Dolores vacation rentals is listings accommodating 6 guests (28.6%). This suggests the primary traveler segment is likely larger groups.
- Properties designed for 6 guests and 2 guests dominate the Dolores STR market, accounting for 52.4% of listings.
- 47.6% of properties accommodate 6+ guests, serving the market segment for larger families or group travel in Dolores.
- On average, properties in Dolores are equipped to host 4.5 guests.
Dolores Airbnb Booking Patterns (2025): Available vs. Booked Days
Available Days Distribution
Booked Days Distribution
Booking Pattern Insights for Dolores
- The most common availability pattern in Dolores falls within the 271-366 days range, representing 47.6% of listings. This suggests many properties have significant open periods on their calendars.
- Approximately 71.4% of listings show high availability (181+ days open annually), indicating potential for increased bookings or specific owner usage patterns.
- For booked days, the 181-270 days range is most frequent in Dolores (28.6%), reflecting common guest stay durations or potential owner blocking patterns.
- A notable 28.6% of properties secure long booking periods (181+ days booked per year), highlighting successful long-term rental strategies or significant owner usage.
Dolores Airbnb Minimum Stay Requirements Analysis
Distribution of Listings by Minimum Night Requirement
1 Night
4 listings
23.5% of total
2 Nights
4 listings
23.5% of total
3 Nights
3 listings
17.6% of total
4-6 Nights
3 listings
17.6% of total
30+ Nights
3 listings
17.6% of total
Key Insights
- The most prevalent minimum stay requirement in Dolores is 1 Night, adopted by 23.5% of listings. This highlights the market's preference for shorter, flexible bookings.
- A significant segment (17.6%) caters to monthly stays (30+ nights) in Dolores, pointing to opportunities in the extended-stay market.
Recommendations
- Align with the market by considering a 1 Night minimum stay, as 23.5% of Dolores hosts use this setting.
- If feasible, allowing 1-night stays, especially midweek or during low season, could capture last-minute bookings, as only 23.5% currently do.
- Explore offering discounts for stays of 30+ nights to attract the 17.6% of the market seeking extended stays.
- Adjust minimum nights based on seasonality – potentially shorter during low season and longer during peak demand periods in Dolores.
Dolores Airbnb Cancellation Policy Trends Analysis (2025)
Flexible
2 listings
13.3% of total
Moderate
5 listings
33.3% of total
Firm
3 listings
20% of total
Strict
5 listings
33.3% of total
Cancellation Policy Insights for Dolores
- The prevailing Airbnb cancellation policy trend in Dolores is Moderate, used by 33.3% of listings.
- A majority (53.3%) of hosts in Dolores utilize Firm or Strict policies, indicating a market where hosts prioritize booking security.
Recommendations for Hosts
- Consider adopting a Moderate policy to align with the 33.3% market standard in Dolores.
- With 33.3% using Strict terms, this is a viable option in Dolores, particularly for high-value properties or during peak demand periods.
- Regularly review your cancellation policy against competitors and market demand shifts in Dolores.
Dolores STR Booking Lead Time Analysis (2025)
Average Booking Lead Time by Month
Booking Lead Time Insights for Dolores
- The overall average booking lead time for vacation rentals in Dolores is 49 days.
- Guests book furthest in advance for stays during July (average 130 days), likely coinciding with peak travel demand or local events.
- The shortest booking windows occur for stays in February (average 14 days), indicating more last-minute travel plans during this time.
- Seasonally, Summer (75 days avg.) sees the longest lead times, while Winter (25 days avg.) has the shortest, reflecting typical travel planning cycles.
Recommendations for Hosts
- Use the overall average lead time (49 days) as a baseline for your pricing and availability strategy in Dolores.
- For July stays, consider implementing length-of-stay discounts or slightly higher rates for bookings made less than 130 days out to capitalize on advance planning.
- During February, focus on last-minute booking availability and promotions, as guests book with very short notice (14 days avg.).
- Target marketing efforts for the Summer season well in advance (at least 75 days) to capture early planners.
- Monitor your own booking lead times against these Dolores averages to identify opportunities for dynamic pricing adjustments.
Popular & Essential Airbnb Amenities in Dolores (2025)
Amenity Prevalence
Amenity Insights for Dolores
- Essential amenities in Dolores that guests expect include: Air conditioning, Wifi, Hot water, Heating, Washer, Kitchen, Essentials. Lacking these (any) could significantly impact bookings.
- Popular amenities like Dishes and silverware, Bed linens, Refrigerator are common but not universal. Offering these can provide a competitive edge.
Recommendations for Hosts
- Ensure your listing includes all essential amenities for Dolores: Air conditioning, Wifi, Hot water, Heating, Washer, Kitchen, Essentials.
- Consider adding popular differentiators like Dishes and silverware or Bed linens to increase appeal.
- Highlight unique or less common amenities you offer (e.g., hot tub, dedicated workspace, EV charger) in your listing description and photos.
- Regularly check competitor amenities in Dolores to stay competitive.
Dolores Airbnb Guest Demographics & Profile Analysis (2025)
Guest Profile Summary for Dolores
- The typical guest profile for Airbnb in Dolores consists of a mix of domestic (51%) and international guests, often arriving from nearby Valencia, typically belonging to the Post-2000s (Gen Z/Alpha) group (50%), primarily speaking English or Spanish.
- Domestic travelers account for 50.8% of guests.
- Key international markets include Spain (50.8%) and France (16.4%).
- Top languages spoken are English (32.1%) followed by Spanish (32.1%).
- A significant demographic segment is the Post-2000s (Gen Z/Alpha) group, representing 50% of guests.
Recommendations for Hosts
- Balance marketing efforts between domestic and international channels based on the guest mix.
- Tailor amenities and listing descriptions to appeal to the dominant Post-2000s (Gen Z/Alpha) demographic (e.g., highlight fast WiFi, smart home features, local guides).
- Highlight unique local experiences or amenities relevant to the primary guest profile.
- Consider seasonal promotions aligned with peak travel times for key origin markets.
Nearby Short-Term Rental Market Comparison
How does the Dolores Airbnb market stack up against its neighbors? Compare key performance metrics like average monthly revenue, ADR, and occupancy rates in surrounding areas to understand the broader regional STR landscape.
| Market | Active Properties | Monthly Revenue | Daily Rate | Avg. Occupancy |
|---|---|---|---|---|
| Macastre | 13 | $2,924 | $296.93 | 42% |
| Corbera | 13 | $2,721 | $206.87 | 41% |
| Bétera | 31 | $2,711 | $222.77 | 46% |
| l'Eliana | 33 | $2,510 | $298.45 | 43% |
| San Antonio de Benagéber | 11 | $2,374 | $335.55 | 40% |
| Manises | 25 | $2,352 | $175.71 | 38% |
| Olocau | 11 | $2,245 | $308.22 | 36% |
| Alboraia / Alboraya | 272 | $2,220 | $186.05 | 49% |
| la Pobla de Vallbona | 27 | $2,163 | $193.69 | 49% |
| Riba-roja de Túria | 21 | $2,132 | $221.03 | 41% |