Chiva Airbnb Market Analysis 2025: Short Term Rental Data & Vacation Rental Statistics in Valencian Community, Spain
Is Airbnb profitable in Chiva in 2025? Explore comprehensive Airbnb analytics for Chiva, Valencian Community, Spain to uncover income potential. This 2025 STR market report for Chiva, based on AirROI data from April 2024 to March 2025, reveals key trends in the niche market of 54 active listings.
Whether you're considering an Airbnb investment in Chiva, optimizing your existing vacation rental, or exploring rental arbitrage opportunities, understanding the Chiva Airbnb data is crucial. Understanding the local regulations is key to maximizing your short term rental income potential. Let's dive into the specifics.
Key Chiva Airbnb Performance Metrics Overview
Monthly Airbnb Revenue Variations & Income Potential in Chiva (2025)
Understanding the monthly revenue variations for Airbnb listings in Chiva is key to maximizing your short term rental income potential. Seasonality significantly impacts earnings. Our analysis, based on data from the past 12 months, shows that the peak revenue month for STRs in Chiva is typically August, while January often presents the lowest earnings, highlighting opportunities for strategic pricing adjustments during shoulder and low seasons. Explore the typical Airbnb income in Chiva across different performance tiers:
- Best-in-class properties (Top 10%) achieve $5,963+ monthly, often utilizing dynamic pricing and superior guest experiences.
- Strong performing properties (Top 25%) earn $3,964 or more, indicating effective management and desirable locations/amenities.
- Typical properties (Median) generate around $1,945 per month, representing the average market performance.
- Entry-level properties (Bottom 25%) see earnings around $824, often with potential for optimization.
Average Monthly Airbnb Earnings Trend in Chiva
Chiva Airbnb Occupancy Rate Trends (2025)
Maximize your bookings by understanding the Chiva STR occupancy trends. Seasonal demand shifts significantly influence how often properties are booked. Typically, Augustsees the highest demand (peak season occupancy), while January experiences the lowest (low season). Effective strategies, like adjusting minimum stays or offering promotions, can boost occupancy during slower periods. Here's how different property tiers perform in Chiva:
- Best-in-class properties (Top 10%) achieve 75%+ occupancy, indicating high desirability and potentially optimized availability.
- Strong performing properties (Top 25%) maintain 56% or higher occupancy, suggesting good market fit and guest satisfaction.
- Typical properties (Median) have an occupancy rate around 36%.
- Entry-level properties (Bottom 25%) average 20% occupancy, potentially facing higher vacancy.
Average Monthly Occupancy Rate Trend in Chiva
Average Daily Rate (ADR) Airbnb Trends in Chiva (2025)
Effective short term rental pricing strategy in Chiva involves understanding monthly ADR fluctuations. The Average Daily Rate (ADR) for Airbnb in Chiva typically peaks in August and dips lowest during April. Leveraging Airbnb dynamic pricing tools or strategies based on this seasonality can significantly boost revenue. Here's a look at the typical nightly rates achieved:
- Best-in-class properties (Top 10%) command rates of $325+ per night, often due to premium features or locations.
- Strong performing properties (Top 25%) achieve nightly rates of $232 or more.
- Typical properties (Median) charge around $139 per night.
- Entry-level properties (Bottom 25%) earn around $92 per night.
Average Daily Rate (ADR) Trend by Month in Chiva
Get Live Chiva Market Intelligence 👇

Explore Real-time Analytics
Airbnb Seasonality Analysis & Trends in Chiva (2025)
Peak Season (August, July, June)
- Revenue averages $4,249 per month
- Occupancy rates average 55.5%
- Daily rates average $187
Shoulder Season
- Revenue averages $2,629 per month
- Occupancy maintains around 36.6%
- Daily rates hold near $182
Low Season (January, February, March)
- Revenue drops to average $1,352 per month
- Occupancy decreases to average 29.2%
- Daily rates adjust to average $181
Seasonality Insights for Chiva
- The Airbnb seasonality in Chiva shows highly seasonal trends requiring careful strategy. While the sections above show seasonal averages, it's also insightful to look at the extremes:
- During the high season, the absolute peak month showcases Chiva's highest earning potential, with monthly revenues capable of climbing to $4,522, occupancy reaching a high of 59.0%, and ADRs peaking at $192.
- Conversely, the slowest single month of the year, typically falling within the low season, marks the market's lowest point. In this month, revenue might dip to $1,100, occupancy could drop to 20.2%, and ADRs may adjust down to $175.
- Understanding both the seasonal averages and these monthly peaks and troughs in revenue, occupancy, and ADR is crucial for maximizing your Airbnb profit potential in Chiva.
Seasonal Strategies for Maximizing Profit
- Peak Season: Maximize revenue through premium pricing and potentially longer minimum stays. Ensure high availability.
- Low Season: Offer competitive pricing, special promotions (e.g., extended stay discounts), and flexible cancellation policies. Target off-season travelers like remote workers or budget-conscious guests.
- Shoulder Seasons: Implement dynamic pricing that balances peak and low rates. Target weekend travelers or specific events. Offer slightly more flexible terms than peak season.
- Regularly analyze your own performance against these Chiva seasonality benchmarks and adjust your pricing and availability strategy accordingly.
Best Areas for Airbnb Investment in Chiva (2025)
Exploring the top neighborhoods for short-term rentals in Chiva? This section highlights key areas, outlining why they are attractive for hosts and guests, along with notable local attractions. Consider these locations based on your target guest profile and investment strategy.
| Neighborhood / Area | Why Host Here? (Target Guests & Appeal) | Key Attractions & Landmarks |
|---|---|---|
| Chiva Town Center | The heart of Chiva, offering traditional Spanish charm along with local shops and eateries. Ideal for travelers seeking an authentic experience and easy access to local attractions. | Chiva Castle, Iglesia de San Juan Bautista, Parque de los Hermanos Maristas, Local markets, Cafes and tapas bars |
| La Loma | A residential area with a peaceful atmosphere, perfect for families looking for a quiet stay while still having access to Chiva's amenities. | Campo de Golf El Bosque, Hiking trails, Natural parks, Close to Valencia City |
| Cheste | Nearby Chiva, known for its motorsport circuit and outdoor activities. Attracts sports enthusiasts and families. | Circuit Ricardo Tormo, Cuesta de Cheste hiking path, Valencia Lakes, Local wineries |
| Alborache | Scenic village near Chiva, popular for rural tourism and outdoor adventures. Great for guests wanting to explore the surrounding nature. | Natural park of Los Reyes, Outdoor sports, Local trails, Rural accommodations |
| Riba-roja de Turia | Just a short drive from Chiva, this area offers a variety of outdoor sports and activities along the Turia River, appealing to adventure lovers. | Turia River Park, Hiking and cycling paths, Modernist architecture, Local gastronomy |
| Buñol | Famous for the Tomatina festival, this town attracts tourists during the event and throughout the year with its historic sites and beautiful landscapes. | La Tomatina Festival, Buñol Castle, Caves of San José, Natural beauty |
| Llíria | Known for its rich history and culture, this town offers a blend of historical sites and modern comforts, appealing to a wide range of travelers. | Roman ruins, Iglesia de la Asunción, Festivals, Natural parks |
| Sierra Calderona Natural Park | A stunning natural park offering hiking, nature walks, and stunning views, perfect for eco-tourism and those seeking a retreat in nature. | Hiking trails, Birdwatching, Stunning landscapes, Campgrounds |
Understanding Airbnb License Requirements & STR Laws in Chiva (2025)
With 17% of listings showing registration in 2025, understanding potential Airbnb license requirements is crucial in Chiva. Always verify the latest short term rental regulations and Airbnb license requirements directly with local government authorities for Chiva to ensure full compliance before hosting.
(Source: AirROI data, 2025, based on 17% licensed listings)
Top Performing Airbnb Properties in Chiva (2025)
Benchmark your potential! Explore examples of top-performing Airbnb properties in Chivabased on Trailing Twelve Month (TTM) revenue. Analyze their characteristics, revenue, occupancy rate, and ADR to understand what drives success in this market.

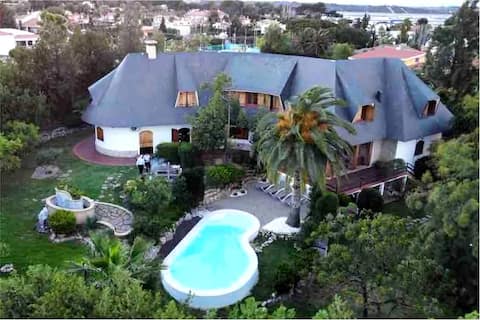
CASA LES GARROFERES (20 guests)
Entire Place • 7 bedrooms
Valencia 10 mins /motoGP CHESTE circuit! Fallas
Entire Place • 6 bedrooms

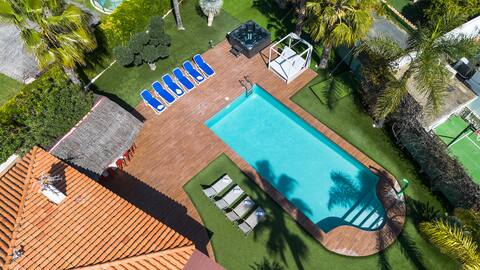
Villa Oasis Chiva Lujoso Refugio
Entire Place • 3 bedrooms

Casa Valencia, Golf, Beaches, Cheste Motorcycle Circuit
Entire Place • 5 bedrooms
Fantasy Home Valencia: Ideal for Fallas and MotoGP
Entire Place • 5 bedrooms
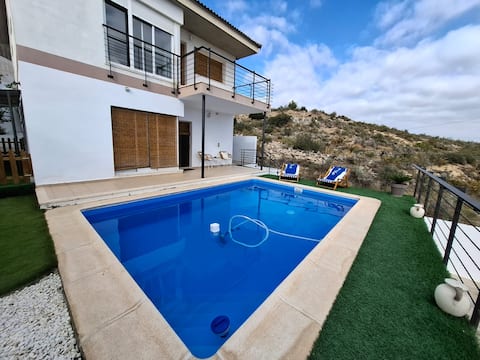
Chalet con estilo a 10 min Circuito Cheste
Entire Place • 3 bedrooms
Note: Performance varies based on location, size, amenities, seasonality, and management quality. Data reflects the past 12 months.
Top Performing Airbnb Hosts in Chiva (2025)
Learn from the best! This table showcases top-performing Airbnb hosts in Chiva based on the number of properties managed and estimated total revenue over the past year. Analyze their scale and performance metrics.
| Host Name | Properties | Grossing Revenue | Stay Reviews | Avg Rating |
|---|---|---|---|---|
| Mery | 2 | $98,071 | 148 | 4.92/5.0 |
| Josep Manel | 1 | $87,733 | 10 | 4.70/5.0 |
| José Antonio | 1 | $86,012 | 122 | 4.91/5.0 |
| Oasis BnB SL | 1 | $73,409 | 10 | 4.40/5.0 |
| Binyamin | 1 | $61,153 | 55 | 4.93/5.0 |
| Host #6660101 | 1 | $56,989 | 24 | 4.75/5.0 |
| Magda | 1 | $55,497 | 22 | 5.00/5.0 |
| Layla | 1 | $55,113 | 17 | 4.94/5.0 |
| Andreea | 1 | $43,586 | 10 | 4.90/5.0 |
| Host #36455654 | 1 | $42,224 | 61 | 4.56/5.0 |
Analyzing the strategies of top hosts, such as their property selection, pricing, and guest communication, can offer valuable lessons for optimizing your own Airbnb operations in Chiva.
Dive Deeper: Advanced Chiva STR Market Data (2025)
Ready to unlock more insights? AirROI provides access to advanced metrics and comprehensive Airbnb data for Chiva. Explore detailed analytics beyond this report to refine your investment strategy, optimize pricing, and maximize your vacation rental profits.
Explore Advanced MetricsChiva Short-Term Rental Market Composition (2025): Property & Room Types
Room Type Distribution
Property Type Distribution
Market Composition Insights for Chiva
- The Chiva Airbnb market composition is heavily skewed towards Entire Home/Apt listings, which make up 87% of the 54 active rentals. This indicates strong guest preference for privacy and space.
- Looking at the property type distribution in Chiva, House properties are the most common (74.1%), reflecting the local real estate landscape.
- Houses represent a significant 74.1% portion, catering likely to families or larger groups.
- Smaller segments like hotel/boutique, outdoor/unique, others (combined 7.5%) offer potential for unique stay experiences.
Chiva Airbnb Room Capacity Analysis (2025): Bedroom Distribution
Distribution of Listings by Number of Bedrooms
Room Capacity Insights for Chiva
- The dominant room capacity in Chiva is 3 bedrooms listings, making up 25.9% of the market. This suggests a strong demand for properties suitable for families or small groups.
- Together, 3 bedrooms and 2 bedrooms properties represent 50.0% of the active Airbnb listings in Chiva, indicating a high concentration in these sizes.
- A significant 59.2% of listings offer 3+ bedrooms, catering to larger groups and families seeking more space in Chiva.
Chiva Vacation Rental Guest Capacity Trends (2025)
Distribution of Listings by Guest Capacity
Guest Capacity Insights for Chiva
- The most common guest capacity trend in Chiva vacation rentals is listings accommodating 8+ guests (35.2%). This suggests the primary traveler segment is likely larger groups.
- Properties designed for 8+ guests and 6 guests dominate the Chiva STR market, accounting for 57.4% of listings.
- 61.1% of properties accommodate 6+ guests, serving the market segment for larger families or group travel in Chiva.
- On average, properties in Chiva are equipped to host 5.6 guests.
Chiva Airbnb Booking Patterns (2025): Available vs. Booked Days
Available Days Distribution
Booked Days Distribution
Booking Pattern Insights for Chiva
- The most common availability pattern in Chiva falls within the 271-366 days range, representing 48.1% of listings. This suggests many properties have significant open periods on their calendars.
- Approximately 85.1% of listings show high availability (181+ days open annually), indicating potential for increased bookings or specific owner usage patterns.
- For booked days, the 91-180 days range is most frequent in Chiva (37%), reflecting common guest stay durations or potential owner blocking patterns.
- A notable 14.9% of properties secure long booking periods (181+ days booked per year), highlighting successful long-term rental strategies or significant owner usage.
Chiva Airbnb Minimum Stay Requirements Analysis
Distribution of Listings by Minimum Night Requirement
1 Night
8 listings
18.2% of total
2 Nights
19 listings
43.2% of total
3 Nights
4 listings
9.1% of total
4-6 Nights
4 listings
9.1% of total
7-29 Nights
3 listings
6.8% of total
30+ Nights
6 listings
13.6% of total
Key Insights
- The most prevalent minimum stay requirement in Chiva is 2 Nights, adopted by 43.2% of listings. This highlights the market's preference for shorter, flexible bookings.
- A strong majority (61.4%) of the Chiva Airbnb data shows acceptance of very short stays (1-2 nights), indicating a dynamic, high-turnover market.
- A significant segment (13.6%) caters to monthly stays (30+ nights) in Chiva, pointing to opportunities in the extended-stay market.
Recommendations
- Align with the market by considering a 2 Nights minimum stay, as 43.2% of Chiva hosts use this setting.
- If feasible, allowing 1-night stays, especially midweek or during low season, could capture last-minute bookings, as only 18.2% currently do.
- A 2-night minimum appears standard (43.2%). Consider this for weekends or peak periods.
- Explore offering discounts for stays of 30+ nights to attract the 13.6% of the market seeking extended stays.
- Adjust minimum nights based on seasonality – potentially shorter during low season and longer during peak demand periods in Chiva.
Chiva Airbnb Cancellation Policy Trends Analysis (2025)
Flexible
13 listings
34.2% of total
Moderate
11 listings
28.9% of total
Firm
5 listings
13.2% of total
Strict
9 listings
23.7% of total
Cancellation Policy Insights for Chiva
- The prevailing Airbnb cancellation policy trend in Chiva is Flexible, used by 34.2% of listings.
- There's a relatively balanced mix between guest-friendly (63.1%) and stricter (36.9%) policies, offering choices for different guest needs.
Recommendations for Hosts
- Consider adopting a Flexible policy to align with the 34.2% market standard in Chiva.
- Regularly review your cancellation policy against competitors and market demand shifts in Chiva.
Chiva STR Booking Lead Time Analysis (2025)
Average Booking Lead Time by Month
Booking Lead Time Insights for Chiva
- The overall average booking lead time for vacation rentals in Chiva is 65 days.
- Guests book furthest in advance for stays during July (average 94 days), likely coinciding with peak travel demand or local events.
- The shortest booking windows occur for stays in March (average 35 days), indicating more last-minute travel plans during this time.
- Seasonally, Summer (69 days avg.) sees the longest lead times, while Spring (53 days avg.) has the shortest, reflecting typical travel planning cycles.
Recommendations for Hosts
- Use the overall average lead time (65 days) as a baseline for your pricing and availability strategy in Chiva.
- For July stays, consider implementing length-of-stay discounts or slightly higher rates for bookings made less than 94 days out to capitalize on advance planning.
- Target marketing efforts for the Summer season well in advance (at least 69 days) to capture early planners.
- Monitor your own booking lead times against these Chiva averages to identify opportunities for dynamic pricing adjustments.
Popular & Essential Airbnb Amenities in Chiva (2025)
Amenity Prevalence
Amenity Insights for Chiva
- Essential amenities in Chiva that guests expect include: TV, Kitchen. Lacking these (any) could significantly impact bookings.
- Popular amenities like Washer, Heating, Wifi are common but not universal. Offering these can provide a competitive edge.
- A pool is a highly desired but not standard amenity, making it a key feature for attracting guests seeking leisure in Chiva.
- Warning: Wifi is not universally provided but is considered essential globally. Ensure reliable Wifi is offered.
Recommendations for Hosts
- Ensure your listing includes all essential amenities for Chiva: TV, Kitchen.
- Prioritize adding missing essentials: Kitchen.
- Consider adding popular differentiators like Washer or Heating to increase appeal.
- Highlight unique or less common amenities you offer (e.g., hot tub, dedicated workspace, EV charger) in your listing description and photos.
- Regularly check competitor amenities in Chiva to stay competitive.
Chiva Airbnb Guest Demographics & Profile Analysis (2025)
Guest Profile Summary for Chiva
- The typical guest profile for Airbnb in Chiva consists of a mix of domestic (52%) and international guests, often arriving from nearby Madrid, typically belonging to the Post-2000s (Gen Z/Alpha) group (50%), primarily speaking English or Spanish.
- Domestic travelers account for 52.4% of guests.
- Key international markets include Spain (52.4%) and France (12.1%).
- Top languages spoken are English (34.5%) followed by Spanish (29.4%).
- A significant demographic segment is the Post-2000s (Gen Z/Alpha) group, representing 50% of guests.
Recommendations for Hosts
- Balance marketing efforts between domestic and international channels based on the guest mix.
- Tailor amenities and listing descriptions to appeal to the dominant Post-2000s (Gen Z/Alpha) demographic (e.g., highlight fast WiFi, smart home features, local guides).
- Highlight unique local experiences or amenities relevant to the primary guest profile.
- Consider seasonal promotions aligned with peak travel times for key origin markets.
Nearby Short-Term Rental Market Comparison
How does the Chiva Airbnb market stack up against its neighbors? Compare key performance metrics like average monthly revenue, ADR, and occupancy rates in surrounding areas to understand the broader regional STR landscape.
| Market | Active Properties | Monthly Revenue | Daily Rate | Avg. Occupancy |
|---|---|---|---|---|
| Macastre | 13 | $2,924 | $296.93 | 42% |
| Corbera | 13 | $2,721 | $206.87 | 41% |
| Bétera | 31 | $2,711 | $222.77 | 46% |
| l'Eliana | 33 | $2,510 | $298.45 | 43% |
| San Antonio de Benagéber | 11 | $2,374 | $335.55 | 40% |
| Manises | 25 | $2,352 | $175.71 | 38% |
| Olocau | 11 | $2,245 | $308.22 | 36% |
| Alboraia / Alboraya | 272 | $2,220 | $186.05 | 49% |
| la Pobla de Vallbona | 27 | $2,163 | $193.69 | 49% |
| Riba-roja de Túria | 21 | $2,132 | $221.03 | 41% |