Chella Airbnb Market Analysis 2025: Short Term Rental Data & Vacation Rental Statistics in Valencian Community, Spain
Is Airbnb profitable in Chella in 2025? Explore comprehensive Airbnb analytics for Chella, Valencian Community, Spain to uncover income potential. This 2025 STR market report for Chella, based on AirROI data from April 2024 to March 2025, reveals key trends in the niche market of 22 active listings.
Whether you're considering an Airbnb investment in Chella, optimizing your existing vacation rental, or exploring rental arbitrage opportunities, understanding the Chella Airbnb data is crucial. Understanding the local regulations is key to maximizing your short term rental income potential. Let's dive into the specifics.
Key Chella Airbnb Performance Metrics Overview
Monthly Airbnb Revenue Variations & Income Potential in Chella (2025)
Understanding the monthly revenue variations for Airbnb listings in Chella is key to maximizing your short term rental income potential. Seasonality significantly impacts earnings. Our analysis, based on data from the past 12 months, shows that the peak revenue month for STRs in Chella is typically August, while January often presents the lowest earnings, highlighting opportunities for strategic pricing adjustments during shoulder and low seasons. Explore the typical Airbnb income in Chella across different performance tiers:
- Best-in-class properties (Top 10%) achieve $3,678+ monthly, often utilizing dynamic pricing and superior guest experiences.
- Strong performing properties (Top 25%) earn $2,342 or more, indicating effective management and desirable locations/amenities.
- Typical properties (Median) generate around $1,423 per month, representing the average market performance.
- Entry-level properties (Bottom 25%) see earnings around $755, often with potential for optimization.
Average Monthly Airbnb Earnings Trend in Chella
Chella Airbnb Occupancy Rate Trends (2025)
Maximize your bookings by understanding the Chella STR occupancy trends. Seasonal demand shifts significantly influence how often properties are booked. Typically, Augustsees the highest demand (peak season occupancy), while February experiences the lowest (low season). Effective strategies, like adjusting minimum stays or offering promotions, can boost occupancy during slower periods. Here's how different property tiers perform in Chella:
- Best-in-class properties (Top 10%) achieve 52%+ occupancy, indicating high desirability and potentially optimized availability.
- Strong performing properties (Top 25%) maintain 39% or higher occupancy, suggesting good market fit and guest satisfaction.
- Typical properties (Median) have an occupancy rate around 26%.
- Entry-level properties (Bottom 25%) average 12% occupancy, potentially facing higher vacancy.
Average Monthly Occupancy Rate Trend in Chella
Average Daily Rate (ADR) Airbnb Trends in Chella (2025)
Effective short term rental pricing strategy in Chella involves understanding monthly ADR fluctuations. The Average Daily Rate (ADR) for Airbnb in Chella typically peaks in January and dips lowest during November. Leveraging Airbnb dynamic pricing tools or strategies based on this seasonality can significantly boost revenue. Here's a look at the typical nightly rates achieved:
- Best-in-class properties (Top 10%) command rates of $478+ per night, often due to premium features or locations.
- Strong performing properties (Top 25%) achieve nightly rates of $330 or more.
- Typical properties (Median) charge around $157 per night.
- Entry-level properties (Bottom 25%) earn around $94 per night.
Average Daily Rate (ADR) Trend by Month in Chella
Get Live Chella Market Intelligence 👇

Explore Real-time Analytics
Airbnb Seasonality Analysis & Trends in Chella (2025)
Peak Season (August, July, December)
- Revenue averages $2,851 per month
- Occupancy rates average 46.4%
- Daily rates average $247
Shoulder Season
- Revenue averages $2,012 per month
- Occupancy maintains around 23.7%
- Daily rates hold near $249
Low Season (January, March, October)
- Revenue drops to average $1,070 per month
- Occupancy decreases to average 18.4%
- Daily rates adjust to average $261
Seasonality Insights for Chella
- The Airbnb seasonality in Chella shows highly seasonal trends requiring careful strategy. While the sections above show seasonal averages, it's also insightful to look at the extremes:
- During the high season, the absolute peak month showcases Chella's highest earning potential, with monthly revenues capable of climbing to $3,663, occupancy reaching a high of 68.7%, and ADRs peaking at $312.
- Conversely, the slowest single month of the year, typically falling within the low season, marks the market's lowest point. In this month, revenue might dip to $828, occupancy could drop to 12.3%, and ADRs may adjust down to $222.
- Understanding both the seasonal averages and these monthly peaks and troughs in revenue, occupancy, and ADR is crucial for maximizing your Airbnb profit potential in Chella.
Seasonal Strategies for Maximizing Profit
- Peak Season: Maximize revenue through premium pricing and potentially longer minimum stays. Ensure high availability.
- Low Season: Offer competitive pricing, special promotions (e.g., extended stay discounts), and flexible cancellation policies. Target off-season travelers like remote workers or budget-conscious guests.
- Shoulder Seasons: Implement dynamic pricing that balances peak and low rates. Target weekend travelers or specific events. Offer slightly more flexible terms than peak season.
- Regularly analyze your own performance against these Chella seasonality benchmarks and adjust your pricing and availability strategy accordingly.
Best Areas for Airbnb Investment in Chella (2025)
Exploring the top neighborhoods for short-term rentals in Chella? This section highlights key areas, outlining why they are attractive for hosts and guests, along with notable local attractions. Consider these locations based on your target guest profile and investment strategy.
| Neighborhood / Area | Why Host Here? (Target Guests & Appeal) | Key Attractions & Landmarks |
|---|---|---|
| Chella Town Center | The historical heart of Chella, featuring traditional Spanish architecture and local culture. It's a vibrant area that attracts visitors interested in exploring the local lifestyle and cuisine. | Church of Chella, Local markets, Traditional tapas bars, Cultural festivals, Plaza Mayor |
| Chella Natural Park | A scenic area with beautiful landscapes and outdoor activities such as hiking and nature walks. Perfect for guests looking to escape the city and enjoy nature. | Natural Park trails, Birdwatching, Picnic areas, Scenic viewpoints, Flora and fauna observation |
| Chella Castle Hill | Offering historic ruins with panoramic views of the surrounding landscape. A great spot for history enthusiasts and photographers. | Chella Castle ruins, Walking trails, Breathtaking sunset views, Historical significance, Local folklore |
| Chella Vineyard Region | Famous for local wine production, this area attracts wine lovers and foodies interested in wine tastings and tours. | Vineyard tours, Wine tasting events, Local wineries, Gastronomic experiences, Cultural heritage |
| Chella Cultural District | An area rich in art and local culture, showcasing Chella's artistic side along with workshops and artisan shops. | Artisan markets, Cultural workshops, Local artists' studios, Traditional craft demonstrations, Festivals |
| Around La Cueva | Close to La Cueva, known for its beautiful caves and nature, providing unique geological experiences for curious travelers. | La Cueva, Guided cave tours, Photography spots, Stargazing, Natural wonders |
| Nearby Alzira | Situated near Alzira, providing easy access to a larger city with urban amenities and attractions while maintaining a small-town charm. | Alzira Historic Center, Shopping centers, Cultural events, Local restaurants, Parks and recreational areas |
| Outdoor Activities Hub | Chella is an excellent base for various outdoor activities, attracting adventurers and sports enthusiasts. | Hiking and biking trails, Adventure sports, Horse riding, Camping spots, Nature excursions |
Understanding Airbnb License Requirements & STR Laws in Chella (2025)
With 27% of listings showing registration in 2025, understanding potential Airbnb license requirements is crucial in Chella. Always verify the latest short term rental regulations and Airbnb license requirements directly with local government authorities for Chella to ensure full compliance before hosting.
(Source: AirROI data, 2025, based on 27% licensed listings)
Top Performing Airbnb Properties in Chella (2025)
Benchmark your potential! Explore examples of top-performing Airbnb properties in Chellabased on Trailing Twelve Month (TTM) revenue. Analyze their characteristics, revenue, occupancy rate, and ADR to understand what drives success in this market.
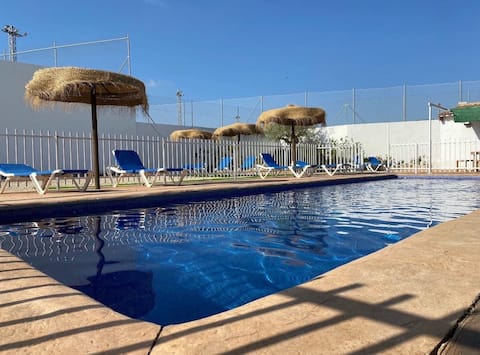
Villa - Casa Rural Frigols
Entire Place • 9 bedrooms

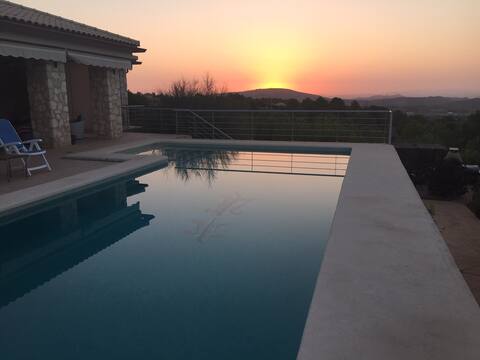
Casa Rural Sarsalet
Entire Place • 4 bedrooms
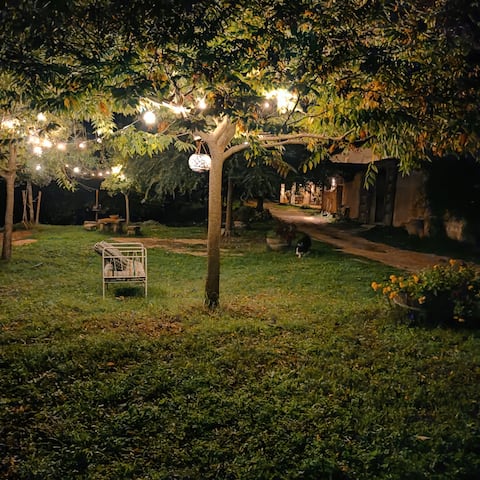
La Canyada del Linaco. Masia in the middle of nature.
Entire Place • 7 bedrooms
A haven of peace in the middle of nature
Entire Place • 4 bedrooms
El Calderon House
Entire Place • 3 bedrooms
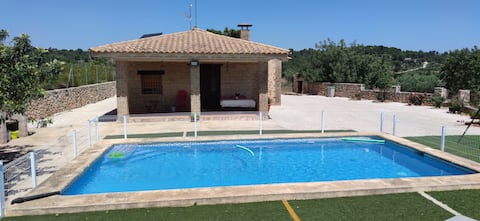
Casa de Campo FAYGON
Entire Place • 2 bedrooms
Note: Performance varies based on location, size, amenities, seasonality, and management quality. Data reflects the past 12 months.
Top Performing Airbnb Hosts in Chella (2025)
Learn from the best! This table showcases top-performing Airbnb hosts in Chella based on the number of properties managed and estimated total revenue over the past year. Analyze their scale and performance metrics.
| Host Name | Properties | Grossing Revenue | Stay Reviews | Avg Rating |
|---|---|---|---|---|
| Host #492238921 | 1 | $67,342 | 1 | 0.00/5.0 |
| Gabriel | 4 | $53,516 | 102 | 4.82/5.0 |
| Carol | 1 | $31,312 | 11 | 4.82/5.0 |
| Vlada | 1 | $26,082 | 11 | 5.00/5.0 |
| Vicenta | 1 | $24,672 | 45 | 4.80/5.0 |
| Jos | 2 | $18,497 | 9 | 2.33/5.0 |
| Carlos | 1 | $18,077 | 23 | 4.87/5.0 |
| Sophie | 1 | $17,574 | 26 | 4.81/5.0 |
| Aldert | 1 | $16,287 | 97 | 4.97/5.0 |
| Bienvenido | 1 | $16,191 | 78 | 4.91/5.0 |
Analyzing the strategies of top hosts, such as their property selection, pricing, and guest communication, can offer valuable lessons for optimizing your own Airbnb operations in Chella.
Dive Deeper: Advanced Chella STR Market Data (2025)
Ready to unlock more insights? AirROI provides access to advanced metrics and comprehensive Airbnb data for Chella. Explore detailed analytics beyond this report to refine your investment strategy, optimize pricing, and maximize your vacation rental profits.
Explore Advanced MetricsChella Short-Term Rental Market Composition (2025): Property & Room Types
Room Type Distribution
Property Type Distribution
Market Composition Insights for Chella
- The Chella Airbnb market composition is heavily skewed towards Entire Home/Apt listings, which make up 86.4% of the 22 active rentals. This indicates strong guest preference for privacy and space.
- Looking at the property type distribution in Chella, House properties are the most common (90.9%), reflecting the local real estate landscape.
- Houses represent a significant 90.9% portion, catering likely to families or larger groups.
- Smaller segments like apartment/condo, hotel/boutique (combined 9.0%) offer potential for unique stay experiences.
Chella Airbnb Room Capacity Analysis (2025): Bedroom Distribution
Distribution of Listings by Number of Bedrooms
Room Capacity Insights for Chella
- The dominant room capacity in Chella is 2 bedrooms listings, making up 27.3% of the market. This suggests a strong demand for properties suitable for couples or solo travelers.
- Together, 2 bedrooms and 3 bedrooms properties represent 50.0% of the active Airbnb listings in Chella, indicating a high concentration in these sizes.
- A significant 63.6% of listings offer 3+ bedrooms, catering to larger groups and families seeking more space in Chella.
Chella Vacation Rental Guest Capacity Trends (2025)
Distribution of Listings by Guest Capacity
Guest Capacity Insights for Chella
- The most common guest capacity trend in Chella vacation rentals is listings accommodating 8+ guests (50%). This suggests the primary traveler segment is likely larger groups.
- Properties designed for 8+ guests and 6 guests dominate the Chella STR market, accounting for 72.7% of listings.
- 72.7% of properties accommodate 6+ guests, serving the market segment for larger families or group travel in Chella.
- On average, properties in Chella are equipped to host 6.0 guests.
Chella Airbnb Booking Patterns (2025): Available vs. Booked Days
Available Days Distribution
Booked Days Distribution
Booking Pattern Insights for Chella
- The most common availability pattern in Chella falls within the 271-366 days range, representing 72.7% of listings. This suggests many properties have significant open periods on their calendars.
- Approximately 90.9% of listings show high availability (181+ days open annually), indicating potential for increased bookings or specific owner usage patterns.
- For booked days, the 31-90 days range is most frequent in Chella (50%), reflecting common guest stay durations or potential owner blocking patterns.
- A notable 13.6% of properties secure long booking periods (181+ days booked per year), highlighting successful long-term rental strategies or significant owner usage.
Chella Airbnb Minimum Stay Requirements Analysis
Distribution of Listings by Minimum Night Requirement
1 Night
2 listings
10.5% of total
2 Nights
13 listings
68.4% of total
4-6 Nights
1 listings
5.3% of total
30+ Nights
3 listings
15.8% of total
Key Insights
- The most prevalent minimum stay requirement in Chella is 2 Nights, adopted by 68.4% of listings. This highlights the market's preference for shorter, flexible bookings.
- A strong majority (78.9%) of the Chella Airbnb data shows acceptance of very short stays (1-2 nights), indicating a dynamic, high-turnover market.
- A significant segment (15.8%) caters to monthly stays (30+ nights) in Chella, pointing to opportunities in the extended-stay market.
Recommendations
- Align with the market by considering a 2 Nights minimum stay, as 68.4% of Chella hosts use this setting.
- If feasible, allowing 1-night stays, especially midweek or during low season, could capture last-minute bookings, as only 10.5% currently do.
- A 2-night minimum appears standard (68.4%). Consider this for weekends or peak periods.
- Explore offering discounts for stays of 30+ nights to attract the 15.8% of the market seeking extended stays.
- Adjust minimum nights based on seasonality – potentially shorter during low season and longer during peak demand periods in Chella.
Chella Airbnb Cancellation Policy Trends Analysis (2025)
Flexible
7 listings
36.8% of total
Moderate
4 listings
21.1% of total
Firm
2 listings
10.5% of total
Strict
6 listings
31.6% of total
Cancellation Policy Insights for Chella
- The prevailing Airbnb cancellation policy trend in Chella is Flexible, used by 36.8% of listings.
- There's a relatively balanced mix between guest-friendly (57.9%) and stricter (42.1%) policies, offering choices for different guest needs.
Recommendations for Hosts
- Consider adopting a Flexible policy to align with the 36.8% market standard in Chella.
- With 31.6% using Strict terms, this is a viable option in Chella, particularly for high-value properties or during peak demand periods.
- Regularly review your cancellation policy against competitors and market demand shifts in Chella.
Chella STR Booking Lead Time Analysis (2025)
Average Booking Lead Time by Month
Booking Lead Time Insights for Chella
- The overall average booking lead time for vacation rentals in Chella is 70 days.
- Guests book furthest in advance for stays during November (average 107 days), likely coinciding with peak travel demand or local events.
- The shortest booking windows occur for stays in September (average 41 days), indicating more last-minute travel plans during this time.
- Seasonally, Winter (83 days avg.) sees the longest lead times, while Spring (66 days avg.) has the shortest, reflecting typical travel planning cycles.
Recommendations for Hosts
- Use the overall average lead time (70 days) as a baseline for your pricing and availability strategy in Chella.
- For November stays, consider implementing length-of-stay discounts or slightly higher rates for bookings made less than 107 days out to capitalize on advance planning.
- Target marketing efforts for the Winter season well in advance (at least 83 days) to capture early planners.
- Monitor your own booking lead times against these Chella averages to identify opportunities for dynamic pricing adjustments.
Popular & Essential Airbnb Amenities in Chella (2025)
Amenity Prevalence
Amenity Insights for Chella
- Essential amenities in Chella that guests expect include: Kitchen, Hot water, Wifi. Lacking these (any) could significantly impact bookings.
- Popular amenities like Dishes and silverware, Refrigerator, Hangers are common but not universal. Offering these can provide a competitive edge.
Recommendations for Hosts
- Ensure your listing includes all essential amenities for Chella: Kitchen, Hot water, Wifi.
- Prioritize adding missing essentials: Kitchen, Hot water, Wifi.
- Consider adding popular differentiators like Dishes and silverware or Refrigerator to increase appeal.
- Highlight unique or less common amenities you offer (e.g., hot tub, dedicated workspace, EV charger) in your listing description and photos.
- Regularly check competitor amenities in Chella to stay competitive.
Chella Airbnb Guest Demographics & Profile Analysis (2025)
Guest Profile Summary for Chella
- The typical guest profile for Airbnb in Chella consists of a mix of domestic (57%) and international guests, often arriving from nearby Valencia, typically belonging to the Post-2000s (Gen Z/Alpha) group (50%), primarily speaking English or Spanish.
- Domestic travelers account for 56.6% of guests.
- Key international markets include Spain (56.6%) and Netherlands (11.1%).
- Top languages spoken are English (31%) followed by Spanish (30%).
- A significant demographic segment is the Post-2000s (Gen Z/Alpha) group, representing 50% of guests.
Recommendations for Hosts
- Balance marketing efforts between domestic and international channels based on the guest mix.
- Tailor amenities and listing descriptions to appeal to the dominant Post-2000s (Gen Z/Alpha) demographic (e.g., highlight fast WiFi, smart home features, local guides).
- Highlight unique local experiences or amenities relevant to the primary guest profile.
- Consider seasonal promotions aligned with peak travel times for key origin markets.
Nearby Short-Term Rental Market Comparison
How does the Chella Airbnb market stack up against its neighbors? Compare key performance metrics like average monthly revenue, ADR, and occupancy rates in surrounding areas to understand the broader regional STR landscape.
| Market | Active Properties | Monthly Revenue | Daily Rate | Avg. Occupancy |
|---|---|---|---|---|
| Macastre | 13 | $2,924 | $296.93 | 42% |
| Corbera | 13 | $2,721 | $206.87 | 41% |
| Bétera | 31 | $2,711 | $222.77 | 46% |
| l'Eliana | 33 | $2,510 | $298.45 | 43% |
| San Antonio de Benagéber | 11 | $2,374 | $335.55 | 40% |
| Manises | 25 | $2,352 | $175.71 | 38% |
| Olocau | 11 | $2,245 | $308.22 | 36% |
| Alboraia / Alboraya | 272 | $2,220 | $186.05 | 49% |
| la Pobla de Vallbona | 27 | $2,163 | $193.69 | 49% |
| Riba-roja de Túria | 21 | $2,132 | $221.03 | 41% |