Benissa Airbnb Market Analysis 2025: Short Term Rental Data & Vacation Rental Statistics in Valencian Community, Spain
Is Airbnb profitable in Benissa in 2025? Explore comprehensive Airbnb analytics for Benissa, Valencian Community, Spain to uncover income potential. This 2025 STR market report for Benissa, based on AirROI data from April 2024 to March 2025, reveals key trends in the market of 500 active listings.
Whether you're considering an Airbnb investment in Benissa, optimizing your existing vacation rental, or exploring rental arbitrage opportunities, understanding the Benissa Airbnb data is crucial. Navigating the high regulation landscape is key to maximizing your short term rental income potential. Let's dive into the specifics.
Key Benissa Airbnb Performance Metrics Overview
Monthly Airbnb Revenue Variations & Income Potential in Benissa (2025)
Understanding the monthly revenue variations for Airbnb listings in Benissa is key to maximizing your short term rental income potential. Seasonality significantly impacts earnings. Our analysis, based on data from the past 12 months, shows that the peak revenue month for STRs in Benissa is typically August, while March often presents the lowest earnings, highlighting opportunities for strategic pricing adjustments during shoulder and low seasons. Explore the typical Airbnb income in Benissa across different performance tiers:
- Best-in-class properties (Top 10%) achieve $7,044+ monthly, often utilizing dynamic pricing and superior guest experiences.
- Strong performing properties (Top 25%) earn $4,169 or more, indicating effective management and desirable locations/amenities.
- Typical properties (Median) generate around $2,137 per month, representing the average market performance.
- Entry-level properties (Bottom 25%) see earnings around $977, often with potential for optimization.
Average Monthly Airbnb Earnings Trend in Benissa
Benissa Airbnb Occupancy Rate Trends (2025)
Maximize your bookings by understanding the Benissa STR occupancy trends. Seasonal demand shifts significantly influence how often properties are booked. Typically, Augustsees the highest demand (peak season occupancy), while January experiences the lowest (low season). Effective strategies, like adjusting minimum stays or offering promotions, can boost occupancy during slower periods. Here's how different property tiers perform in Benissa:
- Best-in-class properties (Top 10%) achieve 77%+ occupancy, indicating high desirability and potentially optimized availability.
- Strong performing properties (Top 25%) maintain 54% or higher occupancy, suggesting good market fit and guest satisfaction.
- Typical properties (Median) have an occupancy rate around 31%.
- Entry-level properties (Bottom 25%) average 15% occupancy, potentially facing higher vacancy.
Average Monthly Occupancy Rate Trend in Benissa
Average Daily Rate (ADR) Airbnb Trends in Benissa (2025)
Effective short term rental pricing strategy in Benissa involves understanding monthly ADR fluctuations. The Average Daily Rate (ADR) for Airbnb in Benissa typically peaks in August and dips lowest during March. Leveraging Airbnb dynamic pricing tools or strategies based on this seasonality can significantly boost revenue. Here's a look at the typical nightly rates achieved:
- Best-in-class properties (Top 10%) command rates of $453+ per night, often due to premium features or locations.
- Strong performing properties (Top 25%) achieve nightly rates of $309 or more.
- Typical properties (Median) charge around $212 per night.
- Entry-level properties (Bottom 25%) earn around $140 per night.
Average Daily Rate (ADR) Trend by Month in Benissa
Get Live Benissa Market Intelligence 👇

Explore Real-time Analytics
Airbnb Seasonality Analysis & Trends in Benissa (2025)
Peak Season (August, July, September)
- Revenue averages $5,075 per month
- Occupancy rates average 51.5%
- Daily rates average $294
Shoulder Season
- Revenue averages $2,924 per month
- Occupancy maintains around 32.9%
- Daily rates hold near $253
Low Season (January, February, March)
- Revenue drops to average $2,087 per month
- Occupancy decreases to average 28.7%
- Daily rates adjust to average $231
Seasonality Insights for Benissa
- The Airbnb seasonality in Benissa shows highly seasonal trends requiring careful strategy. While the sections above show seasonal averages, it's also insightful to look at the extremes:
- During the high season, the absolute peak month showcases Benissa's highest earning potential, with monthly revenues capable of climbing to $6,222, occupancy reaching a high of 59.9%, and ADRs peaking at $308.
- Conversely, the slowest single month of the year, typically falling within the low season, marks the market's lowest point. In this month, revenue might dip to $2,033, occupancy could drop to 26.3%, and ADRs may adjust down to $229.
- Understanding both the seasonal averages and these monthly peaks and troughs in revenue, occupancy, and ADR is crucial for maximizing your Airbnb profit potential in Benissa.
Seasonal Strategies for Maximizing Profit
- Peak Season: Maximize revenue through premium pricing and potentially longer minimum stays. Ensure high availability.
- Low Season: Offer competitive pricing, special promotions (e.g., extended stay discounts), and flexible cancellation policies. Target off-season travelers like remote workers or budget-conscious guests.
- Shoulder Seasons: Implement dynamic pricing that balances peak and low rates. Target weekend travelers or specific events. Offer slightly more flexible terms than peak season.
- Regularly analyze your own performance against these Benissa seasonality benchmarks and adjust your pricing and availability strategy accordingly.
Best Areas for Airbnb Investment in Benissa (2025)
Exploring the top neighborhoods for short-term rentals in Benissa? This section highlights key areas, outlining why they are attractive for hosts and guests, along with notable local attractions. Consider these locations based on your target guest profile and investment strategy.
| Neighborhood / Area | Why Host Here? (Target Guests & Appeal) | Key Attractions & Landmarks |
|---|---|---|
| Centro Histórico | The historical center of Benissa boasts charming streets, cultural heritage, and local amenities. It is ideal for tourists looking to experience the authentic Spanish lifestyle. | Iglesia de Nuestra Señora de los Desamparados, Museo Evaristo Sanchis, Plaza de les Fonts, Local tapas bars, Cultural festivals |
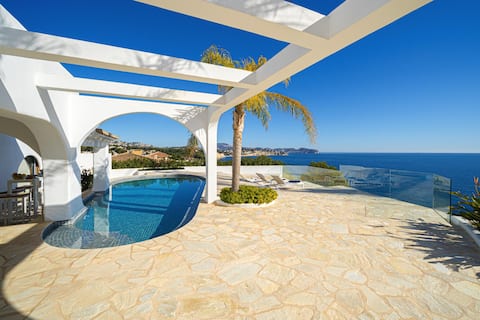
| Costa Blanca Beaches | Benissa is known for its beautiful coastline with stunning beaches. This area attracts beach lovers and families looking for sun and relaxation. | Playa de La Fustera, Playa de Les Bassetes, Cala Baladrar, Cala de la Llobella, Scuba diving and water sports |
| Montgo Natural Park | For nature enthusiasts, this area offers hiking and stunning views. Attracts travelers interested in outdoor activities and the natural beauty of the region. | Hiking trails, Natural parks, Bird watching, Picnic areas, Breathtaking vistas |
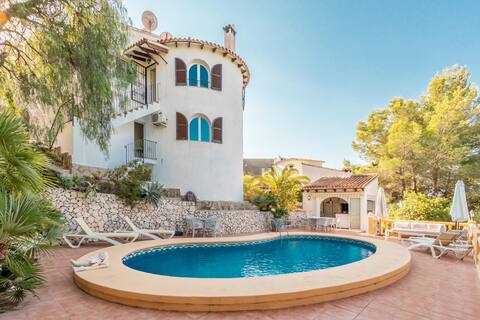
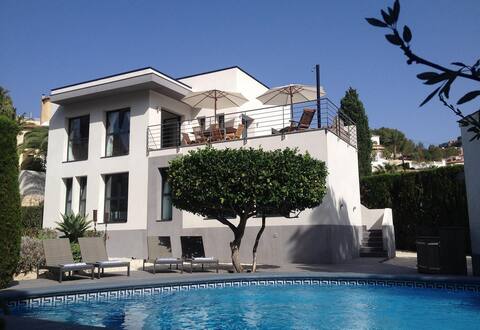
| Benissa Hills | This residential area features luxury villas and a tranquil atmosphere, appealing to those seeking upscale accommodations and privacy. | Golf courses, Private villas, Mediterranean gardens, Peaceful surroundings, Expansive views |
| Local Vineyards | Benissa is surrounded by vineyards producing regional wines. A great spot for wine lovers and culinary tourists looking for local tastings and tours. | Vineyard tours, Wine tastings, Traditional bodegas, Gastronomy experiences, Local harvest festivals |
| Calpe Beaches | Nearby Calpe offers renowned beaches and a lively atmosphere. Perfect for tourists seeking a mix of beach life and bustling nightlife. | Peñon de Ifach, Playa de la Fossa, Local seafood restaurants, Nightclubs, Water sports activities |
| Algar Waterfalls | A natural wonder just outside Benissa, the waterfalls provide a refreshing retreat. It attracts nature lovers and families seeking outdoor fun. | Hiking trails, Swimming spots, Picnic areas, Nature photography, Scenic views |
| Gastronomic Experiences | Benissa is part of the Alicante province, known for its rich culinary tradition. Ideal for foodies looking to explore regional dishes and local cuisine. | Cooking classes, Local markets, Restaurants featuring Mediterranean cuisine, Traditional food festivals, Tapas tours |
Understanding Airbnb License Requirements & STR Laws in Benissa (2025)
Yes, Benissa, Valencian Community, Spain enforces high STR regulations. Obtaining a license and ensuring compliance is almost certainly required according to current 2025 STR laws. Always verify the latest short term rental regulations and Airbnb license requirements directly with local government authorities for Benissa to ensure full compliance before hosting.
(Source: AirROI data, 2025, based on 44% licensed listings)
Top Performing Airbnb Properties in Benissa (2025)
Benchmark your potential! Explore examples of top-performing Airbnb properties in Benissabased on Trailing Twelve Month (TTM) revenue. Analyze their characteristics, revenue, occupancy rate, and ADR to understand what drives success in this market.

Perla del Mar Calpe
Entire Place • 5 bedrooms
El Refugio - Quite and Spacious
Entire Place • 5 bedrooms

LUXURY VILLA - By Almarina Villas
Entire Place • 7 bedrooms
Villa Lynn in Benissa next to Mora
Entire Place • 4 bedrooms

CostaBlancaDreams - Casa Monte Verde in Benissa
Entire Place • 4 bedrooms
VERTIGO- Managed by Almarina Villas
Entire Place • 5 bedrooms
Note: Performance varies based on location, size, amenities, seasonality, and management quality. Data reflects the past 12 months.
Top Performing Airbnb Hosts in Benissa (2025)
Learn from the best! This table showcases top-performing Airbnb hosts in Benissa based on the number of properties managed and estimated total revenue over the past year. Analyze their scale and performance metrics.
| Host Name | Properties | Grossing Revenue | Stay Reviews | Avg Rating |
|---|---|---|---|---|
| Almarina | 9 | $885,980 | 243 | 4.88/5.0 |
| Loraine | 18 | $763,183 | 139 | 3.76/5.0 |
| Villas Holidays Costablanca | 22 | $474,418 | 160 | 3.28/5.0 |
| Plusholidays | 20 | $452,793 | 141 | 3.73/5.0 |
| Abahana Villas | 28 | $438,975 | 100 | 2.55/5.0 |
| Villas Guzman | 24 | $425,365 | 141 | 2.62/5.0 |
| Ramira | 41 | $399,756 | 222 | 3.35/5.0 |
| Holidu | 2 | $270,328 | 22 | 2.46/5.0 |
| Host #187050772 | 2 | $245,258 | 0 | 0.00/5.0 |
| Abahana Luxe | 5 | $244,766 | 5 | 1.00/5.0 |
Analyzing the strategies of top hosts, such as their property selection, pricing, and guest communication, can offer valuable lessons for optimizing your own Airbnb operations in Benissa.
Dive Deeper: Advanced Benissa STR Market Data (2025)
Ready to unlock more insights? AirROI provides access to advanced metrics and comprehensive Airbnb data for Benissa. Explore detailed analytics beyond this report to refine your investment strategy, optimize pricing, and maximize your vacation rental profits.
Explore Advanced MetricsBenissa Short-Term Rental Market Composition (2025): Property & Room Types
Room Type Distribution
Property Type Distribution
Market Composition Insights for Benissa
- The Benissa Airbnb market composition is heavily skewed towards Entire Home/Apt listings, which make up 95.8% of the 500 active rentals. This indicates strong guest preference for privacy and space.
- Looking at the property type distribution in Benissa, House properties are the most common (84%), reflecting the local real estate landscape.
- Houses represent a significant 84% portion, catering likely to families or larger groups.
- Smaller segments like hotel/boutique, others, outdoor/unique (combined 5.4%) offer potential for unique stay experiences.
Benissa Airbnb Room Capacity Analysis (2025): Bedroom Distribution
Distribution of Listings by Number of Bedrooms
Room Capacity Insights for Benissa
- The dominant room capacity in Benissa is 3 bedrooms listings, making up 29.6% of the market. This suggests a strong demand for properties suitable for families or small groups.
- Together, 3 bedrooms and 4 bedrooms properties represent 53.2% of the active Airbnb listings in Benissa, indicating a high concentration in these sizes.
- A significant 71.6% of listings offer 3+ bedrooms, catering to larger groups and families seeking more space in Benissa.
Benissa Vacation Rental Guest Capacity Trends (2025)
Distribution of Listings by Guest Capacity
Guest Capacity Insights for Benissa
- The most common guest capacity trend in Benissa vacation rentals is listings accommodating 8+ guests (41.8%). This suggests the primary traveler segment is likely larger groups.
- Properties designed for 8+ guests and 6 guests dominate the Benissa STR market, accounting for 68.6% of listings.
- 71.2% of properties accommodate 6+ guests, serving the market segment for larger families or group travel in Benissa.
- On average, properties in Benissa are equipped to host 6.1 guests.
Benissa Airbnb Booking Patterns (2025): Available vs. Booked Days
Available Days Distribution
Booked Days Distribution
Booking Pattern Insights for Benissa
- The most common availability pattern in Benissa falls within the 271-366 days range, representing 67.4% of listings. This suggests many properties have significant open periods on their calendars.
- Approximately 91.0% of listings show high availability (181+ days open annually), indicating potential for increased bookings or specific owner usage patterns.
- For booked days, the 31-90 days range is most frequent in Benissa (37%), reflecting common guest stay durations or potential owner blocking patterns.
- A notable 9.8% of properties secure long booking periods (181+ days booked per year), highlighting successful long-term rental strategies or significant owner usage.
Benissa Airbnb Minimum Stay Requirements Analysis
Distribution of Listings by Minimum Night Requirement
1 Night
48 listings
10.7% of total
2 Nights
33 listings
7.3% of total
3 Nights
42 listings
9.4% of total
4-6 Nights
186 listings
41.4% of total
7-29 Nights
80 listings
17.8% of total
30+ Nights
60 listings
13.4% of total
Key Insights
- The most prevalent minimum stay requirement in Benissa is 4-6 Nights, adopted by 41.4% of listings. This highlights the market's preference for longer commitments.
- Very short stays (1-2 nights) are less common (18.0%), suggesting hosts prefer slightly longer bookings to optimize turnover.
- A significant segment (13.4%) caters to monthly stays (30+ nights) in Benissa, pointing to opportunities in the extended-stay market.
Recommendations
- Align with the market by considering a 4-6 Nights minimum stay, as 41.4% of Benissa hosts use this setting.
- If feasible, allowing 1-night stays, especially midweek or during low season, could capture last-minute bookings, as only 10.7% currently do.
- Explore offering discounts for stays of 30+ nights to attract the 13.4% of the market seeking extended stays.
- Adjust minimum nights based on seasonality – potentially shorter during low season and longer during peak demand periods in Benissa.
Benissa Airbnb Cancellation Policy Trends Analysis (2025)
Super Strict 60 Days
60 listings
16.2% of total
Super Strict 30 Days
33 listings
8.9% of total
Flexible
33 listings
8.9% of total
Moderate
57 listings
15.4% of total
Firm
96 listings
25.9% of total
Strict
91 listings
24.6% of total
Cancellation Policy Insights for Benissa
- The prevailing Airbnb cancellation policy trend in Benissa is Firm, used by 25.9% of listings.
- A majority (50.5%) of hosts in Benissa utilize Firm or Strict policies, indicating a market where hosts prioritize booking security.
Recommendations for Hosts
- Consider adopting a Firm policy to align with the 25.9% market standard in Benissa.
- Regularly review your cancellation policy against competitors and market demand shifts in Benissa.
Benissa STR Booking Lead Time Analysis (2025)
Average Booking Lead Time by Month
Booking Lead Time Insights for Benissa
- The overall average booking lead time for vacation rentals in Benissa is 82 days.
- Guests book furthest in advance for stays during May (average 111 days), likely coinciding with peak travel demand or local events.
- The shortest booking windows occur for stays in March (average 59 days), indicating more last-minute travel plans during this time.
- Seasonally, Summer (103 days avg.) sees the longest lead times, while Winter (67 days avg.) has the shortest, reflecting typical travel planning cycles.
Recommendations for Hosts
- Use the overall average lead time (82 days) as a baseline for your pricing and availability strategy in Benissa.
- For May stays, consider implementing length-of-stay discounts or slightly higher rates for bookings made less than 111 days out to capitalize on advance planning.
- Target marketing efforts for the Summer season well in advance (at least 103 days) to capture early planners.
- Monitor your own booking lead times against these Benissa averages to identify opportunities for dynamic pricing adjustments.
Popular & Essential Airbnb Amenities in Benissa (2025)
Amenity Prevalence
Amenity Insights for Benissa
- Essential amenities in Benissa that guests expect include: Kitchen, TV, Wifi, Washer. Lacking these (any) could significantly impact bookings.
- Popular amenities like Pool, Air conditioning, Coffee maker are common but not universal. Offering these can provide a competitive edge.
- A pool is a highly desired but not standard amenity, making it a key feature for attracting guests seeking leisure in Benissa.
Recommendations for Hosts
- Ensure your listing includes all essential amenities for Benissa: Kitchen, TV, Wifi, Washer.
- Prioritize adding missing essentials: Kitchen, TV, Wifi, Washer.
- Consider adding popular differentiators like Pool or Air conditioning to increase appeal.
- Highlight unique or less common amenities you offer (e.g., hot tub, dedicated workspace, EV charger) in your listing description and photos.
- Regularly check competitor amenities in Benissa to stay competitive.
Benissa Airbnb Guest Demographics & Profile Analysis (2025)
Guest Profile Summary for Benissa
- The typical guest profile for Airbnb in Benissa consists of a mix of domestic (37%) and international guests, with top international origins including United Kingdom, typically belonging to the Post-2000s (Gen Z/Alpha) group (50%), primarily speaking English or Spanish.
- Domestic travelers account for 36.7% of guests.
- Key international markets include Spain (36.7%) and United Kingdom (15.1%).
- Top languages spoken are English (36%) followed by Spanish (22.3%).
- A significant demographic segment is the Post-2000s (Gen Z/Alpha) group, representing 50% of guests.
Recommendations for Hosts
- Focus marketing internationally, particularly towards travelers from United Kingdom.
- Tailor amenities and listing descriptions to appeal to the dominant Post-2000s (Gen Z/Alpha) demographic (e.g., highlight fast WiFi, smart home features, local guides).
- Highlight unique local experiences or amenities relevant to the primary guest profile.
- Consider seasonal promotions aligned with peak travel times for key origin markets.
Nearby Short-Term Rental Market Comparison
How does the Benissa Airbnb market stack up against its neighbors? Compare key performance metrics like average monthly revenue, ADR, and occupancy rates in surrounding areas to understand the broader regional STR landscape.
| Market | Active Properties | Monthly Revenue | Daily Rate | Avg. Occupancy |
|---|---|---|---|---|
| sa Carroca | 98 | $10,551 | $862.81 | 52% |
| Can Germà | 25 | $9,819 | $927.22 | 47% |
| Can Tomàs | 26 | $9,321 | $878.17 | 47% |
| Es Cubells | 31 | $8,883 | $1002.54 | 54% |
| Sant Rafel de sa Creu | 46 | $7,518 | $730.00 | 45% |
| Vista Mar | 64 | $7,047 | $750.94 | 46% |
| Vista Alegre | 18 | $6,413 | $1214.28 | 42% |
| Sant Josep de sa Talaia | 256 | $6,308 | $699.24 | 48% |
| Cala Carbó | 18 | $6,303 | $901.65 | 37% |
| Sant Jordi de ses Salines | 74 | $5,337 | $527.40 | 49% |