Bellreguard Airbnb Market Analysis 2025: Short Term Rental Data & Vacation Rental Statistics in Valencian Community, Spain
Is Airbnb profitable in Bellreguard in 2025? Explore comprehensive Airbnb analytics for Bellreguard, Valencian Community, Spain to uncover income potential. This 2025 STR market report for Bellreguard, based on AirROI data from April 2024 to March 2025, reveals key trends in the niche market of 51 active listings.
Whether you're considering an Airbnb investment in Bellreguard, optimizing your existing vacation rental, or exploring rental arbitrage opportunities, understanding the Bellreguard Airbnb data is crucial. Understanding the local regulations is key to maximizing your short term rental income potential. Let's dive into the specifics.
Key Bellreguard Airbnb Performance Metrics Overview
Monthly Airbnb Revenue Variations & Income Potential in Bellreguard (2025)
Understanding the monthly revenue variations for Airbnb listings in Bellreguard is key to maximizing your short term rental income potential. Seasonality significantly impacts earnings. Our analysis, based on data from the past 12 months, shows that the peak revenue month for STRs in Bellreguard is typically August, while February often presents the lowest earnings, highlighting opportunities for strategic pricing adjustments during shoulder and low seasons. Explore the typical Airbnb income in Bellreguard across different performance tiers:
- Best-in-class properties (Top 10%) achieve $2,956+ monthly, often utilizing dynamic pricing and superior guest experiences.
- Strong performing properties (Top 25%) earn $2,148 or more, indicating effective management and desirable locations/amenities.
- Typical properties (Median) generate around $1,387 per month, representing the average market performance.
- Entry-level properties (Bottom 25%) see earnings around $708, often with potential for optimization.
Average Monthly Airbnb Earnings Trend in Bellreguard
Bellreguard Airbnb Occupancy Rate Trends (2025)
Maximize your bookings by understanding the Bellreguard STR occupancy trends. Seasonal demand shifts significantly influence how often properties are booked. Typically, Augustsees the highest demand (peak season occupancy), while January experiences the lowest (low season). Effective strategies, like adjusting minimum stays or offering promotions, can boost occupancy during slower periods. Here's how different property tiers perform in Bellreguard:
- Best-in-class properties (Top 10%) achieve 81%+ occupancy, indicating high desirability and potentially optimized availability.
- Strong performing properties (Top 25%) maintain 59% or higher occupancy, suggesting good market fit and guest satisfaction.
- Typical properties (Median) have an occupancy rate around 37%.
- Entry-level properties (Bottom 25%) average 21% occupancy, potentially facing higher vacancy.
Average Monthly Occupancy Rate Trend in Bellreguard
Average Daily Rate (ADR) Airbnb Trends in Bellreguard (2025)
Effective short term rental pricing strategy in Bellreguard involves understanding monthly ADR fluctuations. The Average Daily Rate (ADR) for Airbnb in Bellreguard typically peaks in August and dips lowest during March. Leveraging Airbnb dynamic pricing tools or strategies based on this seasonality can significantly boost revenue. Here's a look at the typical nightly rates achieved:
- Best-in-class properties (Top 10%) command rates of $139+ per night, often due to premium features or locations.
- Strong performing properties (Top 25%) achieve nightly rates of $113 or more.
- Typical properties (Median) charge around $91 per night.
- Entry-level properties (Bottom 25%) earn around $71 per night.
Average Daily Rate (ADR) Trend by Month in Bellreguard
Get Live Bellreguard Market Intelligence 👇

Explore Real-time Analytics
Airbnb Seasonality Analysis & Trends in Bellreguard (2025)
Peak Season (August, July, April)
- Revenue averages $2,835 per month
- Occupancy rates average 59.7%
- Daily rates average $117
Shoulder Season
- Revenue averages $1,511 per month
- Occupancy maintains around 38.3%
- Daily rates hold near $103
Low Season (January, February, March)
- Revenue drops to average $661 per month
- Occupancy decreases to average 27.5%
- Daily rates adjust to average $86
Seasonality Insights for Bellreguard
- The Airbnb seasonality in Bellreguard shows highly seasonal trends requiring careful strategy. While the sections above show seasonal averages, it's also insightful to look at the extremes:
- During the high season, the absolute peak month showcases Bellreguard's highest earning potential, with monthly revenues capable of climbing to $3,500, occupancy reaching a high of 78.9%, and ADRs peaking at $122.
- Conversely, the slowest single month of the year, typically falling within the low season, marks the market's lowest point. In this month, revenue might dip to $624, occupancy could drop to 22.8%, and ADRs may adjust down to $84.
- Understanding both the seasonal averages and these monthly peaks and troughs in revenue, occupancy, and ADR is crucial for maximizing your Airbnb profit potential in Bellreguard.
Seasonal Strategies for Maximizing Profit
- Peak Season: Maximize revenue through premium pricing and potentially longer minimum stays. Ensure high availability.
- Low Season: Offer competitive pricing, special promotions (e.g., extended stay discounts), and flexible cancellation policies. Target off-season travelers like remote workers or budget-conscious guests.
- Shoulder Seasons: Implement dynamic pricing that balances peak and low rates. Target weekend travelers or specific events. Offer slightly more flexible terms than peak season.
- Regularly analyze your own performance against these Bellreguard seasonality benchmarks and adjust your pricing and availability strategy accordingly.
Best Areas for Airbnb Investment in Bellreguard (2025)
Exploring the top neighborhoods for short-term rentals in Bellreguard? This section highlights key areas, outlining why they are attractive for hosts and guests, along with notable local attractions. Consider these locations based on your target guest profile and investment strategy.
| Neighborhood / Area | Why Host Here? (Target Guests & Appeal) | Key Attractions & Landmarks |
|---|---|---|
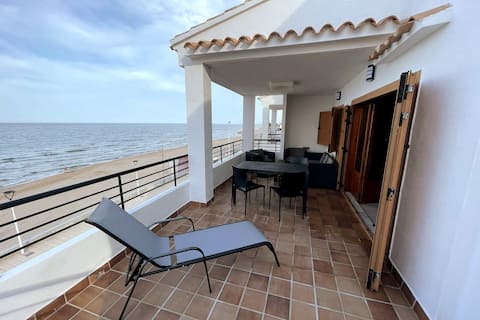
| Playa de Bellreguard | Stunning beach area known for its golden sands and warm Mediterranean waters. Popular among families and vacationers looking for a relaxing seaside getaway. | Bellreguard Beach, Water sports activities, Sunbathing, Local seafood restaurants, Beach bars |
| Town Center | The heart of Bellreguard, featuring charming streets, local shops, and traditional cafes. Ideal for tourists wanting an authentic cultural immersion. | Parish Church of Bellreguard, Local markets, Nearby parks, Cultural festivals, Traditional Spanish cuisine restaurants |
| Gandia | Nearby coastal city offering vibrant nightlife, rich history, and beautiful beaches. Attracts a diverse crowd looking for entertainment and cultural activities. | Gandia Beach, Gandia Marina, Palace of the Ducal House of Gandía, Historic city center, Local tapas bars |
| Oliva | A neighboring town with beautiful beaches and a relaxed atmosphere. Great for those seeking tranquility and natural beauty. | Oliva Beach, Las Dunas de Oliva, Cultural heritage sites, Gastronomic fairs, Hiking trails |
| Natural Park of Marjal de Gandía | Nature reserve known for its rich biodiversity and beauty. Appeals to eco-tourists and nature lovers. | Bird watching, Walking trails, Scenic views, Cycling paths, Natural landscapes |
| Carrer de les Valls | Charming local street with unique boutiques and eateries, perfect for tourists wanting to explore local culture. | Local artisan shops, Family-run restaurants, Traditional fiestas, Community events, Art displays |
| Marjal Beach | A less crowded beach area that offers a peaceful environment for relaxation, making it ideal for vacation rentals. | Quiet beach areas, Picnic spots, Beachfront promenades, Natural landscapes, Sunrise views |
| Cultural Festivals Venues | Various locations in Bellreguard host cultural festivals throughout the year, attracting visitors for celebrations and events. | Local festivals, Concerts, Cultural exhibitions, Food fairs, Art displays |
Understanding Airbnb License Requirements & STR Laws in Bellreguard (2025)
With 20% of listings showing registration in 2025, understanding potential Airbnb license requirements is crucial in Bellreguard. Always verify the latest short term rental regulations and Airbnb license requirements directly with local government authorities for Bellreguard to ensure full compliance before hosting.
(Source: AirROI data, 2025, based on 20% licensed listings)
Top Performing Airbnb Properties in Bellreguard (2025)
Benchmark your potential! Explore examples of top-performing Airbnb properties in Bellreguardbased on Trailing Twelve Month (TTM) revenue. Analyze their characteristics, revenue, occupancy rate, and ADR to understand what drives success in this market.
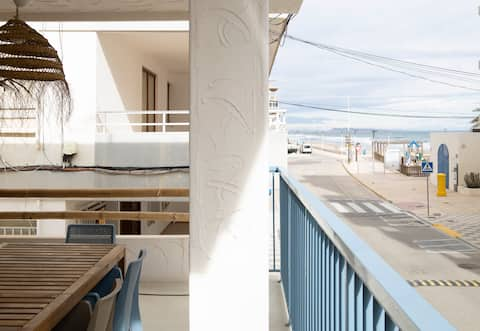
Bellreguard beachfront
Entire Place • 2 bedrooms
Bellreguard
Entire Place • 4 bedrooms

Magical sunrises
Entire Place • 3 bedrooms
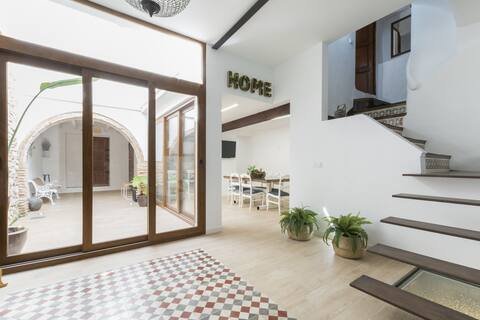
New great apartment
Entire Place • 4 bedrooms

Apartment Maria Benlliure
Entire Place • 3 bedrooms

Apartment with terrace facing the sea Mr. 31A
Entire Place • 2 bedrooms
Note: Performance varies based on location, size, amenities, seasonality, and management quality. Data reflects the past 12 months.
Top Performing Airbnb Hosts in Bellreguard (2025)
Learn from the best! This table showcases top-performing Airbnb hosts in Bellreguard based on the number of properties managed and estimated total revenue over the past year. Analyze their scale and performance metrics.
| Host Name | Properties | Grossing Revenue | Stay Reviews | Avg Rating |
|---|---|---|---|---|
| Nacho | 7 | $159,850 | 259 | 4.91/5.0 |
| Francisco | 1 | $54,802 | 65 | 4.89/5.0 |
| Host #80839530 | 1 | $53,789 | 0 | 0.00/5.0 |
| David | 3 | $36,862 | 15 | 3.15/5.0 |
| Rafael David | 1 | $33,674 | 69 | 4.71/5.0 |
| Lina | 2 | $31,817 | 88 | 4.81/5.0 |
| Jorge | 2 | $30,071 | 155 | 4.79/5.0 |
| Paulino | 1 | $24,671 | 28 | 4.39/5.0 |
| Manuel | 1 | $21,366 | 17 | 4.88/5.0 |
| Alvaro | 1 | $20,692 | 32 | 4.91/5.0 |
Analyzing the strategies of top hosts, such as their property selection, pricing, and guest communication, can offer valuable lessons for optimizing your own Airbnb operations in Bellreguard.
Dive Deeper: Advanced Bellreguard STR Market Data (2025)
Ready to unlock more insights? AirROI provides access to advanced metrics and comprehensive Airbnb data for Bellreguard. Explore detailed analytics beyond this report to refine your investment strategy, optimize pricing, and maximize your vacation rental profits.
Explore Advanced MetricsBellreguard Short-Term Rental Market Composition (2025): Property & Room Types
Room Type Distribution
Property Type Distribution
Market Composition Insights for Bellreguard
- The Bellreguard Airbnb market composition is heavily skewed towards Entire Home/Apt listings, which make up 100% of the 51 active rentals. This indicates strong guest preference for privacy and space.
- Looking at the property type distribution in Bellreguard, Apartment/Condo properties are the most common (88.2%), reflecting the local real estate landscape.
Bellreguard Airbnb Room Capacity Analysis (2025): Bedroom Distribution
Distribution of Listings by Number of Bedrooms
Room Capacity Insights for Bellreguard
- The dominant room capacity in Bellreguard is 2 bedrooms listings, making up 39.2% of the market. This suggests a strong demand for properties suitable for couples or solo travelers.
- Together, 2 bedrooms and 3 bedrooms properties represent 72.5% of the active Airbnb listings in Bellreguard, indicating a high concentration in these sizes.
- A significant 39.2% of listings offer 3+ bedrooms, catering to larger groups and families seeking more space in Bellreguard.
Bellreguard Vacation Rental Guest Capacity Trends (2025)
Distribution of Listings by Guest Capacity
Guest Capacity Insights for Bellreguard
- The most common guest capacity trend in Bellreguard vacation rentals is listings accommodating 6 guests (35.3%). This suggests the primary traveler segment is likely larger groups.
- Properties designed for 6 guests and 4 guests dominate the Bellreguard STR market, accounting for 66.7% of listings.
- 47.1% of properties accommodate 6+ guests, serving the market segment for larger families or group travel in Bellreguard.
- On average, properties in Bellreguard are equipped to host 5.2 guests.
Bellreguard Airbnb Booking Patterns (2025): Available vs. Booked Days
Available Days Distribution
Booked Days Distribution
Booking Pattern Insights for Bellreguard
- The most common availability pattern in Bellreguard falls within the 271-366 days range, representing 47.1% of listings. This suggests many properties have significant open periods on their calendars.
- Approximately 66.7% of listings show high availability (181+ days open annually), indicating potential for increased bookings or specific owner usage patterns.
- For booked days, the 181-270 days range is most frequent in Bellreguard (31.4%), reflecting common guest stay durations or potential owner blocking patterns.
- A notable 35.3% of properties secure long booking periods (181+ days booked per year), highlighting successful long-term rental strategies or significant owner usage.
Bellreguard Airbnb Minimum Stay Requirements Analysis
Distribution of Listings by Minimum Night Requirement
1 Night
3 listings
6.3% of total
2 Nights
14 listings
29.2% of total
3 Nights
4 listings
8.3% of total
4-6 Nights
9 listings
18.8% of total
7-29 Nights
7 listings
14.6% of total
30+ Nights
11 listings
22.9% of total
Key Insights
- The most prevalent minimum stay requirement in Bellreguard is 2 Nights, adopted by 29.2% of listings. This highlights the market's preference for shorter, flexible bookings.
- A significant segment (22.9%) caters to monthly stays (30+ nights) in Bellreguard, pointing to opportunities in the extended-stay market.
Recommendations
- Align with the market by considering a 2 Nights minimum stay, as 29.2% of Bellreguard hosts use this setting.
- If feasible, allowing 1-night stays, especially midweek or during low season, could capture last-minute bookings, as only 6.3% currently do.
- Explore offering discounts for stays of 30+ nights to attract the 22.9% of the market seeking extended stays.
- Adjust minimum nights based on seasonality – potentially shorter during low season and longer during peak demand periods in Bellreguard.
Bellreguard Airbnb Cancellation Policy Trends Analysis (2025)
Flexible
6 listings
14.3% of total
Moderate
7 listings
16.7% of total
Firm
21 listings
50% of total
Strict
8 listings
19% of total
Cancellation Policy Insights for Bellreguard
- The prevailing Airbnb cancellation policy trend in Bellreguard is Firm, used by 50% of listings.
- A majority (69.0%) of hosts in Bellreguard utilize Firm or Strict policies, indicating a market where hosts prioritize booking security.
Recommendations for Hosts
- Consider adopting a Firm policy to align with the 50% market standard in Bellreguard.
- Regularly review your cancellation policy against competitors and market demand shifts in Bellreguard.
Bellreguard STR Booking Lead Time Analysis (2025)
Average Booking Lead Time by Month
Booking Lead Time Insights for Bellreguard
- The overall average booking lead time for vacation rentals in Bellreguard is 47 days.
- Guests book furthest in advance for stays during July (average 110 days), likely coinciding with peak travel demand or local events.
- The shortest booking windows occur for stays in March (average 30 days), indicating more last-minute travel plans during this time.
- Seasonally, Summer (83 days avg.) sees the longest lead times, while Spring (49 days avg.) has the shortest, reflecting typical travel planning cycles.
Recommendations for Hosts
- Use the overall average lead time (47 days) as a baseline for your pricing and availability strategy in Bellreguard.
- For July stays, consider implementing length-of-stay discounts or slightly higher rates for bookings made less than 110 days out to capitalize on advance planning.
- Target marketing efforts for the Summer season well in advance (at least 83 days) to capture early planners.
- Monitor your own booking lead times against these Bellreguard averages to identify opportunities for dynamic pricing adjustments.
Popular & Essential Airbnb Amenities in Bellreguard (2025)
Amenity Prevalence
Amenity Insights for Bellreguard
- Essential amenities in Bellreguard that guests expect include: Kitchen, Hot water, TV, Washer. Lacking these (any) could significantly impact bookings.
- Popular amenities like Essentials, Hangers, Dishes and silverware are common but not universal. Offering these can provide a competitive edge.
Recommendations for Hosts
- Ensure your listing includes all essential amenities for Bellreguard: Kitchen, Hot water, TV, Washer.
- Prioritize adding missing essentials: TV, Washer.
- Consider adding popular differentiators like Essentials or Hangers to increase appeal.
- Highlight unique or less common amenities you offer (e.g., hot tub, dedicated workspace, EV charger) in your listing description and photos.
- Regularly check competitor amenities in Bellreguard to stay competitive.
Bellreguard Airbnb Guest Demographics & Profile Analysis (2025)
Guest Profile Summary for Bellreguard
- The typical guest profile for Airbnb in Bellreguard consists of a mix of domestic (65%) and international guests, often arriving from nearby Madrid, typically belonging to the Post-2000s (Gen Z/Alpha) group (50%), primarily speaking Spanish or English.
- Domestic travelers account for 64.5% of guests.
- Key international markets include Spain (64.5%) and France (9.1%).
- Top languages spoken are Spanish (37.5%) followed by English (31.4%).
- A significant demographic segment is the Post-2000s (Gen Z/Alpha) group, representing 50% of guests.
Recommendations for Hosts
- Target domestic marketing efforts towards travelers from Madrid and Valencia.
- Tailor amenities and listing descriptions to appeal to the dominant Post-2000s (Gen Z/Alpha) demographic (e.g., highlight fast WiFi, smart home features, local guides).
- Highlight unique local experiences or amenities relevant to the primary guest profile.
- Consider seasonal promotions aligned with peak travel times for key origin markets.
Nearby Short-Term Rental Market Comparison
How does the Bellreguard Airbnb market stack up against its neighbors? Compare key performance metrics like average monthly revenue, ADR, and occupancy rates in surrounding areas to understand the broader regional STR landscape.
| Market | Active Properties | Monthly Revenue | Daily Rate | Avg. Occupancy |
|---|---|---|---|---|
| Macastre | 13 | $2,924 | $296.93 | 42% |
| Corbera | 13 | $2,721 | $206.87 | 41% |
| Bétera | 31 | $2,711 | $222.77 | 46% |
| l'Eliana | 33 | $2,510 | $298.45 | 43% |
| San Antonio de Benagéber | 11 | $2,374 | $335.55 | 40% |
| Manises | 25 | $2,352 | $175.71 | 38% |
| Olocau | 11 | $2,245 | $308.22 | 36% |
| Alboraia / Alboraya | 272 | $2,220 | $186.05 | 49% |
| la Pobla de Vallbona | 27 | $2,163 | $193.69 | 49% |
| Riba-roja de Túria | 21 | $2,132 | $221.03 | 41% |