Almassora Airbnb Market Analysis 2025: Short Term Rental Data & Vacation Rental Statistics in Valencian Community, Spain
Is Airbnb profitable in Almassora in 2025? Explore comprehensive Airbnb analytics for Almassora, Valencian Community, Spain to uncover income potential. This 2025 STR market report for Almassora, based on AirROI data from April 2024 to March 2025, reveals key trends in the niche market of 19 active listings.
Whether you're considering an Airbnb investment in Almassora, optimizing your existing vacation rental, or exploring rental arbitrage opportunities, understanding the Almassora Airbnb data is crucial. Understanding the local regulations is key to maximizing your short term rental income potential. Let's dive into the specifics.
Key Almassora Airbnb Performance Metrics Overview
Monthly Airbnb Revenue Variations & Income Potential in Almassora (2025)
Understanding the monthly revenue variations for Airbnb listings in Almassora is key to maximizing your short term rental income potential. Seasonality significantly impacts earnings. Our analysis, based on data from the past 12 months, shows that the peak revenue month for STRs in Almassora is typically August, while March often presents the lowest earnings, highlighting opportunities for strategic pricing adjustments during shoulder and low seasons. Explore the typical Airbnb income in Almassora across different performance tiers:
- Best-in-class properties (Top 10%) achieve $3,639+ monthly, often utilizing dynamic pricing and superior guest experiences.
- Strong performing properties (Top 25%) earn $2,018 or more, indicating effective management and desirable locations/amenities.
- Typical properties (Median) generate around $1,193 per month, representing the average market performance.
- Entry-level properties (Bottom 25%) see earnings around $681, often with potential for optimization.
Average Monthly Airbnb Earnings Trend in Almassora
Almassora Airbnb Occupancy Rate Trends (2025)
Maximize your bookings by understanding the Almassora STR occupancy trends. Seasonal demand shifts significantly influence how often properties are booked. Typically, Augustsees the highest demand (peak season occupancy), while March experiences the lowest (low season). Effective strategies, like adjusting minimum stays or offering promotions, can boost occupancy during slower periods. Here's how different property tiers perform in Almassora:
- Best-in-class properties (Top 10%) achieve 74%+ occupancy, indicating high desirability and potentially optimized availability.
- Strong performing properties (Top 25%) maintain 51% or higher occupancy, suggesting good market fit and guest satisfaction.
- Typical properties (Median) have an occupancy rate around 31%.
- Entry-level properties (Bottom 25%) average 18% occupancy, potentially facing higher vacancy.
Average Monthly Occupancy Rate Trend in Almassora
Average Daily Rate (ADR) Airbnb Trends in Almassora (2025)
Effective short term rental pricing strategy in Almassora involves understanding monthly ADR fluctuations. The Average Daily Rate (ADR) for Airbnb in Almassora typically peaks in August and dips lowest during October. Leveraging Airbnb dynamic pricing tools or strategies based on this seasonality can significantly boost revenue. Here's a look at the typical nightly rates achieved:
- Best-in-class properties (Top 10%) command rates of $275+ per night, often due to premium features or locations.
- Strong performing properties (Top 25%) achieve nightly rates of $126 or more.
- Typical properties (Median) charge around $91 per night.
- Entry-level properties (Bottom 25%) earn around $68 per night.
Average Daily Rate (ADR) Trend by Month in Almassora
Get Live Almassora Market Intelligence 👇

Explore Real-time Analytics
Airbnb Seasonality Analysis & Trends in Almassora (2025)
Peak Season (August, July, September)
- Revenue averages $2,998 per month
- Occupancy rates average 61.7%
- Daily rates average $123
Shoulder Season
- Revenue averages $1,366 per month
- Occupancy maintains around 30.5%
- Daily rates hold near $117
Low Season (February, March, December)
- Revenue drops to average $675 per month
- Occupancy decreases to average 26.6%
- Daily rates adjust to average $115
Seasonality Insights for Almassora
- The Airbnb seasonality in Almassora shows highly seasonal trends requiring careful strategy. While the sections above show seasonal averages, it's also insightful to look at the extremes:
- During the high season, the absolute peak month showcases Almassora's highest earning potential, with monthly revenues capable of climbing to $3,618, occupancy reaching a high of 72.6%, and ADRs peaking at $127.
- Conversely, the slowest single month of the year, typically falling within the low season, marks the market's lowest point. In this month, revenue might dip to $611, occupancy could drop to 15.3%, and ADRs may adjust down to $110.
- Understanding both the seasonal averages and these monthly peaks and troughs in revenue, occupancy, and ADR is crucial for maximizing your Airbnb profit potential in Almassora.
Seasonal Strategies for Maximizing Profit
- Peak Season: Maximize revenue through premium pricing and potentially longer minimum stays. Ensure high availability.
- Low Season: Offer competitive pricing, special promotions (e.g., extended stay discounts), and flexible cancellation policies. Target off-season travelers like remote workers or budget-conscious guests.
- Shoulder Seasons: Implement dynamic pricing that balances peak and low rates. Target weekend travelers or specific events. Offer slightly more flexible terms than peak season.
- Regularly analyze your own performance against these Almassora seasonality benchmarks and adjust your pricing and availability strategy accordingly.
Best Areas for Airbnb Investment in Almassora (2025)
Exploring the top neighborhoods for short-term rentals in Almassora? This section highlights key areas, outlining why they are attractive for hosts and guests, along with notable local attractions. Consider these locations based on your target guest profile and investment strategy.
| Neighborhood / Area | Why Host Here? (Target Guests & Appeal) | Key Attractions & Landmarks |
|---|---|---|
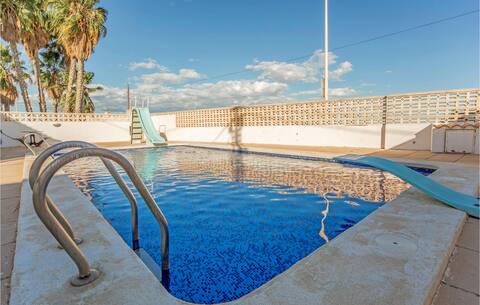
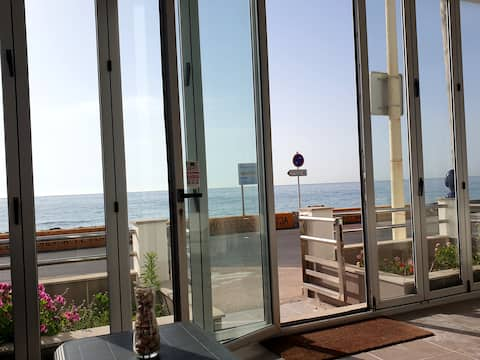
| Playa de Almassora | Popular beach destination known for its golden sands and inviting waters. Ideal for families and travelers seeking relaxation and sunbathing opportunities. | Almassora Beach, Boardwalk Promenade, Local seafood restaurants, Water sports activities |
| Parque del Trenet | A tranquil park area providing green space and recreational facilities. Attracts families and individuals looking for a peaceful retreat. | Park trails, Playgrounds, Picnic areas, Community events |
| Centro de Almassora | The vibrant town center bustling with shops, restaurants, and historical sites. A prime spot for visitors wanting to experience local culture and cuisine. | Almassora Town Hall, Church of Santa Maria, Local markets, Cafés and tapas bars |
| Pueblo | Charming neighborhood known for its traditional architecture and local atmosphere. Perfect for guests wanting an authentic Spanish experience. | Narrow streets, Traditional homes, Local festivals, Cultural heritage sites |
| Cerro de La Cruz | A scenic area that offers panoramic views of the region. Ideal for hikers and nature lovers looking for a mix of adventure and relaxation. | Hiking trails, Nature observation, Viewpoints, Outdoor activities |
| Cala de la Roqueta | A small cove situated nearby known for its natural beauty. Great for couples and those seeking an intimate beach experience. | Secluded beach, Crystal clear waters, Snorkeling spots, Cozy beach bars |
| El Bosque | Natural park area perfect for hiking and outdoor sports. Appeals to eco-tourists and adventurous travelers who enjoy nature. | Nature trails, Wildlife observation, Picnic spots, Outdoor sports |
| Urbanización Almassora | Residential area with modern amenities and proximity to attractions. Popular among families or longer stays for those visiting the region. | Residential parks, Community facilities, Shopping centers nearby |
Understanding Airbnb License Requirements & STR Laws in Almassora (2025)
With 26% of listings showing registration in 2025, understanding potential Airbnb license requirements is crucial in Almassora. Always verify the latest short term rental regulations and Airbnb license requirements directly with local government authorities for Almassora to ensure full compliance before hosting.
(Source: AirROI data, 2025, based on 26% licensed listings)
Top Performing Airbnb Properties in Almassora (2025)
Benchmark your potential! Explore examples of top-performing Airbnb properties in Almassorabased on Trailing Twelve Month (TTM) revenue. Analyze their characteristics, revenue, occupancy rate, and ADR to understand what drives success in this market.
3 bedroom nice home in Playa de Almazora
Entire Place • 3 bedrooms
Amazing home in Playa de Almazora with kitchen
Entire Place • 4 bedrooms

three bedroom townhouse
Entire Place • 3 bedrooms
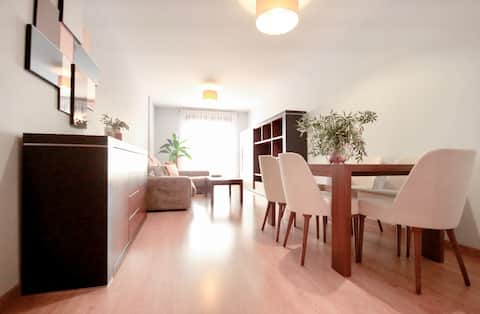
Baby-friendly apartment with private parking
Entire Place • 3 bedrooms

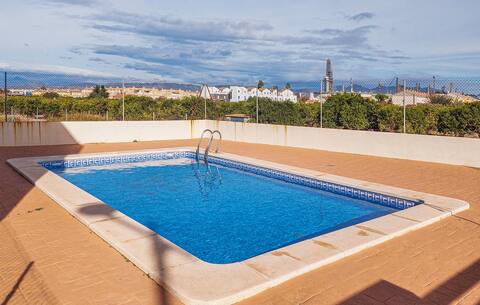
Cheerful house with pool and barbecue
Entire Place • 3 bedrooms
Playa de Almazora a house with a private pool
Entire Place • 3 bedrooms
Note: Performance varies based on location, size, amenities, seasonality, and management quality. Data reflects the past 12 months.
Top Performing Airbnb Hosts in Almassora (2025)
Learn from the best! This table showcases top-performing Airbnb hosts in Almassora based on the number of properties managed and estimated total revenue over the past year. Analyze their scale and performance metrics.
| Host Name | Properties | Grossing Revenue | Stay Reviews | Avg Rating |
|---|---|---|---|---|
| Host #141531977 | 1 | $38,230 | 3 | 3.33/5.0 |
| Host #142829757 | 1 | $27,745 | 0 | 0.00/5.0 |
| Alberto | 1 | $23,387 | 12 | 4.50/5.0 |
| Alicia | 1 | $20,520 | 43 | 4.93/5.0 |
| Pascual M | 1 | $19,336 | 15 | 4.80/5.0 |
| Giuseppe | 1 | $18,200 | 18 | 4.89/5.0 |
| Pascual | 1 | $15,350 | 30 | 4.90/5.0 |
| Juanamari | 1 | $14,848 | 31 | 5.00/5.0 |
| Ana | 1 | $14,067 | 28 | 5.00/5.0 |
| Elena | 2 | $12,548 | 57 | 4.49/5.0 |
Analyzing the strategies of top hosts, such as their property selection, pricing, and guest communication, can offer valuable lessons for optimizing your own Airbnb operations in Almassora.
Dive Deeper: Advanced Almassora STR Market Data (2025)
Ready to unlock more insights? AirROI provides access to advanced metrics and comprehensive Airbnb data for Almassora. Explore detailed analytics beyond this report to refine your investment strategy, optimize pricing, and maximize your vacation rental profits.
Explore Advanced MetricsAlmassora Short-Term Rental Market Composition (2025): Property & Room Types
Room Type Distribution
Property Type Distribution
Market Composition Insights for Almassora
- The Almassora Airbnb market composition is heavily skewed towards Entire Home/Apt listings, which make up 94.7% of the 19 active rentals. This indicates strong guest preference for privacy and space.
- Looking at the property type distribution in Almassora, House properties are the most common (78.9%), reflecting the local real estate landscape.
- Houses represent a significant 78.9% portion, catering likely to families or larger groups.
Almassora Airbnb Room Capacity Analysis (2025): Bedroom Distribution
Distribution of Listings by Number of Bedrooms
Room Capacity Insights for Almassora
- The dominant room capacity in Almassora is 3 bedrooms listings, making up 63.2% of the market. This suggests a strong demand for properties suitable for families or small groups.
- Together, 3 bedrooms and 2 bedrooms properties represent 84.3% of the active Airbnb listings in Almassora, indicating a high concentration in these sizes.
- A significant 68.5% of listings offer 3+ bedrooms, catering to larger groups and families seeking more space in Almassora.
Almassora Vacation Rental Guest Capacity Trends (2025)
Distribution of Listings by Guest Capacity
Guest Capacity Insights for Almassora
- The most common guest capacity trend in Almassora vacation rentals is listings accommodating 6 guests (36.8%). This suggests the primary traveler segment is likely larger groups.
- Properties designed for 6 guests and 4 guests dominate the Almassora STR market, accounting for 63.1% of listings.
- 52.6% of properties accommodate 6+ guests, serving the market segment for larger families or group travel in Almassora.
- On average, properties in Almassora are equipped to host 5.3 guests.
Almassora Airbnb Booking Patterns (2025): Available vs. Booked Days
Available Days Distribution
Booked Days Distribution
Booking Pattern Insights for Almassora
- The most common availability pattern in Almassora falls within the 271-366 days range, representing 52.6% of listings. This suggests many properties have significant open periods on their calendars.
- Approximately 89.4% of listings show high availability (181+ days open annually), indicating potential for increased bookings or specific owner usage patterns.
- For booked days, the 91-180 days range is most frequent in Almassora (36.8%), reflecting common guest stay durations or potential owner blocking patterns.
- A notable 10.5% of properties secure long booking periods (181+ days booked per year), highlighting successful long-term rental strategies or significant owner usage.
Almassora Airbnb Minimum Stay Requirements Analysis
Distribution of Listings by Minimum Night Requirement
1 Night
2 listings
11.8% of total
2 Nights
6 listings
35.3% of total
3 Nights
3 listings
17.6% of total
4-6 Nights
1 listings
5.9% of total
7-29 Nights
2 listings
11.8% of total
30+ Nights
3 listings
17.6% of total
Key Insights
- The most prevalent minimum stay requirement in Almassora is 2 Nights, adopted by 35.3% of listings. This highlights the market's preference for shorter, flexible bookings.
- A significant segment (17.6%) caters to monthly stays (30+ nights) in Almassora, pointing to opportunities in the extended-stay market.
Recommendations
- Align with the market by considering a 2 Nights minimum stay, as 35.3% of Almassora hosts use this setting.
- If feasible, allowing 1-night stays, especially midweek or during low season, could capture last-minute bookings, as only 11.8% currently do.
- A 2-night minimum appears standard (35.3%). Consider this for weekends or peak periods.
- Explore offering discounts for stays of 30+ nights to attract the 17.6% of the market seeking extended stays.
- Adjust minimum nights based on seasonality – potentially shorter during low season and longer during peak demand periods in Almassora.
Almassora Airbnb Cancellation Policy Trends Analysis (2025)
Flexible
2 listings
13.3% of total
Moderate
5 listings
33.3% of total
Firm
4 listings
26.7% of total
Strict
4 listings
26.7% of total
Cancellation Policy Insights for Almassora
- The prevailing Airbnb cancellation policy trend in Almassora is Moderate, used by 33.3% of listings.
- A majority (53.4%) of hosts in Almassora utilize Firm or Strict policies, indicating a market where hosts prioritize booking security.
Recommendations for Hosts
- Consider adopting a Moderate policy to align with the 33.3% market standard in Almassora.
- Regularly review your cancellation policy against competitors and market demand shifts in Almassora.
Almassora STR Booking Lead Time Analysis (2025)
Average Booking Lead Time by Month
Booking Lead Time Insights for Almassora
- The overall average booking lead time for vacation rentals in Almassora is 52 days.
- Guests book furthest in advance for stays during July (average 112 days), likely coinciding with peak travel demand or local events.
- The shortest booking windows occur for stays in November (average 13 days), indicating more last-minute travel plans during this time.
- Seasonally, Summer (102 days avg.) sees the longest lead times, while Spring (21 days avg.) has the shortest, reflecting typical travel planning cycles.
Recommendations for Hosts
- Use the overall average lead time (52 days) as a baseline for your pricing and availability strategy in Almassora.
- For July stays, consider implementing length-of-stay discounts or slightly higher rates for bookings made less than 112 days out to capitalize on advance planning.
- During November, focus on last-minute booking availability and promotions, as guests book with very short notice (13 days avg.).
- Target marketing efforts for the Summer season well in advance (at least 102 days) to capture early planners.
- Monitor your own booking lead times against these Almassora averages to identify opportunities for dynamic pricing adjustments.
Popular & Essential Airbnb Amenities in Almassora (2025)
Amenity Prevalence
Amenity Insights for Almassora
- Essential amenities in Almassora that guests expect include: Kitchen, Washer, TV, Wifi. Lacking these (any) could significantly impact bookings.
- Popular amenities like Air conditioning, Hot water, Dishes and silverware are common but not universal. Offering these can provide a competitive edge.
Recommendations for Hosts
- Ensure your listing includes all essential amenities for Almassora: Kitchen, Washer, TV, Wifi.
- Consider adding popular differentiators like Air conditioning or Hot water to increase appeal.
- Highlight unique or less common amenities you offer (e.g., hot tub, dedicated workspace, EV charger) in your listing description and photos.
- Regularly check competitor amenities in Almassora to stay competitive.
Almassora Airbnb Guest Demographics & Profile Analysis (2025)
Guest Profile Summary for Almassora
- The typical guest profile for Airbnb in Almassora consists of a mix of domestic (64%) and international guests, often arriving from nearby Valencia, typically belonging to the Post-2000s (Gen Z/Alpha) group (50%), primarily speaking Spanish or English.
- Domestic travelers account for 64.2% of guests.
- Key international markets include Spain (64.2%) and France (22.4%).
- Top languages spoken are Spanish (34.8%) followed by English (21.7%).
- A significant demographic segment is the Post-2000s (Gen Z/Alpha) group, representing 50% of guests.
Recommendations for Hosts
- Target domestic marketing efforts towards travelers from Valencia and Madrid.
- Tailor amenities and listing descriptions to appeal to the dominant Post-2000s (Gen Z/Alpha) demographic (e.g., highlight fast WiFi, smart home features, local guides).
- Highlight unique local experiences or amenities relevant to the primary guest profile.
- Consider seasonal promotions aligned with peak travel times for key origin markets.
Nearby Short-Term Rental Market Comparison
How does the Almassora Airbnb market stack up against its neighbors? Compare key performance metrics like average monthly revenue, ADR, and occupancy rates in surrounding areas to understand the broader regional STR landscape.
| Market | Active Properties | Monthly Revenue | Daily Rate | Avg. Occupancy |
|---|---|---|---|---|
| Macastre | 13 | $2,924 | $296.93 | 42% |
| Corbera | 13 | $2,721 | $206.87 | 41% |
| Bétera | 31 | $2,711 | $222.77 | 46% |
| l'Eliana | 33 | $2,510 | $298.45 | 43% |
| San Antonio de Benagéber | 11 | $2,374 | $335.55 | 40% |
| Manises | 25 | $2,352 | $175.71 | 38% |
| Olocau | 11 | $2,245 | $308.22 | 36% |
| Alboraia / Alboraya | 272 | $2,220 | $186.05 | 49% |
| la Pobla de Vallbona | 27 | $2,163 | $193.69 | 49% |
| Riba-roja de Túria | 21 | $2,132 | $221.03 | 41% |