Alboraia / Alboraya Airbnb Market Analysis 2025: Short Term Rental Data & Vacation Rental Statistics in Valencian Community, Spain
Is Airbnb profitable in Alboraia / Alboraya in 2025? Explore comprehensive Airbnb analytics for Alboraia / Alboraya, Valencian Community, Spain to uncover income potential. This 2025 STR market report for Alboraia / Alboraya, based on AirROI data from April 2024 to March 2025, reveals key trends in the market of 272 active listings.
Whether you're considering an Airbnb investment in Alboraia / Alboraya, optimizing your existing vacation rental, or exploring rental arbitrage opportunities, understanding the Alboraia / Alboraya Airbnb data is crucial. Navigating the high regulation landscape is key to maximizing your short term rental income potential. Let's dive into the specifics.
Key Alboraia / Alboraya Airbnb Performance Metrics Overview
Monthly Airbnb Revenue Variations & Income Potential in Alboraia / Alboraya (2025)
Understanding the monthly revenue variations for Airbnb listings in Alboraia / Alboraya is key to maximizing your short term rental income potential. Seasonality significantly impacts earnings. Our analysis, based on data from the past 12 months, shows that the peak revenue month for STRs in Alboraia / Alboraya is typically August, while January often presents the lowest earnings, highlighting opportunities for strategic pricing adjustments during shoulder and low seasons. Explore the typical Airbnb income in Alboraia / Alboraya across different performance tiers:
- Best-in-class properties (Top 10%) achieve $5,463+ monthly, often utilizing dynamic pricing and superior guest experiences.
- Strong performing properties (Top 25%) earn $3,933 or more, indicating effective management and desirable locations/amenities.
- Typical properties (Median) generate around $2,630 per month, representing the average market performance.
- Entry-level properties (Bottom 25%) see earnings around $1,518, often with potential for optimization.
Average Monthly Airbnb Earnings Trend in Alboraia / Alboraya
Alboraia / Alboraya Airbnb Occupancy Rate Trends (2025)
Maximize your bookings by understanding the Alboraia / Alboraya STR occupancy trends. Seasonal demand shifts significantly influence how often properties are booked. Typically, Julysees the highest demand (peak season occupancy), while January experiences the lowest (low season). Effective strategies, like adjusting minimum stays or offering promotions, can boost occupancy during slower periods. Here's how different property tiers perform in Alboraia / Alboraya:
- Best-in-class properties (Top 10%) achieve 82%+ occupancy, indicating high desirability and potentially optimized availability.
- Strong performing properties (Top 25%) maintain 69% or higher occupancy, suggesting good market fit and guest satisfaction.
- Typical properties (Median) have an occupancy rate around 52%.
- Entry-level properties (Bottom 25%) average 27% occupancy, potentially facing higher vacancy.
Average Monthly Occupancy Rate Trend in Alboraia / Alboraya
Average Daily Rate (ADR) Airbnb Trends in Alboraia / Alboraya (2025)
Effective short term rental pricing strategy in Alboraia / Alboraya involves understanding monthly ADR fluctuations. The Average Daily Rate (ADR) for Airbnb in Alboraia / Alboraya typically peaks in August and dips lowest during February. Leveraging Airbnb dynamic pricing tools or strategies based on this seasonality can significantly boost revenue. Here's a look at the typical nightly rates achieved:
- Best-in-class properties (Top 10%) command rates of $283+ per night, often due to premium features or locations.
- Strong performing properties (Top 25%) achieve nightly rates of $222 or more.
- Typical properties (Median) charge around $165 per night.
- Entry-level properties (Bottom 25%) earn around $120 per night.
Average Daily Rate (ADR) Trend by Month in Alboraia / Alboraya
Get Live Alboraia / Alboraya Market Intelligence 👇

Explore Real-time Analytics
Airbnb Seasonality Analysis & Trends in Alboraia / Alboraya (2025)
Peak Season (August, July, June)
- Revenue averages $4,507 per month
- Occupancy rates average 65.0%
- Daily rates average $200
Shoulder Season
- Revenue averages $2,908 per month
- Occupancy maintains around 50.3%
- Daily rates hold near $179
Low Season (January, February, December)
- Revenue drops to average $1,493 per month
- Occupancy decreases to average 31.2%
- Daily rates adjust to average $166
Seasonality Insights for Alboraia / Alboraya
- The Airbnb seasonality in Alboraia / Alboraya shows highly seasonal trends requiring careful strategy. While the sections above show seasonal averages, it's also insightful to look at the extremes:
- During the high season, the absolute peak month showcases Alboraia / Alboraya's highest earning potential, with monthly revenues capable of climbing to $4,785, occupancy reaching a high of 69.1%, and ADRs peaking at $205.
- Conversely, the slowest single month of the year, typically falling within the low season, marks the market's lowest point. In this month, revenue might dip to $1,340, occupancy could drop to 27.5%, and ADRs may adjust down to $159.
- Understanding both the seasonal averages and these monthly peaks and troughs in revenue, occupancy, and ADR is crucial for maximizing your Airbnb profit potential in Alboraia / Alboraya.
Seasonal Strategies for Maximizing Profit
- Peak Season: Maximize revenue through premium pricing and potentially longer minimum stays. Ensure high availability.
- Low Season: Offer competitive pricing, special promotions (e.g., extended stay discounts), and flexible cancellation policies. Target off-season travelers like remote workers or budget-conscious guests.
- Shoulder Seasons: Implement dynamic pricing that balances peak and low rates. Target weekend travelers or specific events. Offer slightly more flexible terms than peak season.
- Regularly analyze your own performance against these Alboraia / Alboraya seasonality benchmarks and adjust your pricing and availability strategy accordingly.
Best Areas for Airbnb Investment in Alboraia / Alboraya (2025)
Exploring the top neighborhoods for short-term rentals in Alboraia / Alboraya? This section highlights key areas, outlining why they are attractive for hosts and guests, along with notable local attractions. Consider these locations based on your target guest profile and investment strategy.
| Neighborhood / Area | Why Host Here? (Target Guests & Appeal) | Key Attractions & Landmarks |
|---|---|---|
| Malvarrosa Beach | A popular beach destination in Valencia that is perfect for summer tourists looking for sun and sand. Close to restaurants and beach activities. | Malvarrosa Beach, Playa de la Malvarrosa, La Marina de Valencia, Cerro de las Ranas, Restaurants and bars along the beachfront |
| Albufera Natural Park | A beautiful natural area with stunning landscapes, famous for its rice fields and traditional paella. Attracts nature lovers and gastronomy tourists. | Albufera Lagoon, Las Fallas, The traditional boat rides, Local East Spanish cuisine, Natural scenery and birdwatching |
| Port Saplaya | A picturesque seaside town with colorful houses and a charming harbor, ideal for those seeking a quieter beach experience. | Port Saplaya Marina, Restaurants by the water, Beaches of Port Saplaya, Water sports, Walking paths along the seafront |
| Alboraya town center | The central area of Alboraya offers cultural authenticity with local shops, markets, and a glimpse of Valencian lifestyle. | Local markets, Cultural festivals, Historic buildings, Nearby parks, Valencian cuisine restaurants |
| Las Fallas | One of the most famous festivals in Valencia, celebrated every March, attracting many tourists. Great potential for short-term rentals. | Fallas monuments, Fireworks displays, Cultural events, Street parties, Les Falles neighborhood |
| Cabas Bodegas | Known for its wine production and local tastings, ideal for oenophiles and those looking for a cultural experience beyond the beach. | Cabs Bodegas Wine Tours, Local wineries, Tasting events, Workshops, Visual arts in wine |
| Pinedo Beach | A less crowded beach with a more local feel, ideal for families and those seeking relaxation away from the busy tourist areas. | Pinedo Beach, Picnic areas, Family-friendly environment, Natural dunes, Water sports |
| Parque de la Albufera | A beautiful park surrounding the Albufera lagoon, perfect for outdoor activities, picnics, and enjoying nature. | Walking trails, Cycling paths, Scenic views, Picnic areas, Birdwatching opportunities |
Understanding Airbnb License Requirements & STR Laws in Alboraia / Alboraya (2025)
Yes, Alboraia / Alboraya, Valencian Community, Spain enforces high STR regulations. Obtaining a license and ensuring compliance is almost certainly required according to current 2025 STR laws. Always verify the latest short term rental regulations and Airbnb license requirements directly with local government authorities for Alboraia / Alboraya to ensure full compliance before hosting.
(Source: AirROI data, 2025, based on 31% licensed listings)
Top Performing Airbnb Properties in Alboraia / Alboraya (2025)
Benchmark your potential! Explore examples of top-performing Airbnb properties in Alboraia / Alborayabased on Trailing Twelve Month (TTM) revenue. Analyze their characteristics, revenue, occupancy rate, and ADR to understand what drives success in this market.
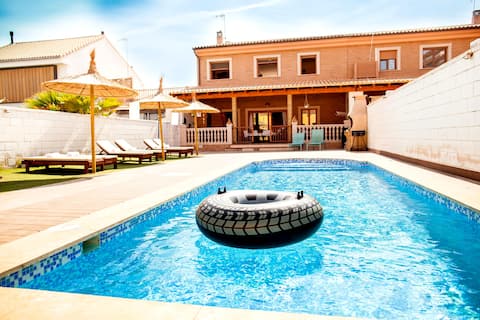
House on the Valencia beach with its own pool
Entire Place • 7 bedrooms
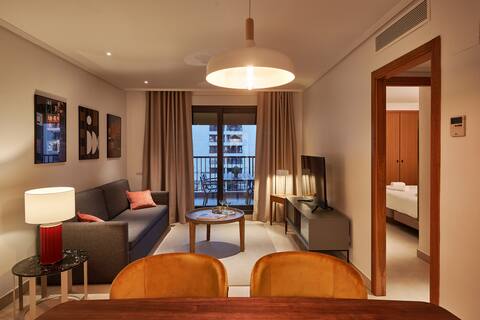
Sea view modern flat
Entire Place • 2 bedrooms
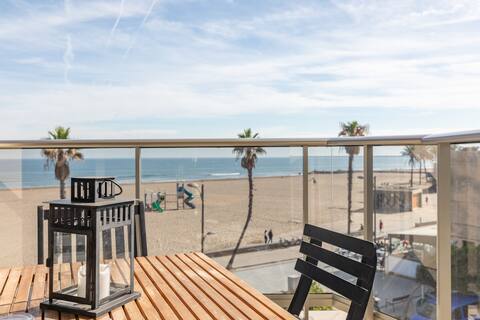
Patacona Deluxe. WiFi+PK+ A/C+ 4Pax
Entire Place • 2 bedrooms
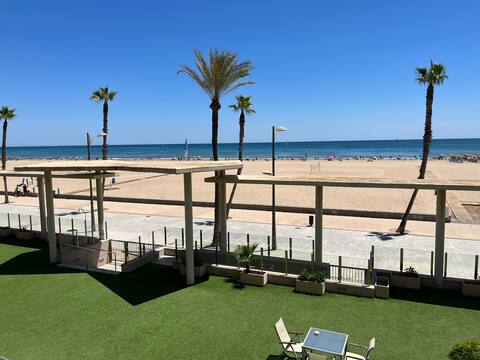
FIRST LINE PATACONA BEACH, VALENCIA
Entire Place • 2 bedrooms
Beach 4 bedroom townhouse meters from water
Entire Place • 4 bedrooms
Beachfront penthouse, PataconaBlue
Entire Place • 2 bedrooms
Note: Performance varies based on location, size, amenities, seasonality, and management quality. Data reflects the past 12 months.
Top Performing Airbnb Hosts in Alboraia / Alboraya (2025)
Learn from the best! This table showcases top-performing Airbnb hosts in Alboraia / Alboraya based on the number of properties managed and estimated total revenue over the past year. Analyze their scale and performance metrics.
| Host Name | Properties | Grossing Revenue | Stay Reviews | Avg Rating |
|---|---|---|---|---|
| Alberto | 25 | $937,923 | 555 | 4.71/5.0 |
| Massimo | 2 | $169,244 | 55 | 4.95/5.0 |
| Antonio | 2 | $137,201 | 234 | 4.79/5.0 |
| Jaime | 3 | $124,628 | 500 | 4.80/5.0 |
| Marta | 1 | $120,790 | 38 | 4.63/5.0 |
| Aitor | 2 | $110,427 | 85 | 4.99/5.0 |
| Arleta | 2 | $98,771 | 73 | 4.92/5.0 |
| Host #482597957 | 6 | $96,965 | 5 | 0.00/5.0 |
| Isabela | 2 | $89,220 | 77 | 4.74/5.0 |
| Jose | 1 | $84,792 | 64 | 4.89/5.0 |
Analyzing the strategies of top hosts, such as their property selection, pricing, and guest communication, can offer valuable lessons for optimizing your own Airbnb operations in Alboraia / Alboraya.
Dive Deeper: Advanced Alboraia / Alboraya STR Market Data (2025)
Ready to unlock more insights? AirROI provides access to advanced metrics and comprehensive Airbnb data for Alboraia / Alboraya. Explore detailed analytics beyond this report to refine your investment strategy, optimize pricing, and maximize your vacation rental profits.
Explore Advanced MetricsAlboraia / Alboraya Short-Term Rental Market Composition (2025): Property & Room Types
Room Type Distribution
Property Type Distribution
Market Composition Insights for Alboraia / Alboraya
- The Alboraia / Alboraya Airbnb market composition is heavily skewed towards Entire Home/Apt listings, which make up 91.2% of the 272 active rentals. This indicates strong guest preference for privacy and space.
- Looking at the property type distribution in Alboraia / Alboraya, Apartment/Condo properties are the most common (88.6%), reflecting the local real estate landscape.
- Smaller segments like hotel/boutique, outdoor/unique (combined 4.0%) offer potential for unique stay experiences.
Alboraia / Alboraya Airbnb Room Capacity Analysis (2025): Bedroom Distribution
Distribution of Listings by Number of Bedrooms
Room Capacity Insights for Alboraia / Alboraya
- The dominant room capacity in Alboraia / Alboraya is 2 bedrooms listings, making up 53.3% of the market. This suggests a strong demand for properties suitable for couples or solo travelers.
- Together, 2 bedrooms and 1 bedroom properties represent 74.3% of the active Airbnb listings in Alboraia / Alboraya, indicating a high concentration in these sizes.
Alboraia / Alboraya Vacation Rental Guest Capacity Trends (2025)
Distribution of Listings by Guest Capacity
Guest Capacity Insights for Alboraia / Alboraya
- The most common guest capacity trend in Alboraia / Alboraya vacation rentals is listings accommodating 4 guests (47.8%). This suggests the primary traveler segment is likely small families or groups.
- Properties designed for 4 guests and 6 guests dominate the Alboraia / Alboraya STR market, accounting for 62.5% of listings.
- 21.3% of properties accommodate 6+ guests, serving the market segment for larger families or group travel in Alboraia / Alboraya.
- On average, properties in Alboraia / Alboraya are equipped to host 4.2 guests.
Alboraia / Alboraya Airbnb Booking Patterns (2025): Available vs. Booked Days
Available Days Distribution
Booked Days Distribution
Booking Pattern Insights for Alboraia / Alboraya
- The most common availability pattern in Alboraia / Alboraya falls within the 271-366 days range, representing 34.2% of listings. This suggests many properties have significant open periods on their calendars.
- Approximately 63.2% of listings show high availability (181+ days open annually), indicating potential for increased bookings or specific owner usage patterns.
- For booked days, the 181-270 days range is most frequent in Alboraia / Alboraya (33.1%), reflecting common guest stay durations or potential owner blocking patterns.
- A notable 37.9% of properties secure long booking periods (181+ days booked per year), highlighting successful long-term rental strategies or significant owner usage.
Alboraia / Alboraya Airbnb Minimum Stay Requirements Analysis
Distribution of Listings by Minimum Night Requirement
1 Night
22 listings
8.8% of total
2 Nights
66 listings
26.5% of total
3 Nights
53 listings
21.3% of total
4-6 Nights
51 listings
20.5% of total
7-29 Nights
21 listings
8.4% of total
30+ Nights
36 listings
14.5% of total
Key Insights
- The most prevalent minimum stay requirement in Alboraia / Alboraya is 2 Nights, adopted by 26.5% of listings. This highlights the market's preference for shorter, flexible bookings.
- A significant segment (14.5%) caters to monthly stays (30+ nights) in Alboraia / Alboraya, pointing to opportunities in the extended-stay market.
Recommendations
- Align with the market by considering a 2 Nights minimum stay, as 26.5% of Alboraia / Alboraya hosts use this setting.
- If feasible, allowing 1-night stays, especially midweek or during low season, could capture last-minute bookings, as only 8.8% currently do.
- Explore offering discounts for stays of 30+ nights to attract the 14.5% of the market seeking extended stays.
- Adjust minimum nights based on seasonality – potentially shorter during low season and longer during peak demand periods in Alboraia / Alboraya.
Alboraia / Alboraya Airbnb Cancellation Policy Trends Analysis (2025)
Super Strict 30 Days
18 listings
7.8% of total
Flexible
27 listings
11.7% of total
Moderate
54 listings
23.5% of total
Firm
61 listings
26.5% of total
Strict
70 listings
30.4% of total
Cancellation Policy Insights for Alboraia / Alboraya
- The prevailing Airbnb cancellation policy trend in Alboraia / Alboraya is Strict, used by 30.4% of listings.
- A majority (56.9%) of hosts in Alboraia / Alboraya utilize Firm or Strict policies, indicating a market where hosts prioritize booking security.
Recommendations for Hosts
- Consider adopting a Strict policy to align with the 30.4% market standard in Alboraia / Alboraya.
- With 30.4% using Strict terms, this is a viable option in Alboraia / Alboraya, particularly for high-value properties or during peak demand periods.
- Regularly review your cancellation policy against competitors and market demand shifts in Alboraia / Alboraya.
Alboraia / Alboraya STR Booking Lead Time Analysis (2025)
Average Booking Lead Time by Month
Booking Lead Time Insights for Alboraia / Alboraya
- The overall average booking lead time for vacation rentals in Alboraia / Alboraya is 63 days.
- Guests book furthest in advance for stays during July (average 111 days), likely coinciding with peak travel demand or local events.
- The shortest booking windows occur for stays in February (average 39 days), indicating more last-minute travel plans during this time.
- Seasonally, Summer (98 days avg.) sees the longest lead times, while Winter (49 days avg.) has the shortest, reflecting typical travel planning cycles.
Recommendations for Hosts
- Use the overall average lead time (63 days) as a baseline for your pricing and availability strategy in Alboraia / Alboraya.
- For July stays, consider implementing length-of-stay discounts or slightly higher rates for bookings made less than 111 days out to capitalize on advance planning.
- Target marketing efforts for the Summer season well in advance (at least 98 days) to capture early planners.
- Monitor your own booking lead times against these Alboraia / Alboraya averages to identify opportunities for dynamic pricing adjustments.
Popular & Essential Airbnb Amenities in Alboraia / Alboraya (2025)
Amenity Prevalence
Amenity Insights for Alboraia / Alboraya
- Essential amenities in Alboraia / Alboraya that guests expect include: Kitchen, Wifi, TV, Washer. Lacking these (any) could significantly impact bookings.
- Popular amenities like Essentials, Air conditioning, Hot water are common but not universal. Offering these can provide a competitive edge.
Recommendations for Hosts
- Ensure your listing includes all essential amenities for Alboraia / Alboraya: Kitchen, Wifi, TV, Washer.
- Prioritize adding missing essentials: Kitchen, Wifi, TV, Washer.
- Consider adding popular differentiators like Essentials or Air conditioning to increase appeal.
- Highlight unique or less common amenities you offer (e.g., hot tub, dedicated workspace, EV charger) in your listing description and photos.
- Regularly check competitor amenities in Alboraia / Alboraya to stay competitive.
Alboraia / Alboraya Airbnb Guest Demographics & Profile Analysis (2025)
Guest Profile Summary for Alboraia / Alboraya
- The typical guest profile for Airbnb in Alboraia / Alboraya consists of predominantly international visitors (82%), with top international origins including United Kingdom, typically belonging to the Post-2000s (Gen Z/Alpha) group (50%), primarily speaking English or Spanish.
- Domestic travelers account for 17.6% of guests.
- Key international markets include Spain (17.6%) and United Kingdom (12.9%).
- Top languages spoken are English (38.6%) followed by Spanish (18.8%).
- A significant demographic segment is the Post-2000s (Gen Z/Alpha) group, representing 50% of guests.
Recommendations for Hosts
- Focus marketing internationally, particularly towards travelers from United Kingdom.
- Tailor amenities and listing descriptions to appeal to the dominant Post-2000s (Gen Z/Alpha) demographic (e.g., highlight fast WiFi, smart home features, local guides).
- Highlight unique local experiences or amenities relevant to the primary guest profile.
- Consider seasonal promotions aligned with peak travel times for key origin markets.
Nearby Short-Term Rental Market Comparison
How does the Alboraia / Alboraya Airbnb market stack up against its neighbors? Compare key performance metrics like average monthly revenue, ADR, and occupancy rates in surrounding areas to understand the broader regional STR landscape.
| Market | Active Properties | Monthly Revenue | Daily Rate | Avg. Occupancy |
|---|---|---|---|---|
| Macastre | 13 | $2,924 | $296.93 | 42% |
| Corbera | 13 | $2,721 | $206.87 | 41% |
| Bétera | 31 | $2,711 | $222.77 | 46% |
| l'Eliana | 33 | $2,510 | $298.45 | 43% |
| San Antonio de Benagéber | 11 | $2,374 | $335.55 | 40% |
| Manises | 25 | $2,352 | $175.71 | 38% |
| Olocau | 11 | $2,245 | $308.22 | 36% |
| la Pobla de Vallbona | 27 | $2,163 | $193.69 | 49% |
| Riba-roja de Túria | 21 | $2,132 | $221.03 | 41% |
| Sella | 13 | $2,052 | $191.28 | 43% |