Santo Domingo de la Calzada Airbnb Market Analysis 2025: Short Term Rental Data & Vacation Rental Statistics in Rioja, Spain
Is Airbnb profitable in Santo Domingo de la Calzada in 2025? Explore comprehensive Airbnb analytics for Santo Domingo de la Calzada, Rioja, Spain to uncover income potential. This 2025 STR market report for Santo Domingo de la Calzada, based on AirROI data from April 2024 to March 2025, reveals key trends in the niche market of 21 active listings.
Whether you're considering an Airbnb investment in Santo Domingo de la Calzada, optimizing your existing vacation rental, or exploring rental arbitrage opportunities, understanding the Santo Domingo de la Calzada Airbnb data is crucial. Understanding the local regulations is key to maximizing your short term rental income potential. Let's dive into the specifics.
Key Santo Domingo de la Calzada Airbnb Performance Metrics Overview
Monthly Airbnb Revenue Variations & Income Potential in Santo Domingo de la Calzada (2025)
Understanding the monthly revenue variations for Airbnb listings in Santo Domingo de la Calzada is key to maximizing your short term rental income potential. Seasonality significantly impacts earnings. Our analysis, based on data from the past 12 months, shows that the peak revenue month for STRs in Santo Domingo de la Calzada is typically August, while January often presents the lowest earnings, highlighting opportunities for strategic pricing adjustments during shoulder and low seasons. Explore the typical Airbnb income in Santo Domingo de la Calzada across different performance tiers:
- Best-in-class properties (Top 10%) achieve $2,187+ monthly, often utilizing dynamic pricing and superior guest experiences.
- Strong performing properties (Top 25%) earn $1,766 or more, indicating effective management and desirable locations/amenities.
- Typical properties (Median) generate around $975 per month, representing the average market performance.
- Entry-level properties (Bottom 25%) see earnings around $533, often with potential for optimization.
Average Monthly Airbnb Earnings Trend in Santo Domingo de la Calzada
Santo Domingo de la Calzada Airbnb Occupancy Rate Trends (2025)
Maximize your bookings by understanding the Santo Domingo de la Calzada STR occupancy trends. Seasonal demand shifts significantly influence how often properties are booked. Typically, Augustsees the highest demand (peak season occupancy), while June experiences the lowest (low season). Effective strategies, like adjusting minimum stays or offering promotions, can boost occupancy during slower periods. Here's how different property tiers perform in Santo Domingo de la Calzada:
- Best-in-class properties (Top 10%) achieve 51%+ occupancy, indicating high desirability and potentially optimized availability.
- Strong performing properties (Top 25%) maintain 39% or higher occupancy, suggesting good market fit and guest satisfaction.
- Typical properties (Median) have an occupancy rate around 27%.
- Entry-level properties (Bottom 25%) average 15% occupancy, potentially facing higher vacancy.
Average Monthly Occupancy Rate Trend in Santo Domingo de la Calzada
Average Daily Rate (ADR) Airbnb Trends in Santo Domingo de la Calzada (2025)
Effective short term rental pricing strategy in Santo Domingo de la Calzada involves understanding monthly ADR fluctuations. The Average Daily Rate (ADR) for Airbnb in Santo Domingo de la Calzada typically peaks in May and dips lowest during February. Leveraging Airbnb dynamic pricing tools or strategies based on this seasonality can significantly boost revenue. Here's a look at the typical nightly rates achieved:
- Best-in-class properties (Top 10%) command rates of $216+ per night, often due to premium features or locations.
- Strong performing properties (Top 25%) achieve nightly rates of $115 or more.
- Typical properties (Median) charge around $100 per night.
- Entry-level properties (Bottom 25%) earn around $89 per night.
Average Daily Rate (ADR) Trend by Month in Santo Domingo de la Calzada
Get Live Santo Domingo de la Calzada Market Intelligence 👇

Explore Real-time Analytics
Airbnb Seasonality Analysis & Trends in Santo Domingo de la Calzada (2025)
Peak Season (August, May, April)
- Revenue averages $1,726 per month
- Occupancy rates average 33.9%
- Daily rates average $143
Shoulder Season
- Revenue averages $1,133 per month
- Occupancy maintains around 29.9%
- Daily rates hold near $142
Low Season (January, February, March)
- Revenue drops to average $648 per month
- Occupancy decreases to average 20.1%
- Daily rates adjust to average $129
Seasonality Insights for Santo Domingo de la Calzada
- The Airbnb seasonality in Santo Domingo de la Calzada shows highly seasonal trends requiring careful strategy. While the sections above show seasonal averages, it's also insightful to look at the extremes:
- During the high season, the absolute peak month showcases Santo Domingo de la Calzada's highest earning potential, with monthly revenues capable of climbing to $2,160, occupancy reaching a high of 66.8%, and ADRs peaking at $145.
- Conversely, the slowest single month of the year, typically falling within the low season, marks the market's lowest point. In this month, revenue might dip to $583, occupancy could drop to 14.2%, and ADRs may adjust down to $127.
- Understanding both the seasonal averages and these monthly peaks and troughs in revenue, occupancy, and ADR is crucial for maximizing your Airbnb profit potential in Santo Domingo de la Calzada.
Seasonal Strategies for Maximizing Profit
- Peak Season: Maximize revenue through premium pricing and potentially longer minimum stays. Ensure high availability.
- Low Season: Offer competitive pricing, special promotions (e.g., extended stay discounts), and flexible cancellation policies. Target off-season travelers like remote workers or budget-conscious guests.
- Shoulder Seasons: Implement dynamic pricing that balances peak and low rates. Target weekend travelers or specific events. Offer slightly more flexible terms than peak season.
- Regularly analyze your own performance against these Santo Domingo de la Calzada seasonality benchmarks and adjust your pricing and availability strategy accordingly.
Best Areas for Airbnb Investment in Santo Domingo de la Calzada (2025)
Exploring the top neighborhoods for short-term rentals in Santo Domingo de la Calzada? This section highlights key areas, outlining why they are attractive for hosts and guests, along with notable local attractions. Consider these locations based on your target guest profile and investment strategy.
| Neighborhood / Area | Why Host Here? (Target Guests & Appeal) | Key Attractions & Landmarks |
|---|---|---|
| Old Town | The historic center of Santo Domingo de la Calzada with charming streets and medieval architecture. Attracts tourists interested in history and culture, being close to local restaurants and shops. | Cathedral of Santo Domingo, Plaza Mayor, Historic Market, Santo Domingo Museum of Contemporary Art, Santo Domingo Church |
| Paseo del Espolón | A picturesque boulevard along the river, perfect for leisurely strolls and dining. Popular among visitors for its scenic views and local cuisine. | Espolón Park, Restaurants and Cafes, Río Oja, Café Moderno, Cultural events and Festivals |
| La Plaza de Toros | Area known for its bullring and entertainment venues. It draws those interested in local festivities and shows throughout the year. | Santo Domingo Bullring, Local Tapas Bars, Festivals and Events, Nearby Accommodations |
| Sierra de la Demanda | A mountainous area nearby, perfect for nature lovers and outdoor activities. It attracts tourists seeking adventure and relaxation in nature. | Hiking Trails, Natural Parks, Scenic Views, Winter Sports, Breathtaking Landscapes |
| Catedral del Salvador | A cultural landmark with impressive architecture. Many tourists visit to admire the cathedral and the surrounding area full of history. | Cathedral Facade, Art Exhibitions, Historical Tours, Guided Visits |
| Calle Mayor | An important street in the town with various shops and cafes. It is a lively area that attracts both locals and tourists for shopping and dining. | Local Shops, Restaurants, Cafeterias, Artisans |
| Bodega de la Abuela | An authentic local bodega offering a glimpse into traditional Spanish culture. Visitors enjoy the local gastronomic experience and craftsmanship. | Local Wines, Handmade Crafts, Artisan Food Products, Culinary Workshops |
| Pico de la Demanda | A scenic peak that is popular among hikers and nature enthusiasts. Provides beautiful views and opportunities for outdoor recreation. | Hiking Routes, Nature Exploration, Panoramic Views, Visitor Center |
Understanding Airbnb License Requirements & STR Laws in Santo Domingo de la Calzada (2025)
With 24% of listings showing registration in 2025, understanding potential Airbnb license requirements is crucial in Santo Domingo de la Calzada. Always verify the latest short term rental regulations and Airbnb license requirements directly with local government authorities for Santo Domingo de la Calzada to ensure full compliance before hosting.
(Source: AirROI data, 2025, based on 24% licensed listings)
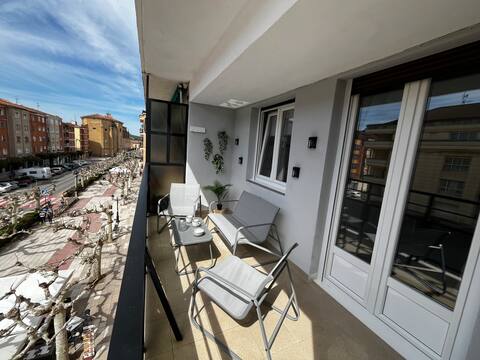
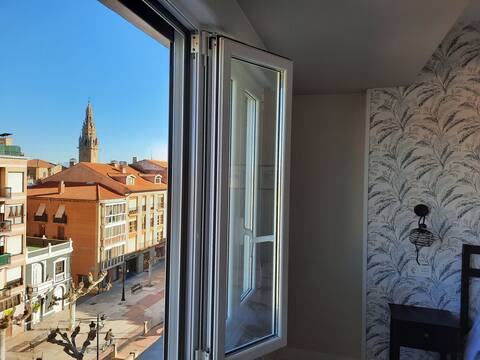
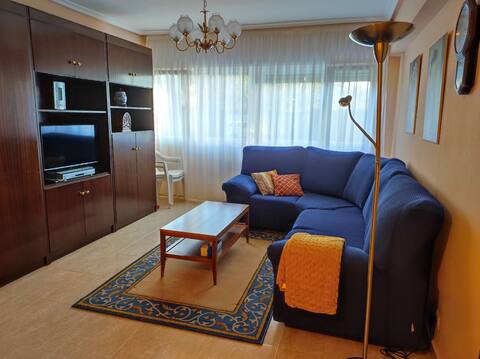
Top Performing Airbnb Properties in Santo Domingo de la Calzada (2025)
Benchmark your potential! Explore examples of top-performing Airbnb properties in Santo Domingo de la Calzadabased on Trailing Twelve Month (TTM) revenue. Analyze their characteristics, revenue, occupancy rate, and ADR to understand what drives success in this market.

La casa de la Calzada
Entire Place • 4 bedrooms
Haunted house: Halloween night
Entire Place • 3 bedrooms

The Wabi Sabi Wall
Entire Place • 2 bedrooms
Villa -Belén
Entire Place • 2 bedrooms
Bright apartment with swimming pool
Entire Place • 3 bedrooms

The "Industrial" Wall
Entire Place • 2 bedrooms
Note: Performance varies based on location, size, amenities, seasonality, and management quality. Data reflects the past 12 months.
Top Performing Airbnb Hosts in Santo Domingo de la Calzada (2025)
Learn from the best! This table showcases top-performing Airbnb hosts in Santo Domingo de la Calzada based on the number of properties managed and estimated total revenue over the past year. Analyze their scale and performance metrics.
| Host Name | Properties | Grossing Revenue | Stay Reviews | Avg Rating |
|---|---|---|---|---|
| Virginia | 2 | $38,486 | 24 | 4.87/5.0 |
| Alvaro | 1 | $26,131 | 14 | 4.93/5.0 |
| Uxue | 1 | $23,186 | 28 | 4.89/5.0 |
| Jennifer | 2 | $18,792 | 102 | 4.74/5.0 |
| Belén | 1 | $17,941 | 16 | 5.00/5.0 |
| Gotzon | 1 | $17,283 | 10 | 4.50/5.0 |
| Luis | 3 | $15,250 | 46 | 4.71/5.0 |
| María | 1 | $13,601 | 14 | 4.86/5.0 |
| Jorge | 1 | $8,988 | 38 | 4.74/5.0 |
| Ana Belén | 2 | $8,793 | 114 | 4.82/5.0 |
Analyzing the strategies of top hosts, such as their property selection, pricing, and guest communication, can offer valuable lessons for optimizing your own Airbnb operations in Santo Domingo de la Calzada.
Dive Deeper: Advanced Santo Domingo de la Calzada STR Market Data (2025)
Ready to unlock more insights? AirROI provides access to advanced metrics and comprehensive Airbnb data for Santo Domingo de la Calzada. Explore detailed analytics beyond this report to refine your investment strategy, optimize pricing, and maximize your vacation rental profits.
Explore Advanced MetricsSanto Domingo de la Calzada Short-Term Rental Market Composition (2025): Property & Room Types
Room Type Distribution
Property Type Distribution
Market Composition Insights for Santo Domingo de la Calzada
- The Santo Domingo de la Calzada Airbnb market composition is heavily skewed towards Entire Home/Apt listings, which make up 100% of the 21 active rentals. This indicates strong guest preference for privacy and space.
- Looking at the property type distribution in Santo Domingo de la Calzada, Apartment/Condo properties are the most common (85.7%), reflecting the local real estate landscape.
Santo Domingo de la Calzada Airbnb Room Capacity Analysis (2025): Bedroom Distribution
Distribution of Listings by Number of Bedrooms
Room Capacity Insights for Santo Domingo de la Calzada
- The dominant room capacity in Santo Domingo de la Calzada is 3 bedrooms listings, making up 38.1% of the market. This suggests a strong demand for properties suitable for families or small groups.
- Together, 3 bedrooms and 2 bedrooms properties represent 71.4% of the active Airbnb listings in Santo Domingo de la Calzada, indicating a high concentration in these sizes.
- A significant 52.4% of listings offer 3+ bedrooms, catering to larger groups and families seeking more space in Santo Domingo de la Calzada.
Santo Domingo de la Calzada Vacation Rental Guest Capacity Trends (2025)
Distribution of Listings by Guest Capacity
Guest Capacity Insights for Santo Domingo de la Calzada
- The most common guest capacity trend in Santo Domingo de la Calzada vacation rentals is listings accommodating 6 guests (42.9%). This suggests the primary traveler segment is likely larger groups.
- Properties designed for 6 guests and 5 guests dominate the Santo Domingo de la Calzada STR market, accounting for 61.9% of listings.
- 52.4% of properties accommodate 6+ guests, serving the market segment for larger families or group travel in Santo Domingo de la Calzada.
- On average, properties in Santo Domingo de la Calzada are equipped to host 5.1 guests.
Santo Domingo de la Calzada Airbnb Booking Patterns (2025): Available vs. Booked Days
Available Days Distribution
Booked Days Distribution
Booking Pattern Insights for Santo Domingo de la Calzada
- The most common availability pattern in Santo Domingo de la Calzada falls within the 271-366 days range, representing 66.7% of listings. This suggests many properties have significant open periods on their calendars.
- Approximately 81.0% of listings show high availability (181+ days open annually), indicating potential for increased bookings or specific owner usage patterns.
- For booked days, the 31-90 days range is most frequent in Santo Domingo de la Calzada (38.1%), reflecting common guest stay durations or potential owner blocking patterns.
- A notable 19.0% of properties secure long booking periods (181+ days booked per year), highlighting successful long-term rental strategies or significant owner usage.
Santo Domingo de la Calzada Airbnb Minimum Stay Requirements Analysis
Distribution of Listings by Minimum Night Requirement
1 Night
7 listings
36.8% of total
2 Nights
5 listings
26.3% of total
4-6 Nights
3 listings
15.8% of total
30+ Nights
4 listings
21.1% of total
Key Insights
- The most prevalent minimum stay requirement in Santo Domingo de la Calzada is 1 Night, adopted by 36.8% of listings. This highlights the market's preference for shorter, flexible bookings.
- A strong majority (63.1%) of the Santo Domingo de la Calzada Airbnb data shows acceptance of very short stays (1-2 nights), indicating a dynamic, high-turnover market.
- A significant segment (21.1%) caters to monthly stays (30+ nights) in Santo Domingo de la Calzada, pointing to opportunities in the extended-stay market.
Recommendations
- Align with the market by considering a 1 Night minimum stay, as 36.8% of Santo Domingo de la Calzada hosts use this setting.
- Explore offering discounts for stays of 30+ nights to attract the 21.1% of the market seeking extended stays.
- Adjust minimum nights based on seasonality – potentially shorter during low season and longer during peak demand periods in Santo Domingo de la Calzada.
Santo Domingo de la Calzada Airbnb Cancellation Policy Trends Analysis (2025)
Flexible
4 listings
20% of total
Moderate
9 listings
45% of total
Firm
1 listings
5% of total
Strict
6 listings
30% of total
Cancellation Policy Insights for Santo Domingo de la Calzada
- The prevailing Airbnb cancellation policy trend in Santo Domingo de la Calzada is Moderate, used by 45% of listings.
- There's a relatively balanced mix between guest-friendly (65.0%) and stricter (35.0%) policies, offering choices for different guest needs.
Recommendations for Hosts
- Consider adopting a Moderate policy to align with the 45% market standard in Santo Domingo de la Calzada.
- Regularly review your cancellation policy against competitors and market demand shifts in Santo Domingo de la Calzada.
Santo Domingo de la Calzada STR Booking Lead Time Analysis (2025)
Average Booking Lead Time by Month
Booking Lead Time Insights for Santo Domingo de la Calzada
- The overall average booking lead time for vacation rentals in Santo Domingo de la Calzada is 38 days.
- Guests book furthest in advance for stays during July (average 79 days), likely coinciding with peak travel demand or local events.
- The shortest booking windows occur for stays in March (average 10 days), indicating more last-minute travel plans during this time.
- Seasonally, Summer (49 days avg.) sees the longest lead times, while Winter (19 days avg.) has the shortest, reflecting typical travel planning cycles.
Recommendations for Hosts
- Use the overall average lead time (38 days) as a baseline for your pricing and availability strategy in Santo Domingo de la Calzada.
- For July stays, consider implementing length-of-stay discounts or slightly higher rates for bookings made less than 79 days out to capitalize on advance planning.
- During March, focus on last-minute booking availability and promotions, as guests book with very short notice (10 days avg.).
- Target marketing efforts for the Summer season well in advance (at least 49 days) to capture early planners.
- Monitor your own booking lead times against these Santo Domingo de la Calzada averages to identify opportunities for dynamic pricing adjustments.
Popular & Essential Airbnb Amenities in Santo Domingo de la Calzada (2025)
Amenity Prevalence
Amenity Insights for Santo Domingo de la Calzada
- Essential amenities in Santo Domingo de la Calzada that guests expect include: TV, Kitchen, Heating, Hangers, Hair dryer, Dishes and silverware, Essentials. Lacking these (any) could significantly impact bookings.
- Popular amenities like Bed linens, Microwave, Coffee maker are common but not universal. Offering these can provide a competitive edge.
Recommendations for Hosts
- Ensure your listing includes all essential amenities for Santo Domingo de la Calzada: TV, Kitchen, Heating, Hangers, Hair dryer, Dishes and silverware, Essentials.
- Prioritize adding missing essentials: Hangers, Hair dryer, Dishes and silverware, Essentials.
- Consider adding popular differentiators like Bed linens or Microwave to increase appeal.
- Highlight unique or less common amenities you offer (e.g., hot tub, dedicated workspace, EV charger) in your listing description and photos.
- Regularly check competitor amenities in Santo Domingo de la Calzada to stay competitive.
Santo Domingo de la Calzada Airbnb Guest Demographics & Profile Analysis (2025)
Guest Profile Summary for Santo Domingo de la Calzada
- The typical guest profile for Airbnb in Santo Domingo de la Calzada consists of a mix of domestic (57%) and international guests, often arriving from nearby Madrid, typically belonging to the Post-2000s (Gen Z/Alpha) group (50%), primarily speaking Spanish or English.
- Domestic travelers account for 57.0% of guests.
- Key international markets include Spain (57%) and France (12.4%).
- Top languages spoken are Spanish (35.3%) followed by English (32.4%).
- A significant demographic segment is the Post-2000s (Gen Z/Alpha) group, representing 50% of guests.
Recommendations for Hosts
- Balance marketing efforts between domestic and international channels based on the guest mix.
- Tailor amenities and listing descriptions to appeal to the dominant Post-2000s (Gen Z/Alpha) demographic (e.g., highlight fast WiFi, smart home features, local guides).
- Highlight unique local experiences or amenities relevant to the primary guest profile.
- Consider seasonal promotions aligned with peak travel times for key origin markets.
Nearby Short-Term Rental Market Comparison
How does the Santo Domingo de la Calzada Airbnb market stack up against its neighbors? Compare key performance metrics like average monthly revenue, ADR, and occupancy rates in surrounding areas to understand the broader regional STR landscape.
| Market | Active Properties | Monthly Revenue | Daily Rate | Avg. Occupancy |
|---|---|---|---|---|
| San Sebastián | 1,426 | $3,546 | $262.81 | 49% |
| Gautegiz Arteaga | 21 | $2,865 | $293.66 | 38% |
| Labastida/Bastida | 11 | $2,662 | $268.80 | 34% |
| Barrika | 13 | $2,629 | $314.61 | 41% |
| Esteribar | 20 | $2,574 | $276.81 | 32% |
| Hernani | 11 | $2,572 | $345.16 | 40% |
| Sotosalbos | 10 | $2,467 | $316.62 | 25% |
| Dima | 11 | $2,422 | $332.91 | 42% |
| Larraun | 18 | $2,387 | $225.55 | 40% |
| Erandio | 16 | $2,361 | $164.90 | 56% |