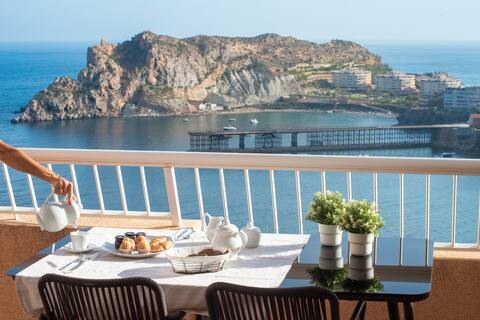
Águilas Airbnb Market Analysis 2025: Short Term Rental Data & Vacation Rental Statistics in Region of Murcia, Spain
Is Airbnb profitable in Águilas in 2025? Explore comprehensive Airbnb analytics for Águilas, Region of Murcia, Spain to uncover income potential. This 2025 STR market report for Águilas, based on AirROI data from April 2024 to March 2025, reveals key trends in the market of 297 active listings.
Whether you're considering an Airbnb investment in Águilas, optimizing your existing vacation rental, or exploring rental arbitrage opportunities, understanding the Águilas Airbnb data is crucial. Understanding the local regulations is key to maximizing your short term rental income potential. Let's dive into the specifics.
Key Águilas Airbnb Performance Metrics Overview
Monthly Airbnb Revenue Variations & Income Potential in Águilas (2025)
Understanding the monthly revenue variations for Airbnb listings in Águilas is key to maximizing your short term rental income potential. Seasonality significantly impacts earnings. Our analysis, based on data from the past 12 months, shows that the peak revenue month for STRs in Águilas is typically August, while February often presents the lowest earnings, highlighting opportunities for strategic pricing adjustments during shoulder and low seasons. Explore the typical Airbnb income in Águilas across different performance tiers:
- Best-in-class properties (Top 10%) achieve $3,165+ monthly, often utilizing dynamic pricing and superior guest experiences.
- Strong performing properties (Top 25%) earn $2,092 or more, indicating effective management and desirable locations/amenities.
- Typical properties (Median) generate around $1,184 per month, representing the average market performance.
- Entry-level properties (Bottom 25%) see earnings around $577, often with potential for optimization.
Average Monthly Airbnb Earnings Trend in Águilas
Águilas Airbnb Occupancy Rate Trends (2025)
Maximize your bookings by understanding the Águilas STR occupancy trends. Seasonal demand shifts significantly influence how often properties are booked. Typically, Augustsees the highest demand (peak season occupancy), while March experiences the lowest (low season). Effective strategies, like adjusting minimum stays or offering promotions, can boost occupancy during slower periods. Here's how different property tiers perform in Águilas:
- Best-in-class properties (Top 10%) achieve 72%+ occupancy, indicating high desirability and potentially optimized availability.
- Strong performing properties (Top 25%) maintain 51% or higher occupancy, suggesting good market fit and guest satisfaction.
- Typical properties (Median) have an occupancy rate around 30%.
- Entry-level properties (Bottom 25%) average 16% occupancy, potentially facing higher vacancy.
Average Monthly Occupancy Rate Trend in Águilas
Average Daily Rate (ADR) Airbnb Trends in Águilas (2025)
Effective short term rental pricing strategy in Águilas involves understanding monthly ADR fluctuations. The Average Daily Rate (ADR) for Airbnb in Águilas typically peaks in August and dips lowest during January. Leveraging Airbnb dynamic pricing tools or strategies based on this seasonality can significantly boost revenue. Here's a look at the typical nightly rates achieved:
- Best-in-class properties (Top 10%) command rates of $209+ per night, often due to premium features or locations.
- Strong performing properties (Top 25%) achieve nightly rates of $140 or more.
- Typical properties (Median) charge around $100 per night.
- Entry-level properties (Bottom 25%) earn around $78 per night.
Average Daily Rate (ADR) Trend by Month in Águilas
Get Live Águilas Market Intelligence 👇

Explore Real-time Analytics
Airbnb Seasonality Analysis & Trends in Águilas (2025)
Peak Season (August, July, June)
- Revenue averages $2,501 per month
- Occupancy rates average 49.5%
- Daily rates average $139
Shoulder Season
- Revenue averages $1,407 per month
- Occupancy maintains around 33.5%
- Daily rates hold near $123
Low Season (February, March, December)
- Revenue drops to average $876 per month
- Occupancy decreases to average 25.2%
- Daily rates adjust to average $116
Seasonality Insights for Águilas
- The Airbnb seasonality in Águilas shows highly seasonal trends requiring careful strategy. While the sections above show seasonal averages, it's also insightful to look at the extremes:
- During the high season, the absolute peak month showcases Águilas's highest earning potential, with monthly revenues capable of climbing to $3,161, occupancy reaching a high of 62.8%, and ADRs peaking at $143.
- Conversely, the slowest single month of the year, typically falling within the low season, marks the market's lowest point. In this month, revenue might dip to $865, occupancy could drop to 24.6%, and ADRs may adjust down to $112.
- Understanding both the seasonal averages and these monthly peaks and troughs in revenue, occupancy, and ADR is crucial for maximizing your Airbnb profit potential in Águilas.
Seasonal Strategies for Maximizing Profit
- Peak Season: Maximize revenue through premium pricing and potentially longer minimum stays. Ensure high availability.
- Low Season: Offer competitive pricing, special promotions (e.g., extended stay discounts), and flexible cancellation policies. Target off-season travelers like remote workers or budget-conscious guests.
- Shoulder Seasons: Implement dynamic pricing that balances peak and low rates. Target weekend travelers or specific events. Offer slightly more flexible terms than peak season.
- Regularly analyze your own performance against these Águilas seasonality benchmarks and adjust your pricing and availability strategy accordingly.
Best Areas for Airbnb Investment in Águilas (2025)
Exploring the top neighborhoods for short-term rentals in Águilas? This section highlights key areas, outlining why they are attractive for hosts and guests, along with notable local attractions. Consider these locations based on your target guest profile and investment strategy.
| Neighborhood / Area | Why Host Here? (Target Guests & Appeal) | Key Attractions & Landmarks |
|---|---|---|
| Las Delicias Beach | A beautiful beachfront area perfect for sunbathers and water sports enthusiasts. It offers stunning views and easy access to local restaurants and shops. | Las Delicias Beach, Aguillas Aquarium, Aquapark, Marina de Águilas, promenade |
| Cabo de Palos | A picturesque coastal village known for its diving spots and clear waters. Great for travelers looking for a laid-back atmosphere and nature activities. | Cabo de Palos Lighthouse, Islas Hormigas Marine Reserve, diving spots, local seafood restaurants |
| Águilas Old Town | Rich in history and charm, this area features traditional architecture and cultural landmarks. It attracts visitors interested in history and local culture. | Águilas Castle, Church of San José, Plaza de España, local markets |
| Bulgaras Beach | A tranquil beach area ideal for families and relaxation. The calm waters and clean sands make it a favorite for beachgoers. | Bulgaras Beach, beach bars, water sports, picnic spots |
| San Juan de los Terreros | A coastal area known for its beautiful beaches and scenic landscapes. It's perfect for families and those seeking outdoor activities. | San Juan de los Terreros Beach, coves and cliffs, water sports, hiking trails |
| Puntas de Calnegre | Remote and natural beaches that offer a peaceful retreat away from the city. Great for nature lovers and secluded getaways. | Puntas de Calnegre Beach, natural parks, hiking areas |
| La Higuerica Beach | A popular beach with families, offering clear waters and various amenities. Perfect for those looking for beach facilities. | La Higuerica Beach, bars and restaurants, water sports rentals |
| Ramblaskala | An up-and-coming neighborhood that offers convenient access to both the beach and town. Suitable for tourists looking for a residential feel. | local shops, cafes, easy access to beaches, quiet streets |
Understanding Airbnb License Requirements & STR Laws in Águilas (2025)
With 16% of listings showing registration in 2025, understanding potential Airbnb license requirements is crucial in Águilas. Always verify the latest short term rental regulations and Airbnb license requirements directly with local government authorities for Águilas to ensure full compliance before hosting.
(Source: AirROI data, 2025, based on 16% licensed listings)
Top Performing Airbnb Properties in Águilas (2025)
Benchmark your potential! Explore examples of top-performing Airbnb properties in Águilasbased on Trailing Twelve Month (TTM) revenue. Analyze their characteristics, revenue, occupancy rate, and ADR to understand what drives success in this market.
Villa en Águilas
Entire Place • 4 bedrooms
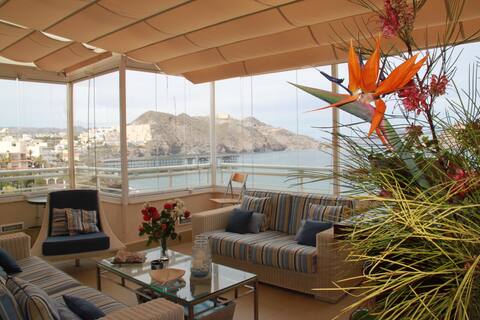
Penthouse Two Bahías
Entire Place • 4 bedrooms
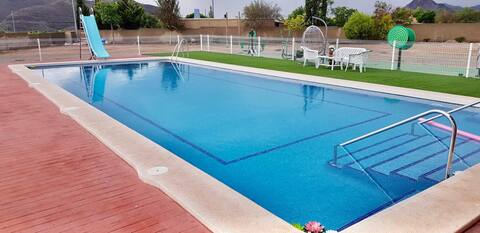
Villa Cocon: 5mn beach, Pool, Ideal Families
Entire Place • 5 bedrooms
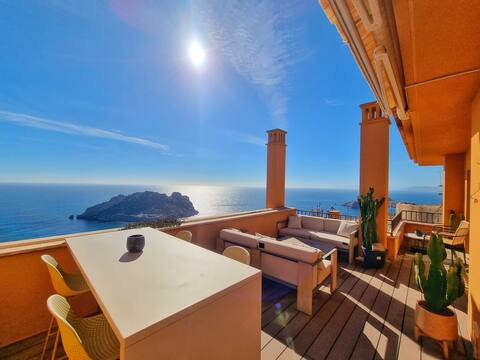
Oasis of luxury and tranquility by Aloha Palma
Entire Place • 2 bedrooms
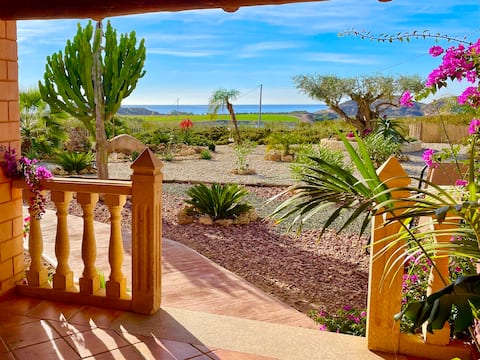
Mediterranean house
Entire Place • 3 bedrooms

Calabardina - Walk to the beach or the mountain
Entire Place • 3 bedrooms
Note: Performance varies based on location, size, amenities, seasonality, and management quality. Data reflects the past 12 months.
Top Performing Airbnb Hosts in Águilas (2025)
Learn from the best! This table showcases top-performing Airbnb hosts in Águilas based on the number of properties managed and estimated total revenue over the past year. Analyze their scale and performance metrics.
| Host Name | Properties | Grossing Revenue | Stay Reviews | Avg Rating |
|---|---|---|---|---|
| Aloha | 48 | $641,093 | 467 | 3.26/5.0 |
| Grupo Geraneos | 3 | $100,333 | 40 | 4.92/5.0 |
| Jose Maria | 6 | $82,576 | 73 | 3.94/5.0 |
| José Carlos | 1 | $55,341 | 10 | 5.00/5.0 |
| Maria Teresa | 1 | $54,130 | 4 | 5.00/5.0 |
| Carine | 1 | $51,281 | 23 | 4.96/5.0 |
| Javier | 1 | $46,832 | 18 | 4.94/5.0 |
| Mick | 1 | $46,828 | 36 | 4.86/5.0 |
| Host #141523992 | 2 | $43,592 | 2 | 0.00/5.0 |
| Joaquín De JITKEY COM | 2 | $40,984 | 13 | 4.85/5.0 |
Analyzing the strategies of top hosts, such as their property selection, pricing, and guest communication, can offer valuable lessons for optimizing your own Airbnb operations in Águilas.
Dive Deeper: Advanced Águilas STR Market Data (2025)
Ready to unlock more insights? AirROI provides access to advanced metrics and comprehensive Airbnb data for �Águilas. Explore detailed analytics beyond this report to refine your investment strategy, optimize pricing, and maximize your vacation rental profits.
Explore Advanced MetricsÁguilas Short-Term Rental Market Composition (2025): Property & Room Types
Room Type Distribution
Property Type Distribution
Market Composition Insights for Águilas
- The Águilas Airbnb market composition is heavily skewed towards Entire Home/Apt listings, which make up 97% of the 297 active rentals. This indicates strong guest preference for privacy and space.
- Looking at the property type distribution in Águilas, Apartment/Condo properties are the most common (73.1%), reflecting the local real estate landscape.
- Houses represent a significant 24.6% portion, catering likely to families or larger groups.
- Smaller segments like hotel/boutique, others, outdoor/unique (combined 2.3%) offer potential for unique stay experiences.
Águilas Airbnb Room Capacity Analysis (2025): Bedroom Distribution
Distribution of Listings by Number of Bedrooms
Room Capacity Insights for Águilas
- The dominant room capacity in Águilas is 2 bedrooms listings, making up 42.4% of the market. This suggests a strong demand for properties suitable for couples or solo travelers.
- Together, 2 bedrooms and 3 bedrooms properties represent 73.4% of the active Airbnb listings in Águilas, indicating a high concentration in these sizes.
- A significant 43.4% of listings offer 3+ bedrooms, catering to larger groups and families seeking more space in Águilas.
Águilas Vacation Rental Guest Capacity Trends (2025)
Distribution of Listings by Guest Capacity
Guest Capacity Insights for Águilas
- The most common guest capacity trend in Águilas vacation rentals is listings accommodating 4 guests (30%). This suggests the primary traveler segment is likely small families or groups.
- Properties designed for 4 guests and 6 guests dominate the Águilas STR market, accounting for 54.2% of listings.
- 41.4% of properties accommodate 6+ guests, serving the market segment for larger families or group travel in Águilas.
- On average, properties in Águilas are equipped to host 5.1 guests.
Águilas Airbnb Booking Patterns (2025): Available vs. Booked Days
Available Days Distribution
Booked Days Distribution
Booking Pattern Insights for Águilas
- The most common availability pattern in Águilas falls within the 271-366 days range, representing 60.6% of listings. This suggests many properties have significant open periods on their calendars.
- Approximately 90.2% of listings show high availability (181+ days open annually), indicating potential for increased bookings or specific owner usage patterns.
- For booked days, the 31-90 days range is most frequent in Águilas (36.7%), reflecting common guest stay durations or potential owner blocking patterns.
- A notable 10.4% of properties secure long booking periods (181+ days booked per year), highlighting successful long-term rental strategies or significant owner usage.
Águilas Airbnb Minimum Stay Requirements Analysis
Distribution of Listings by Minimum Night Requirement
1 Night
18 listings
6.7% of total
2 Nights
96 listings
35.8% of total
3 Nights
26 listings
9.7% of total
4-6 Nights
51 listings
19% of total
7-29 Nights
17 listings
6.3% of total
30+ Nights
60 listings
22.4% of total
Key Insights
- The most prevalent minimum stay requirement in Águilas is 2 Nights, adopted by 35.8% of listings. This highlights the market's preference for shorter, flexible bookings.
- A significant segment (22.4%) caters to monthly stays (30+ nights) in Águilas, pointing to opportunities in the extended-stay market.
Recommendations
- Align with the market by considering a 2 Nights minimum stay, as 35.8% of Águilas hosts use this setting.
- If feasible, allowing 1-night stays, especially midweek or during low season, could capture last-minute bookings, as only 6.7% currently do.
- A 2-night minimum appears standard (35.8%). Consider this for weekends or peak periods.
- Explore offering discounts for stays of 30+ nights to attract the 22.4% of the market seeking extended stays.
- Adjust minimum nights based on seasonality – potentially shorter during low season and longer during peak demand periods in Águilas.
Águilas Airbnb Cancellation Policy Trends Analysis (2025)
Super Strict 60 Days
2 listings
0.9% of total
Flexible
48 listings
22.5% of total
Moderate
53 listings
24.9% of total
Firm
74 listings
34.7% of total
Strict
36 listings
16.9% of total
Cancellation Policy Insights for Águilas
- The prevailing Airbnb cancellation policy trend in Águilas is Firm, used by 34.7% of listings.
- A majority (51.6%) of hosts in Águilas utilize Firm or Strict policies, indicating a market where hosts prioritize booking security.
Recommendations for Hosts
- Consider adopting a Firm policy to align with the 34.7% market standard in Águilas.
- Regularly review your cancellation policy against competitors and market demand shifts in Águilas.
Águilas STR Booking Lead Time Analysis (2025)
Average Booking Lead Time by Month
Booking Lead Time Insights for Águilas
- The overall average booking lead time for vacation rentals in Águilas is 50 days.
- Guests book furthest in advance for stays during July (average 88 days), likely coinciding with peak travel demand or local events.
- The shortest booking windows occur for stays in December (average 44 days), indicating more last-minute travel plans during this time.
- Seasonally, Summer (82 days avg.) sees the longest lead times, while Winter (52 days avg.) has the shortest, reflecting typical travel planning cycles.
Recommendations for Hosts
- Use the overall average lead time (50 days) as a baseline for your pricing and availability strategy in Águilas.
- For July stays, consider implementing length-of-stay discounts or slightly higher rates for bookings made less than 88 days out to capitalize on advance planning.
- Target marketing efforts for the Summer season well in advance (at least 82 days) to capture early planners.
- Monitor your own booking lead times against these Águilas averages to identify opportunities for dynamic pricing adjustments.
Popular & Essential Airbnb Amenities in Águilas (2025)
Amenity Prevalence
Amenity Insights for Águilas
- Essential amenities in Águilas that guests expect include: Kitchen, TV, Washer. Lacking these (any) could significantly impact bookings.
- Popular amenities like Hot water, Essentials, Wifi are common but not universal. Offering these can provide a competitive edge.
- Warning: Wifi is not universally provided but is considered essential globally. Ensure reliable Wifi is offered.
Recommendations for Hosts
- Ensure your listing includes all essential amenities for Águilas: Kitchen, TV, Washer.
- Prioritize adding missing essentials: Kitchen, TV, Washer.
- Consider adding popular differentiators like Hot water or Essentials to increase appeal.
- Highlight unique or less common amenities you offer (e.g., hot tub, dedicated workspace, EV charger) in your listing description and photos.
- Regularly check competitor amenities in Águilas to stay competitive.
Águilas Airbnb Guest Demographics & Profile Analysis (2025)
Guest Profile Summary for Águilas
- The typical guest profile for Airbnb in Águilas consists of a mix of domestic (65%) and international guests, often arriving from nearby Madrid, typically belonging to the Post-2000s (Gen Z/Alpha) group (50%), primarily speaking Spanish or English.
- Domestic travelers account for 65.0% of guests.
- Key international markets include Spain (65%) and France (8.5%).
- Top languages spoken are Spanish (34.6%) followed by English (31.5%).
- A significant demographic segment is the Post-2000s (Gen Z/Alpha) group, representing 50% of guests.
Recommendations for Hosts
- Target domestic marketing efforts towards travelers from Madrid and Murcia.
- Tailor amenities and listing descriptions to appeal to the dominant Post-2000s (Gen Z/Alpha) demographic (e.g., highlight fast WiFi, smart home features, local guides).
- Highlight unique local experiences or amenities relevant to the primary guest profile.
- Consider seasonal promotions aligned with peak travel times for key origin markets.
Nearby Short-Term Rental Market Comparison
How does the Águilas Airbnb market stack up against its neighbors? Compare key performance metrics like average monthly revenue, ADR, and occupancy rates in surrounding areas to understand the broader regional STR landscape.
| Market | Active Properties | Monthly Revenue | Daily Rate | Avg. Occupancy |
|---|---|---|---|---|
| Sella | 13 | $2,052 | $191.28 | 43% |
| Mutxamel | 91 | $1,899 | $190.33 | 43% |
| Agost | 11 | $1,887 | $169.85 | 34% |
| el Campello | 911 | $1,719 | $168.00 | 49% |
| Polop | 55 | $1,713 | $238.59 | 40% |
| Callosa d'en Sarrià | 30 | $1,692 | $225.31 | 38% |
| Altea | 894 | $1,657 | $185.18 | 44% |
| Benijófar | 24 | $1,647 | $165.65 | 50% |
| Monforte del Cid | 12 | $1,614 | $204.73 | 38% |
| l'Atzúbia | 17 | $1,591 | $234.43 | 47% |