Caravaca de la Cruz Airbnb Market Analysis 2025: Short Term Rental Data & Vacation Rental Statistics in Noroeste, Spain
Is Airbnb profitable in Caravaca de la Cruz in 2025? Explore comprehensive Airbnb analytics for Caravaca de la Cruz, Noroeste, Spain to uncover income potential. This 2025 STR market report for Caravaca de la Cruz, based on AirROI data from April 2024 to March 2025, reveals key trends in the niche market of 49 active listings.
Whether you're considering an Airbnb investment in Caravaca de la Cruz, optimizing your existing vacation rental, or exploring rental arbitrage opportunities, understanding the Caravaca de la Cruz Airbnb data is crucial. Understanding the local regulations is key to maximizing your short term rental income potential. Let's dive into the specifics.
Key Caravaca de la Cruz Airbnb Performance Metrics Overview
Monthly Airbnb Revenue Variations & Income Potential in Caravaca de la Cruz (2025)
Understanding the monthly revenue variations for Airbnb listings in Caravaca de la Cruz is key to maximizing your short term rental income potential. Seasonality significantly impacts earnings. Our analysis, based on data from the past 12 months, shows that the peak revenue month for STRs in Caravaca de la Cruz is typically August, while October often presents the lowest earnings, highlighting opportunities for strategic pricing adjustments during shoulder and low seasons. Explore the typical Airbnb income in Caravaca de la Cruz across different performance tiers:
- Best-in-class properties (Top 10%) achieve $3,109+ monthly, often utilizing dynamic pricing and superior guest experiences.
- Strong performing properties (Top 25%) earn $1,887 or more, indicating effective management and desirable locations/amenities.
- Typical properties (Median) generate around $783 per month, representing the average market performance.
- Entry-level properties (Bottom 25%) see earnings around $349, often with potential for optimization.
Average Monthly Airbnb Earnings Trend in Caravaca de la Cruz
Caravaca de la Cruz Airbnb Occupancy Rate Trends (2025)
Maximize your bookings by understanding the Caravaca de la Cruz STR occupancy trends. Seasonal demand shifts significantly influence how often properties are booked. Typically, Augustsees the highest demand (peak season occupancy), while May experiences the lowest (low season). Effective strategies, like adjusting minimum stays or offering promotions, can boost occupancy during slower periods. Here's how different property tiers perform in Caravaca de la Cruz:
- Best-in-class properties (Top 10%) achieve 59%+ occupancy, indicating high desirability and potentially optimized availability.
- Strong performing properties (Top 25%) maintain 36% or higher occupancy, suggesting good market fit and guest satisfaction.
- Typical properties (Median) have an occupancy rate around 20%.
- Entry-level properties (Bottom 25%) average 10% occupancy, potentially facing higher vacancy.
Average Monthly Occupancy Rate Trend in Caravaca de la Cruz
Average Daily Rate (ADR) Airbnb Trends in Caravaca de la Cruz (2025)
Effective short term rental pricing strategy in Caravaca de la Cruz involves understanding monthly ADR fluctuations. The Average Daily Rate (ADR) for Airbnb in Caravaca de la Cruz typically peaks in July and dips lowest during March. Leveraging Airbnb dynamic pricing tools or strategies based on this seasonality can significantly boost revenue. Here's a look at the typical nightly rates achieved:
- Best-in-class properties (Top 10%) command rates of $279+ per night, often due to premium features or locations.
- Strong performing properties (Top 25%) achieve nightly rates of $187 or more.
- Typical properties (Median) charge around $117 per night.
- Entry-level properties (Bottom 25%) earn around $73 per night.
Average Daily Rate (ADR) Trend by Month in Caravaca de la Cruz
Get Live Caravaca de la Cruz Market Intelligence 👇

Explore Real-time Analytics
Airbnb Seasonality Analysis & Trends in Caravaca de la Cruz (2025)
Peak Season (August, July, June)
- Revenue averages $2,244 per month
- Occupancy rates average 34.0%
- Daily rates average $174
Shoulder Season
- Revenue averages $1,208 per month
- Occupancy maintains around 24.2%
- Daily rates hold near $155
Low Season (January, October, November)
- Revenue drops to average $893 per month
- Occupancy decreases to average 23.1%
- Daily rates adjust to average $151
Seasonality Insights for Caravaca de la Cruz
- The Airbnb seasonality in Caravaca de la Cruz shows highly seasonal trends requiring careful strategy. While the sections above show seasonal averages, it's also insightful to look at the extremes:
- During the high season, the absolute peak month showcases Caravaca de la Cruz's highest earning potential, with monthly revenues capable of climbing to $2,770, occupancy reaching a high of 45.7%, and ADRs peaking at $175.
- Conversely, the slowest single month of the year, typically falling within the low season, marks the market's lowest point. In this month, revenue might dip to $761, occupancy could drop to 18.9%, and ADRs may adjust down to $136.
- Understanding both the seasonal averages and these monthly peaks and troughs in revenue, occupancy, and ADR is crucial for maximizing your Airbnb profit potential in Caravaca de la Cruz.
Seasonal Strategies for Maximizing Profit
- Peak Season: Maximize revenue through premium pricing and potentially longer minimum stays. Ensure high availability.
- Low Season: Offer competitive pricing, special promotions (e.g., extended stay discounts), and flexible cancellation policies. Target off-season travelers like remote workers or budget-conscious guests.
- Shoulder Seasons: Implement dynamic pricing that balances peak and low rates. Target weekend travelers or specific events. Offer slightly more flexible terms than peak season.
- Regularly analyze your own performance against these Caravaca de la Cruz seasonality benchmarks and adjust your pricing and availability strategy accordingly.
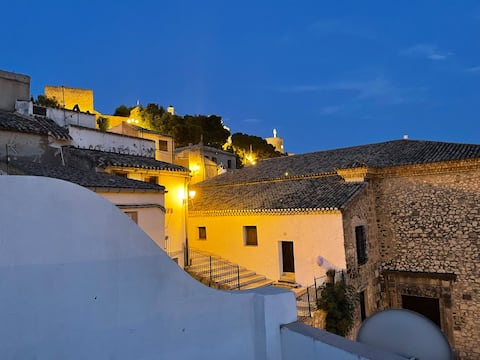
Best Areas for Airbnb Investment in Caravaca de la Cruz (2025)
Exploring the top neighborhoods for short-term rentals in Caravaca de la Cruz? This section highlights key areas, outlining why they are attractive for hosts and guests, along with notable local attractions. Consider these locations based on your target guest profile and investment strategy.
| Neighborhood / Area | Why Host Here? (Target Guests & Appeal) | Key Attractions & Landmarks |
|---|---|---|
| Old Town | Historic center with medieval architecture and cultural significance. A prime spot for tourists interested in history, churches, and local traditions. | Caravaca de la Cruz Castle, Church of the Vera Cruz, Plaza del Templete, Museo de la Fiesta, Sanctuary of Vera Cruz |
| Natural Park of Las Canadas | Beautiful natural park perfect for outdoor enthusiasts and nature lovers. Offers hiking trails and stunning views, attracting tourists seeking adventure. | Hiking trails, Bird watching, Mountain views, Picnic areas, Flora and fauna diversity |
| Cultural District | Area rich in local culture and traditions, attracting those interested in local festivals and culinary experiences. | Local Festivals, Gastronomic events, Artisan shops, Museums, Cultural performances |
| San Jose | Residential area with local charm and easy access to local amenities and attractions. Great for families and long-term stays. | Local parks, Shopping areas, Cafes, Restaurants, Community events |
| La Muela | Scenic area known for its natural beauty and rural tourism. Ideal for visitors looking for tranquility away from city life. | Hiking routes, Natural landscapes, Rural tourism experiences, Local farms, Organic markets |
| Golf Courses | Attractive spot for golf enthusiasts and leisure travelers, providing sports facilities and a relaxing environment. | Local golf clubs, Luxury resorts, Spa facilities, Beautiful landscapes, Dining options |
| Fiesta Area | Known for its vibrant nightlife and social activities, perfect for younger travelers looking for entertainment and excitement. | Bars and clubs, Live music venues, Outdoor events, Street performances, Night markets |
| Art and Craft District | Area dedicated to local artisans and artists, attracting visitors interested in buying unique crafts and art pieces. | Workshops, Art exhibitions, Craft fairs, Local artisan shops, Cultural exchanges |
Understanding Airbnb License Requirements & STR Laws in Caravaca de la Cruz (2025)
With 22% of listings showing registration in 2025, understanding potential Airbnb license requirements is crucial in Caravaca de la Cruz. Always verify the latest short term rental regulations and Airbnb license requirements directly with local government authorities for Caravaca de la Cruz to ensure full compliance before hosting.
(Source: AirROI data, 2025, based on 22% licensed listings)
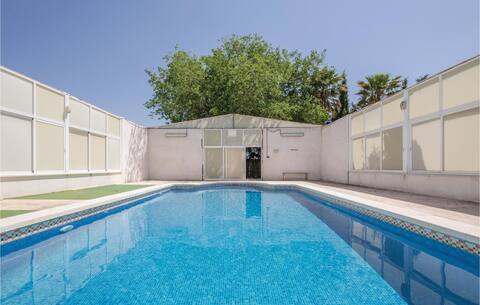
Top Performing Airbnb Properties in Caravaca de la Cruz (2025)
Benchmark your potential! Explore examples of top-performing Airbnb properties in Caravaca de la Cruzbased on Trailing Twelve Month (TTM) revenue. Analyze their characteristics, revenue, occupancy rate, and ADR to understand what drives success in this market.
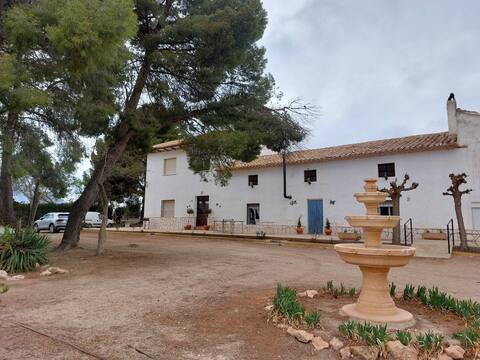
Villa Del Pistacho
Entire Place • 7 bedrooms
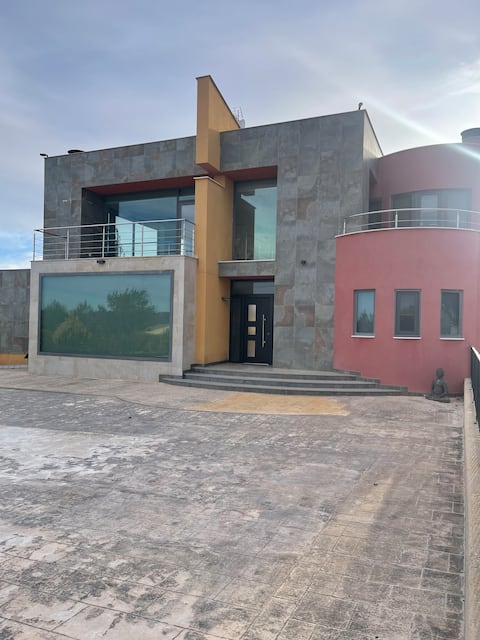
Villa Cruz
Entire Place • 4 bedrooms
Entire 4 Bedroom house with fabulous roof terrace
Entire Place • 4 bedrooms

Casa Espaciosa: Garden and Pool.
Entire Place • 3 bedrooms
Awesome home in Caravaca with kitchen
Entire Place • 5 bedrooms

Casa rural Gómez de Hita
Entire Place • 4 bedrooms
Note: Performance varies based on location, size, amenities, seasonality, and management quality. Data reflects the past 12 months.
Top Performing Airbnb Hosts in Caravaca de la Cruz (2025)
Learn from the best! This table showcases top-performing Airbnb hosts in Caravaca de la Cruz based on the number of properties managed and estimated total revenue over the past year. Analyze their scale and performance metrics.
| Host Name | Properties | Grossing Revenue | Stay Reviews | Avg Rating |
|---|---|---|---|---|
| Grupo Foro | 1 | $63,646 | 12 | 4.67/5.0 |
| Zoraida | 1 | $53,765 | 4 | 5.00/5.0 |
| Christopher | 3 | $48,999 | 27 | 4.74/5.0 |
| Jose | 2 | $40,817 | 41 | 4.75/5.0 |
| Victor Antonio | 3 | $39,230 | 3 | 1.67/5.0 |
| Alfonso | 2 | $29,082 | 103 | 4.96/5.0 |
| Manuela | 1 | $28,510 | 12 | 4.83/5.0 |
| Novasol | 1 | $28,120 | 15 | 4.07/5.0 |
| Jose | 1 | $25,394 | 13 | 4.54/5.0 |
| Antonia | 1 | $23,065 | 12 | 4.92/5.0 |
Analyzing the strategies of top hosts, such as their property selection, pricing, and guest communication, can offer valuable lessons for optimizing your own Airbnb operations in Caravaca de la Cruz.
Dive Deeper: Advanced Caravaca de la Cruz STR Market Data (2025)
Ready to unlock more insights? AirROI provides access to advanced metrics and comprehensive Airbnb data for Caravaca de la Cruz. Explore detailed analytics beyond this report to refine your investment strategy, optimize pricing, and maximize your vacation rental profits.
Explore Advanced MetricsCaravaca de la Cruz Short-Term Rental Market Composition (2025): Property & Room Types
Room Type Distribution
Property Type Distribution
Market Composition Insights for Caravaca de la Cruz
- The Caravaca de la Cruz Airbnb market composition is heavily skewed towards Entire Home/Apt listings, which make up 87.8% of the 49 active rentals. This indicates strong guest preference for privacy and space.
- Looking at the property type distribution in Caravaca de la Cruz, House properties are the most common (49%), reflecting the local real estate landscape.
- Houses represent a significant 49% portion, catering likely to families or larger groups.
- The presence of 10.2% Hotel/Boutique listings indicates integration with traditional hospitality.
- Smaller segments like unique stays (combined 2.0%) offer potential for unique stay experiences.
Caravaca de la Cruz Airbnb Room Capacity Analysis (2025): Bedroom Distribution
Distribution of Listings by Number of Bedrooms
Room Capacity Insights for Caravaca de la Cruz
- The dominant room capacity in Caravaca de la Cruz is 3 bedrooms listings, making up 28.6% of the market. This suggests a strong demand for properties suitable for families or small groups.
- Together, 3 bedrooms and 1 bedroom properties represent 53.1% of the active Airbnb listings in Caravaca de la Cruz, indicating a high concentration in these sizes.
- A significant 57.2% of listings offer 3+ bedrooms, catering to larger groups and families seeking more space in Caravaca de la Cruz.
Caravaca de la Cruz Vacation Rental Guest Capacity Trends (2025)
Distribution of Listings by Guest Capacity
Guest Capacity Insights for Caravaca de la Cruz
- The most common guest capacity trend in Caravaca de la Cruz vacation rentals is listings accommodating 8+ guests (32.7%). This suggests the primary traveler segment is likely larger groups.
- Properties designed for 8+ guests and 6 guests dominate the Caravaca de la Cruz STR market, accounting for 51.1% of listings.
- 57.2% of properties accommodate 6+ guests, serving the market segment for larger families or group travel in Caravaca de la Cruz.
- On average, properties in Caravaca de la Cruz are equipped to host 5.1 guests.
Caravaca de la Cruz Airbnb Booking Patterns (2025): Available vs. Booked Days
Available Days Distribution
Booked Days Distribution
Booking Pattern Insights for Caravaca de la Cruz
- The most common availability pattern in Caravaca de la Cruz falls within the 271-366 days range, representing 69.4% of listings. This suggests many properties have significant open periods on their calendars.
- Approximately 87.8% of listings show high availability (181+ days open annually), indicating potential for increased bookings or specific owner usage patterns.
- For booked days, the 31-90 days range is most frequent in Caravaca de la Cruz (44.9%), reflecting common guest stay durations or potential owner blocking patterns.
- A notable 12.2% of properties secure long booking periods (181+ days booked per year), highlighting successful long-term rental strategies or significant owner usage.
Caravaca de la Cruz Airbnb Minimum Stay Requirements Analysis
Distribution of Listings by Minimum Night Requirement
1 Night
22 listings
45.8% of total
2 Nights
23 listings
47.9% of total
4-6 Nights
1 listings
2.1% of total
30+ Nights
2 listings
4.2% of total
Key Insights
- The most prevalent minimum stay requirement in Caravaca de la Cruz is 2 Nights, adopted by 47.9% of listings. This highlights the market's preference for shorter, flexible bookings.
- A strong majority (93.7%) of the Caravaca de la Cruz Airbnb data shows acceptance of very short stays (1-2 nights), indicating a dynamic, high-turnover market.
Recommendations
- Align with the market by considering a 2 Nights minimum stay, as 47.9% of Caravaca de la Cruz hosts use this setting.
- Adjust minimum nights based on seasonality – potentially shorter during low season and longer during peak demand periods in Caravaca de la Cruz.
Caravaca de la Cruz Airbnb Cancellation Policy Trends Analysis (2025)
Super Strict 60 Days
2 listings
5.9% of total
Flexible
9 listings
26.5% of total
Moderate
10 listings
29.4% of total
Firm
9 listings
26.5% of total
Strict
4 listings
11.8% of total
Cancellation Policy Insights for Caravaca de la Cruz
- The prevailing Airbnb cancellation policy trend in Caravaca de la Cruz is Moderate, used by 29.4% of listings.
- There's a relatively balanced mix between guest-friendly (55.9%) and stricter (38.3%) policies, offering choices for different guest needs.
Recommendations for Hosts
- Consider adopting a Moderate policy to align with the 29.4% market standard in Caravaca de la Cruz.
- Using a Strict policy might deter some guests, as only 11.8% of listings use it. Evaluate if potential revenue protection outweighs possible lower booking rates.
- Regularly review your cancellation policy against competitors and market demand shifts in Caravaca de la Cruz.
Caravaca de la Cruz STR Booking Lead Time Analysis (2025)
Average Booking Lead Time by Month
Booking Lead Time Insights for Caravaca de la Cruz
- The overall average booking lead time for vacation rentals in Caravaca de la Cruz is 46 days.
- Guests book furthest in advance for stays during May (average 143 days), likely coinciding with peak travel demand or local events.
- The shortest booking windows occur for stays in December (average 18 days), indicating more last-minute travel plans during this time.
- Seasonally, Spring (109 days avg.) sees the longest lead times, while Winter (25 days avg.) has the shortest, reflecting typical travel planning cycles.
Recommendations for Hosts
- Use the overall average lead time (46 days) as a baseline for your pricing and availability strategy in Caravaca de la Cruz.
- For May stays, consider implementing length-of-stay discounts or slightly higher rates for bookings made less than 143 days out to capitalize on advance planning.
- Target marketing efforts for the Spring season well in advance (at least 109 days) to capture early planners.
- Monitor your own booking lead times against these Caravaca de la Cruz averages to identify opportunities for dynamic pricing adjustments.
Popular & Essential Airbnb Amenities in Caravaca de la Cruz (2025)
Amenity Prevalence
Amenity Insights for Caravaca de la Cruz
- Essential amenities in Caravaca de la Cruz that guests expect include: Heating. Lacking these (this) could significantly impact bookings.
- Popular amenities like TV, Essentials, Kitchen are common but not universal. Offering these can provide a competitive edge.
- Warning: Wifi is not universally provided but is considered essential globally. Ensure reliable Wifi is offered.
Recommendations for Hosts
- Ensure your listing includes all essential amenities for Caravaca de la Cruz: Heating.
- Prioritize adding missing essentials: Heating.
- Consider adding popular differentiators like TV or Essentials to increase appeal.
- Highlight unique or less common amenities you offer (e.g., hot tub, dedicated workspace, EV charger) in your listing description and photos.
- Regularly check competitor amenities in Caravaca de la Cruz to stay competitive.
Caravaca de la Cruz Airbnb Guest Demographics & Profile Analysis (2025)
Guest Profile Summary for Caravaca de la Cruz
- The typical guest profile for Airbnb in Caravaca de la Cruz consists of primarily domestic travelers (70%), often arriving from nearby Murcia, typically belonging to the Post-2000s (Gen Z/Alpha) group (50%), primarily speaking Spanish or English.
- Domestic travelers account for 69.6% of guests.
- Key international markets include Spain (69.6%) and United Kingdom (5.1%).
- Top languages spoken are Spanish (37.2%) followed by English (29.7%).
- A significant demographic segment is the Post-2000s (Gen Z/Alpha) group, representing 50% of guests.
Recommendations for Hosts
- Target domestic marketing efforts towards travelers from Murcia and Valencia.
- Tailor amenities and listing descriptions to appeal to the dominant Post-2000s (Gen Z/Alpha) demographic (e.g., highlight fast WiFi, smart home features, local guides).
- Highlight unique local experiences or amenities relevant to the primary guest profile.
- Consider seasonal promotions aligned with peak travel times for key origin markets.
Nearby Short-Term Rental Market Comparison
How does the Caravaca de la Cruz Airbnb market stack up against its neighbors? Compare key performance metrics like average monthly revenue, ADR, and occupancy rates in surrounding areas to understand the broader regional STR landscape.
| Market | Active Properties | Monthly Revenue | Daily Rate | Avg. Occupancy |
|---|---|---|---|---|
| Macastre | 13 | $2,924 | $296.93 | 42% |
| Corbera | 13 | $2,721 | $206.87 | 41% |
| Bétera | 31 | $2,711 | $222.77 | 46% |
| l'Eliana | 33 | $2,510 | $298.45 | 43% |
| San Antonio de Benagéber | 11 | $2,374 | $335.55 | 40% |
| Manises | 25 | $2,352 | $175.71 | 38% |
| Olocau | 11 | $2,245 | $308.22 | 36% |
| Alboraia / Alboraya | 272 | $2,220 | $186.05 | 49% |
| la Pobla de Vallbona | 27 | $2,163 | $193.69 | 49% |
| Riba-roja de Túria | 21 | $2,132 | $221.03 | 41% |