Vilanova de Arousa Airbnb Market Analysis 2025: Short Term Rental Data & Vacation Rental Statistics in Galicia, Spain
Is Airbnb profitable in Vilanova de Arousa in 2025? Explore comprehensive Airbnb analytics for Vilanova de Arousa, Galicia, Spain to uncover income potential. This 2025 STR market report for Vilanova de Arousa, based on AirROI data from April 2024 to March 2025, reveals key trends in the niche market of 123 active listings.
Whether you're considering an Airbnb investment in Vilanova de Arousa, optimizing your existing vacation rental, or exploring rental arbitrage opportunities, understanding the Vilanova de Arousa Airbnb data is crucial. Understanding the local regulations is key to maximizing your short term rental income potential. Let's dive into the specifics.
Key Vilanova de Arousa Airbnb Performance Metrics Overview
Monthly Airbnb Revenue Variations & Income Potential in Vilanova de Arousa (2025)
Understanding the monthly revenue variations for Airbnb listings in Vilanova de Arousa is key to maximizing your short term rental income potential. Seasonality significantly impacts earnings. Our analysis, based on data from the past 12 months, shows that the peak revenue month for STRs in Vilanova de Arousa is typically August, while February often presents the lowest earnings, highlighting opportunities for strategic pricing adjustments during shoulder and low seasons. Explore the typical Airbnb income in Vilanova de Arousa across different performance tiers:
- Best-in-class properties (Top 10%) achieve $3,369+ monthly, often utilizing dynamic pricing and superior guest experiences.
- Strong performing properties (Top 25%) earn $1,993 or more, indicating effective management and desirable locations/amenities.
- Typical properties (Median) generate around $1,099 per month, representing the average market performance.
- Entry-level properties (Bottom 25%) see earnings around $557, often with potential for optimization.
Average Monthly Airbnb Earnings Trend in Vilanova de Arousa
Vilanova de Arousa Airbnb Occupancy Rate Trends (2025)
Maximize your bookings by understanding the Vilanova de Arousa STR occupancy trends. Seasonal demand shifts significantly influence how often properties are booked. Typically, Augustsees the highest demand (peak season occupancy), while November experiences the lowest (low season). Effective strategies, like adjusting minimum stays or offering promotions, can boost occupancy during slower periods. Here's how different property tiers perform in Vilanova de Arousa:
- Best-in-class properties (Top 10%) achieve 62%+ occupancy, indicating high desirability and potentially optimized availability.
- Strong performing properties (Top 25%) maintain 41% or higher occupancy, suggesting good market fit and guest satisfaction.
- Typical properties (Median) have an occupancy rate around 26%.
- Entry-level properties (Bottom 25%) average 12% occupancy, potentially facing higher vacancy.
Average Monthly Occupancy Rate Trend in Vilanova de Arousa
Average Daily Rate (ADR) Airbnb Trends in Vilanova de Arousa (2025)
Effective short term rental pricing strategy in Vilanova de Arousa involves understanding monthly ADR fluctuations. The Average Daily Rate (ADR) for Airbnb in Vilanova de Arousa typically peaks in August and dips lowest during April. Leveraging Airbnb dynamic pricing tools or strategies based on this seasonality can significantly boost revenue. Here's a look at the typical nightly rates achieved:
- Best-in-class properties (Top 10%) command rates of $278+ per night, often due to premium features or locations.
- Strong performing properties (Top 25%) achieve nightly rates of $183 or more.
- Typical properties (Median) charge around $124 per night.
- Entry-level properties (Bottom 25%) earn around $97 per night.
Average Daily Rate (ADR) Trend by Month in Vilanova de Arousa
Get Live Vilanova de Arousa Market Intelligence 👇

Explore Real-time Analytics
Airbnb Seasonality Analysis & Trends in Vilanova de Arousa (2025)
Peak Season (August, July, April)
- Revenue averages $2,754 per month
- Occupancy rates average 44.4%
- Daily rates average $163
Shoulder Season
- Revenue averages $1,325 per month
- Occupancy maintains around 26.2%
- Daily rates hold near $160
Low Season (February, October, November)
- Revenue drops to average $904 per month
- Occupancy decreases to average 22.9%
- Daily rates adjust to average $159
Seasonality Insights for Vilanova de Arousa
- The Airbnb seasonality in Vilanova de Arousa shows highly seasonal trends requiring careful strategy. While the sections above show seasonal averages, it's also insightful to look at the extremes:
- During the high season, the absolute peak month showcases Vilanova de Arousa's highest earning potential, with monthly revenues capable of climbing to $3,439, occupancy reaching a high of 64.5%, and ADRs peaking at $169.
- Conversely, the slowest single month of the year, typically falling within the low season, marks the market's lowest point. In this month, revenue might dip to $743, occupancy could drop to 21.2%, and ADRs may adjust down to $154.
- Understanding both the seasonal averages and these monthly peaks and troughs in revenue, occupancy, and ADR is crucial for maximizing your Airbnb profit potential in Vilanova de Arousa.
Seasonal Strategies for Maximizing Profit
- Peak Season: Maximize revenue through premium pricing and potentially longer minimum stays. Ensure high availability.
- Low Season: Offer competitive pricing, special promotions (e.g., extended stay discounts), and flexible cancellation policies. Target off-season travelers like remote workers or budget-conscious guests.
- Shoulder Seasons: Implement dynamic pricing that balances peak and low rates. Target weekend travelers or specific events. Offer slightly more flexible terms than peak season.
- Regularly analyze your own performance against these Vilanova de Arousa seasonality benchmarks and adjust your pricing and availability strategy accordingly.
Best Areas for Airbnb Investment in Vilanova de Arousa (2025)
Exploring the top neighborhoods for short-term rentals in Vilanova de Arousa? This section highlights key areas, outlining why they are attractive for hosts and guests, along with notable local attractions. Consider these locations based on your target guest profile and investment strategy.
| Neighborhood / Area | Why Host Here? (Target Guests & Appeal) | Key Attractions & Landmarks |
|---|---|---|
| Vilanova Town Center | The vibrant heart of Vilanova de Arousa, with a mix of shopping, dining, and cultural experiences. A great spot for tourists looking to explore local life while being close to beautiful beaches. | Historic Church of San Miguel, Vilanova de Arousa promenade, local restaurants and bars, Museo del Mar |
| Porto de Vilanova | The picturesque marina area where visitors can enjoy seafood restaurants and stunning views of the harbor. A perfect area for those interested in water sports and marine activities. | Vilanova Marina, Ferry to Sanxenxo, water sports rentals, seafront cafes, fishing spots |
| Arousa Island | A beautiful natural area with stunning beaches and a peaceful atmosphere, ideal for visitors looking to escape the hustle and bustle, while enjoying nature and tranquility. | Beaches of Arousa Island, hiking trails, snorkeling spots, natural parks |
| Cabo de Cruz | A charming fishing village known for its beautiful coastline and seafood. Offers a quaint experience for guests who want to see traditional Galician life and enjoy fresh seafood. | Cabo de Cruz beach, local fish markets, scenic coastal walking paths |
| Aguete Beach | A popular beach destination with fine sand and clear water, perfect for families and beachgoers. Its accessibility makes it a favored choice among local and visiting tourists. | Aguete Beach, water sports, seaside restaurants |
| Meis | Close to Vilanova, Meis offers a rural experience with wineries and vineyards. Visitors can appreciate traditional Galician culture and enjoy wine tastings. | Wine tours and tastings, Galician countryside, local festivals |
| Sanxenxo | Nearby Sanxenxo is a well-known tourist destination with beautiful beaches and nightlife. It's perfect for those wanting a lively atmosphere and easy access to Vilanova. | Silgar Beach, Sanxenxo Nightlife, restaurants and bars, local markets |
| Pedras Negras | A serene coastal area known for its rocky formations and stunning views of the Atlantic. Ideal for nature lovers and those seeking a remote getaway experience. | Pedras Negras beach, hiking and nature walks, bird watching, historic sites nearby |
Understanding Airbnb License Requirements & STR Laws in Vilanova de Arousa (2025)
With 23% of listings showing registration in 2025, understanding potential Airbnb license requirements is crucial in Vilanova de Arousa. Always verify the latest short term rental regulations and Airbnb license requirements directly with local government authorities for Vilanova de Arousa to ensure full compliance before hosting.
(Source: AirROI data, 2025, based on 23% licensed listings)
Top Performing Airbnb Properties in Vilanova de Arousa (2025)
Benchmark your potential! Explore examples of top-performing Airbnb properties in Vilanova de Arousabased on Trailing Twelve Month (TTM) revenue. Analyze their characteristics, revenue, occupancy rate, and ADR to understand what drives success in this market.
Beautiful Casona Gallega en O Salnés, Rías Baixas
Entire Place • 6 bedrooms
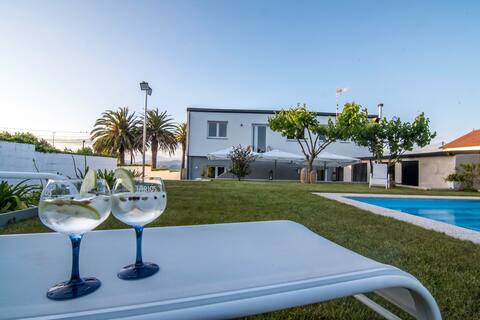
Al Frente de la Playa Villa Las Sinas 2
Entire Place • 8 bedrooms

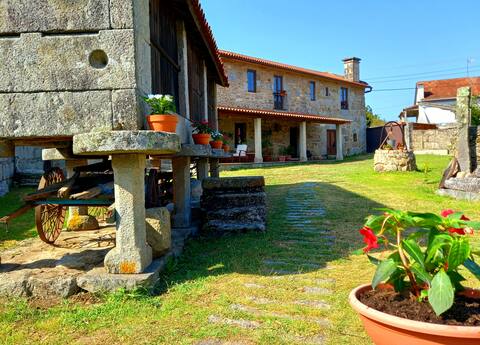
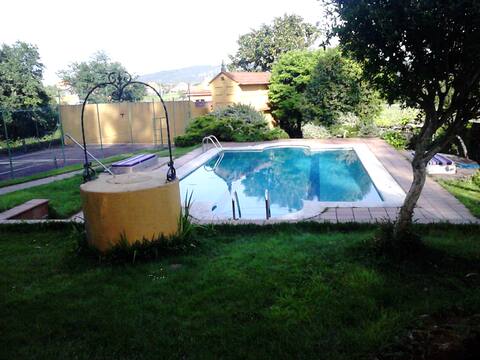
Chalet with swimming pool in the countryside and close to beaches
Entire Place • 7 bedrooms
Charming house in Vilanova de Arousa
Entire Place • 5 bedrooms
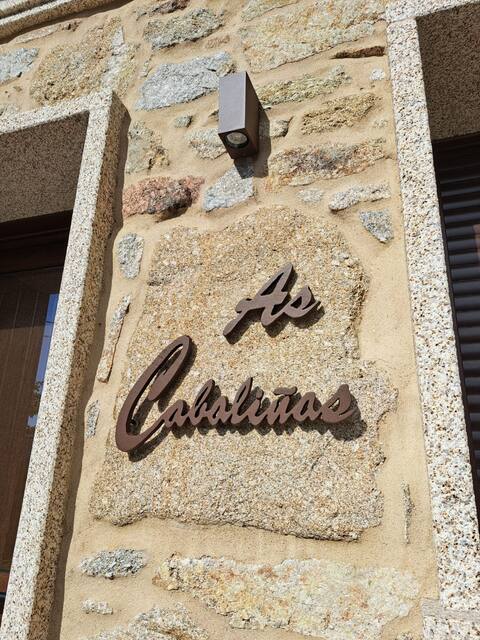
As Cabaliñas
Entire Place • 4 bedrooms

CASA LOLA, Vilanova de Arousa. Rias Baixas
Entire Place • 3 bedrooms
Note: Performance varies based on location, size, amenities, seasonality, and management quality. Data reflects the past 12 months.
Top Performing Airbnb Hosts in Vilanova de Arousa (2025)
Learn from the best! This table showcases top-performing Airbnb hosts in Vilanova de Arousa based on the number of properties managed and estimated total revenue over the past year. Analyze their scale and performance metrics.
| Host Name | Properties | Grossing Revenue | Stay Reviews | Avg Rating |
|---|---|---|---|---|
| Fran | 5 | $81,250 | 82 | 3.00/5.0 |
| Galihost | 9 | $59,963 | 14 | 1.08/5.0 |
| Laura | 1 | $59,660 | 12 | 5.00/5.0 |
| Host #517706913 | 4 | $58,653 | 1 | 0.00/5.0 |
| Marisa | 2 | $52,923 | 91 | 4.97/5.0 |
| Gerardo | 1 | $41,679 | 3 | 5.00/5.0 |
| Maria Teresa | 1 | $41,255 | 82 | 4.84/5.0 |
| Paula | 2 | $37,539 | 186 | 4.95/5.0 |
| Javier | 1 | $32,149 | 17 | 4.88/5.0 |
| Marina | 2 | $30,431 | 35 | 5.00/5.0 |
Analyzing the strategies of top hosts, such as their property selection, pricing, and guest communication, can offer valuable lessons for optimizing your own Airbnb operations in Vilanova de Arousa.
Dive Deeper: Advanced Vilanova de Arousa STR Market Data (2025)
Ready to unlock more insights? AirROI provides access to advanced metrics and comprehensive Airbnb data for Vilanova de Arousa. Explore detailed analytics beyond this report to refine your investment strategy, optimize pricing, and maximize your vacation rental profits.
Explore Advanced MetricsVilanova de Arousa Short-Term Rental Market Composition (2025): Property & Room Types
Room Type Distribution
Property Type Distribution
Market Composition Insights for Vilanova de Arousa
- The Vilanova de Arousa Airbnb market composition is heavily skewed towards Entire Home/Apt listings, which make up 99.2% of the 123 active rentals. This indicates strong guest preference for privacy and space.
- Looking at the property type distribution in Vilanova de Arousa, Apartment/Condo properties are the most common (51.2%), reflecting the local real estate landscape.
- Houses represent a significant 45.5% portion, catering likely to families or larger groups.
- Smaller segments like outdoor/unique, hotel/boutique (combined 3.2%) offer potential for unique stay experiences.
Vilanova de Arousa Airbnb Room Capacity Analysis (2025): Bedroom Distribution
Distribution of Listings by Number of Bedrooms
Room Capacity Insights for Vilanova de Arousa
- The dominant room capacity in Vilanova de Arousa is 2 bedrooms listings, making up 42.3% of the market. This suggests a strong demand for properties suitable for couples or solo travelers.
- Together, 2 bedrooms and 3 bedrooms properties represent 68.3% of the active Airbnb listings in Vilanova de Arousa, indicating a high concentration in these sizes.
- A significant 45.5% of listings offer 3+ bedrooms, catering to larger groups and families seeking more space in Vilanova de Arousa.
Vilanova de Arousa Vacation Rental Guest Capacity Trends (2025)
Distribution of Listings by Guest Capacity
Guest Capacity Insights for Vilanova de Arousa
- The most common guest capacity trend in Vilanova de Arousa vacation rentals is listings accommodating 4 guests (23.6%). This suggests the primary traveler segment is likely small families or groups.
- Properties designed for 4 guests and 6 guests dominate the Vilanova de Arousa STR market, accounting for 47.2% of listings.
- 46.4% of properties accommodate 6+ guests, serving the market segment for larger families or group travel in Vilanova de Arousa.
- On average, properties in Vilanova de Arousa are equipped to host 5.4 guests.
Vilanova de Arousa Airbnb Booking Patterns (2025): Available vs. Booked Days
Available Days Distribution
Booked Days Distribution
Booking Pattern Insights for Vilanova de Arousa
- The most common availability pattern in Vilanova de Arousa falls within the 271-366 days range, representing 76.4% of listings. This suggests many properties have significant open periods on their calendars.
- Approximately 96.7% of listings show high availability (181+ days open annually), indicating potential for increased bookings or specific owner usage patterns.
- For booked days, the 31-90 days range is most frequent in Vilanova de Arousa (48%), reflecting common guest stay durations or potential owner blocking patterns.
- A notable 4.9% of properties secure long booking periods (181+ days booked per year), highlighting successful long-term rental strategies or significant owner usage.
Vilanova de Arousa Airbnb Minimum Stay Requirements Analysis
Distribution of Listings by Minimum Night Requirement
1 Night
23 listings
19.7% of total
2 Nights
28 listings
23.9% of total
3 Nights
17 listings
14.5% of total
4-6 Nights
31 listings
26.5% of total
7-29 Nights
5 listings
4.3% of total
30+ Nights
13 listings
11.1% of total
Key Insights
- The most prevalent minimum stay requirement in Vilanova de Arousa is 4-6 Nights, adopted by 26.5% of listings. This highlights the market's preference for longer commitments.
- A significant segment (11.1%) caters to monthly stays (30+ nights) in Vilanova de Arousa, pointing to opportunities in the extended-stay market.
Recommendations
- Align with the market by considering a 4-6 Nights minimum stay, as 26.5% of Vilanova de Arousa hosts use this setting.
- If feasible, allowing 1-night stays, especially midweek or during low season, could capture last-minute bookings, as only 19.7% currently do.
- Explore offering discounts for stays of 30+ nights to attract the 11.1% of the market seeking extended stays.
- Adjust minimum nights based on seasonality – potentially shorter during low season and longer during peak demand periods in Vilanova de Arousa.
Vilanova de Arousa Airbnb Cancellation Policy Trends Analysis (2025)
Flexible
20 listings
21.5% of total
Moderate
26 listings
28% of total
Firm
18 listings
19.4% of total
Strict
29 listings
31.2% of total
Cancellation Policy Insights for Vilanova de Arousa
- The prevailing Airbnb cancellation policy trend in Vilanova de Arousa is Strict, used by 31.2% of listings.
- A majority (50.6%) of hosts in Vilanova de Arousa utilize Firm or Strict policies, indicating a market where hosts prioritize booking security.
Recommendations for Hosts
- Consider adopting a Strict policy to align with the 31.2% market standard in Vilanova de Arousa.
- With 31.2% using Strict terms, this is a viable option in Vilanova de Arousa, particularly for high-value properties or during peak demand periods.
- Regularly review your cancellation policy against competitors and market demand shifts in Vilanova de Arousa.
Vilanova de Arousa STR Booking Lead Time Analysis (2025)
Average Booking Lead Time by Month
Booking Lead Time Insights for Vilanova de Arousa
- The overall average booking lead time for vacation rentals in Vilanova de Arousa is 49 days.
- Guests book furthest in advance for stays during August (average 89 days), likely coinciding with peak travel demand or local events.
- The shortest booking windows occur for stays in February (average 13 days), indicating more last-minute travel plans during this time.
- Seasonally, Summer (80 days avg.) sees the longest lead times, while Winter (27 days avg.) has the shortest, reflecting typical travel planning cycles.
Recommendations for Hosts
- Use the overall average lead time (49 days) as a baseline for your pricing and availability strategy in Vilanova de Arousa.
- For August stays, consider implementing length-of-stay discounts or slightly higher rates for bookings made less than 89 days out to capitalize on advance planning.
- During February, focus on last-minute booking availability and promotions, as guests book with very short notice (13 days avg.).
- Target marketing efforts for the Summer season well in advance (at least 80 days) to capture early planners.
- Monitor your own booking lead times against these Vilanova de Arousa averages to identify opportunities for dynamic pricing adjustments.
Popular & Essential Airbnb Amenities in Vilanova de Arousa (2025)
Amenity Prevalence
Amenity Insights for Vilanova de Arousa
- Essential amenities in Vilanova de Arousa that guests expect include: Kitchen, TV. Lacking these (any) could significantly impact bookings.
- Popular amenities like Hot water, Washer, Essentials are common but not universal. Offering these can provide a competitive edge.
Recommendations for Hosts
- Ensure your listing includes all essential amenities for Vilanova de Arousa: Kitchen, TV.
- Prioritize adding missing essentials: Kitchen, TV.
- Consider adding popular differentiators like Hot water or Washer to increase appeal.
- Highlight unique or less common amenities you offer (e.g., hot tub, dedicated workspace, EV charger) in your listing description and photos.
- Regularly check competitor amenities in Vilanova de Arousa to stay competitive.
Vilanova de Arousa Airbnb Guest Demographics & Profile Analysis (2025)
Guest Profile Summary for Vilanova de Arousa
- The typical guest profile for Airbnb in Vilanova de Arousa consists of primarily domestic travelers (66%), often arriving from nearby Madrid, typically belonging to the Post-2000s (Gen Z/Alpha) group (50%), primarily speaking Spanish or English.
- Domestic travelers account for 65.5% of guests.
- Key international markets include Spain (65.5%) and United States (5.3%).
- Top languages spoken are Spanish (37.9%) followed by English (31.7%).
- A significant demographic segment is the Post-2000s (Gen Z/Alpha) group, representing 50% of guests.
Recommendations for Hosts
- Target domestic marketing efforts towards travelers from Madrid and A Coruña.
- Tailor amenities and listing descriptions to appeal to the dominant Post-2000s (Gen Z/Alpha) demographic (e.g., highlight fast WiFi, smart home features, local guides).
- Highlight unique local experiences or amenities relevant to the primary guest profile.
- Consider seasonal promotions aligned with peak travel times for key origin markets.
Nearby Short-Term Rental Market Comparison
How does the Vilanova de Arousa Airbnb market stack up against its neighbors? Compare key performance metrics like average monthly revenue, ADR, and occupancy rates in surrounding areas to understand the broader regional STR landscape.
| Market | Active Properties | Monthly Revenue | Daily Rate | Avg. Occupancy |
|---|---|---|---|---|
| Penhalonga e Paços de Gaiolo | 23 | $4,193 | $340.45 | 44% |
| Sande e São Lourenço do Douro | 15 | $2,998 | $311.12 | 39% |
| Armamar | 59 | $2,357 | $253.66 | 38% |
| Alijó | 64 | $2,217 | $264.67 | 32% |
| Cinfães | 17 | $1,948 | $252.01 | 32% |
| Mesão Frio | 53 | $1,907 | $195.39 | 46% |
| Porto | 7,887 | $1,900 | $128.19 | 53% |
| Outes | 31 | $1,837 | $223.97 | 38% |
| Anreade e São Romão de Arego | 14 | $1,836 | $184.41 | 39% |
| Vila Nova de Gaia | 1,097 | $1,836 | $138.57 | 52% |