Vigo Airbnb Market Analysis 2025: Short Term Rental Data & Vacation Rental Statistics in Galicia, Spain
Is Airbnb profitable in Vigo in 2025? Explore comprehensive Airbnb analytics for Vigo, Galicia, Spain to uncover income potential. This 2025 STR market report for Vigo, based on AirROI data from April 2024 to March 2025, reveals key trends in the bustling market of 1,038 active listings.
Whether you're considering an Airbnb investment in Vigo, optimizing your existing vacation rental, or exploring rental arbitrage opportunities, understanding the Vigo Airbnb data is crucial. Understanding the local regulations is key to maximizing your short term rental income potential. Let's dive into the specifics.
Key Vigo Airbnb Performance Metrics Overview
Monthly Airbnb Revenue Variations & Income Potential in Vigo (2025)
Understanding the monthly revenue variations for Airbnb listings in Vigo is key to maximizing your short term rental income potential. Seasonality significantly impacts earnings. Our analysis, based on data from the past 12 months, shows that the peak revenue month for STRs in Vigo is typically August, while February often presents the lowest earnings, highlighting opportunities for strategic pricing adjustments during shoulder and low seasons. Explore the typical Airbnb income in Vigo across different performance tiers:
- Best-in-class properties (Top 10%) achieve $3,210+ monthly, often utilizing dynamic pricing and superior guest experiences.
- Strong performing properties (Top 25%) earn $2,223 or more, indicating effective management and desirable locations/amenities.
- Typical properties (Median) generate around $1,287 per month, representing the average market performance.
- Entry-level properties (Bottom 25%) see earnings around $609, often with potential for optimization.
Average Monthly Airbnb Earnings Trend in Vigo
Vigo Airbnb Occupancy Rate Trends (2025)
Maximize your bookings by understanding the Vigo STR occupancy trends. Seasonal demand shifts significantly influence how often properties are booked. Typically, Augustsees the highest demand (peak season occupancy), while January experiences the lowest (low season). Effective strategies, like adjusting minimum stays or offering promotions, can boost occupancy during slower periods. Here's how different property tiers perform in Vigo:
- Best-in-class properties (Top 10%) achieve 76%+ occupancy, indicating high desirability and potentially optimized availability.
- Strong performing properties (Top 25%) maintain 59% or higher occupancy, suggesting good market fit and guest satisfaction.
- Typical properties (Median) have an occupancy rate around 37%.
- Entry-level properties (Bottom 25%) average 18% occupancy, potentially facing higher vacancy.
Average Monthly Occupancy Rate Trend in Vigo
Average Daily Rate (ADR) Airbnb Trends in Vigo (2025)
Effective short term rental pricing strategy in Vigo involves understanding monthly ADR fluctuations. The Average Daily Rate (ADR) for Airbnb in Vigo typically peaks in August and dips lowest during March. Leveraging Airbnb dynamic pricing tools or strategies based on this seasonality can significantly boost revenue. Here's a look at the typical nightly rates achieved:
- Best-in-class properties (Top 10%) command rates of $219+ per night, often due to premium features or locations.
- Strong performing properties (Top 25%) achieve nightly rates of $150 or more.
- Typical properties (Median) charge around $103 per night.
- Entry-level properties (Bottom 25%) earn around $72 per night.
Average Daily Rate (ADR) Trend by Month in Vigo
Get Live Vigo Market Intelligence 👇

Explore Real-time Analytics
Airbnb Seasonality Analysis & Trends in Vigo (2025)
Peak Season (August, July, June)
- Revenue averages $2,333 per month
- Occupancy rates average 52.1%
- Daily rates average $136
Shoulder Season
- Revenue averages $1,621 per month
- Occupancy maintains around 39.2%
- Daily rates hold near $128
Low Season (January, February, March)
- Revenue drops to average $786 per month
- Occupancy decreases to average 29.2%
- Daily rates adjust to average $116
Seasonality Insights for Vigo
- The Airbnb seasonality in Vigo shows highly seasonal trends requiring careful strategy. While the sections above show seasonal averages, it's also insightful to look at the extremes:
- During the high season, the absolute peak month showcases Vigo's highest earning potential, with monthly revenues capable of climbing to $2,712, occupancy reaching a high of 63.7%, and ADRs peaking at $139.
- Conversely, the slowest single month of the year, typically falling within the low season, marks the market's lowest point. In this month, revenue might dip to $681, occupancy could drop to 29.0%, and ADRs may adjust down to $112.
- Understanding both the seasonal averages and these monthly peaks and troughs in revenue, occupancy, and ADR is crucial for maximizing your Airbnb profit potential in Vigo.
Seasonal Strategies for Maximizing Profit
- Peak Season: Maximize revenue through premium pricing and potentially longer minimum stays. Ensure high availability.
- Low Season: Offer competitive pricing, special promotions (e.g., extended stay discounts), and flexible cancellation policies. Target off-season travelers like remote workers or budget-conscious guests.
- Shoulder Seasons: Implement dynamic pricing that balances peak and low rates. Target weekend travelers or specific events. Offer slightly more flexible terms than peak season.
- Regularly analyze your own performance against these Vigo seasonality benchmarks and adjust your pricing and availability strategy accordingly.
Best Areas for Airbnb Investment in Vigo (2025)
Exploring the top neighborhoods for short-term rentals in Vigo? This section highlights key areas, outlining why they are attractive for hosts and guests, along with notable local attractions. Consider these locations based on your target guest profile and investment strategy.
| Neighborhood / Area | Why Host Here? (Target Guests & Appeal) | Key Attractions & Landmarks |
|---|---|---|
| Old Town | The historic center of Vigo with its narrow streets, charming squares, and rich culture. It's an attractive spot for tourists interested in history and local cuisine. | Vigo Cathedral, Praza da Constitución, Museum of Contemporary Art, Castro Park, Fishing Port |
| Bouzas | A picturesque seaside neighborhood known for its beaches and seafood restaurants. Bouzas is popular among both locals and tourists for its relaxed atmosphere and beautiful seaside views. | Bouzas Beach, Viguesa Ria, Feria de Bouzas, Local seafood taverns, Marina |
| Samil Beach | The most famous beach in Vigo, attracting many visitors during the summer months. With its long sandy shore and water sports facilities, it appeals to families and sun-seekers alike. | Samil Beach, Promenade, Casco Vello, Playground facilities, Nearby cafes and bars |
| Castro | A neighborhood known for its hilltop park and stunning views of the city. It's an engaging destination for tourists looking for outdoor activities and scenic beauty. | Castro de Vigo, Castro Park, Mirador do Castro, Open-air concert venue, Bicycle paths |
| Paseo de Alfonso XII | A vibrant boulevard along the waterfront, perfect for walks and outdoor dining. It's a lively area with shops, restaurants, and bars that attract both locals and tourists. | Paseo Marítimo, Palacio de Altamira, Cafes and terraces, Galería de Arte, Beach access |
| O Marisquiño | An urban space known for sports and street culture. It hosts a popular festival and is perfect for younger crowds seeking action and entertainment. | O Marisquiño Festival, Street art, Sporting events, Cultural center, Hip cafes |
| Vigo Estuary | A beautiful natural setting that offers stunning landscape views and a variety of outdoor activities like sailing and hiking. Attracts nature lovers and adventure seekers. | Vigo Estuary Views, Boating and sailing, Nature trails, Scenic viewpoints, Wildlife watching |
| Plaza de España | A central square that is a hub of local life, filled with shops, markets, and eateries. It's ideal for tourists wanting to experience local culture and convenience. | Plaza de España Park, Shopping centers, Local markets, Cafés, Cultural events |
Understanding Airbnb License Requirements & STR Laws in Vigo (2025)
With 25% of listings showing registration in 2025, understanding potential Airbnb license requirements is crucial in Vigo. Always verify the latest short term rental regulations and Airbnb license requirements directly with local government authorities for Vigo to ensure full compliance before hosting.
(Source: AirROI data, 2025, based on 25% licensed listings)
Top Performing Airbnb Properties in Vigo (2025)
Benchmark your potential! Explore examples of top-performing Airbnb properties in Vigobased on Trailing Twelve Month (TTM) revenue. Analyze their characteristics, revenue, occupancy rate, and ADR to understand what drives success in this market.

Big house in the center of Vigo by Prishomes
Entire Place • 5 bedrooms

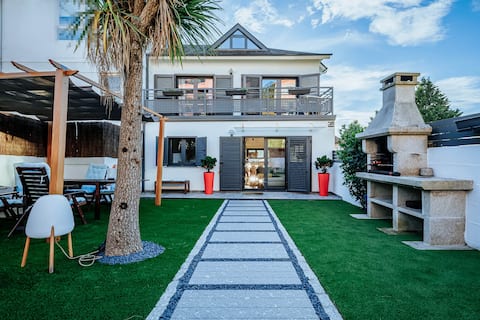
Urban oasis in the heart of Vigo with best views
Entire Place • 4 bedrooms
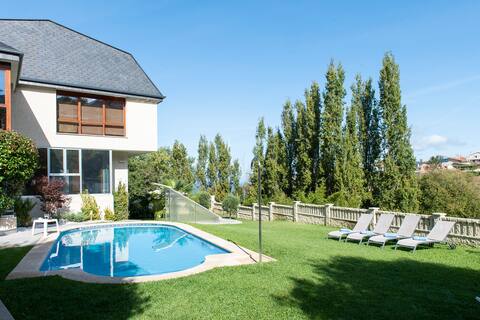
Villa with Pool.Privacity a short walk away from the beach
Entire Place • 6 bedrooms
Central Dream House in the Castro by Prishomes
Entire Place • 3 bedrooms

Centrally Located Luxury Penthouse With Bay Views
Entire Place • 1 bedroom
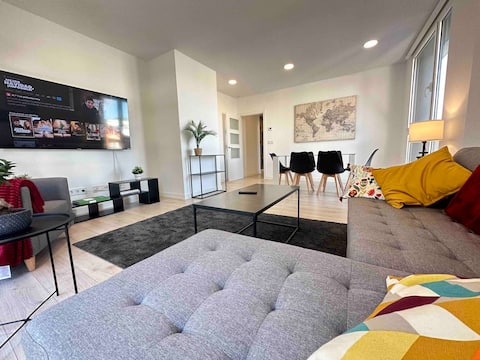
Great brand new apartment with deck and view.
Entire Place • 3 bedrooms
Note: Performance varies based on location, size, amenities, seasonality, and management quality. Data reflects the past 12 months.
Top Performing Airbnb Hosts in Vigo (2025)
Learn from the best! This table showcases top-performing Airbnb hosts in Vigo based on the number of properties managed and estimated total revenue over the past year. Analyze their scale and performance metrics.
| Host Name | Properties | Grossing Revenue | Stay Reviews | Avg Rating |
|---|---|---|---|---|
| Yourbesthost | 44 | $1,223,587 | 1639 | 4.47/5.0 |
| CABANA Rentals | 36 | $546,265 | 295 | 3.74/5.0 |
| Pablo | 38 | $450,507 | 1037 | 4.32/5.0 |
| Maria Carmen | 67 | $298,583 | 67 | 0.53/5.0 |
| Heroyal | 9 | $288,207 | 101 | 4.01/5.0 |
| Prisilla | 5 | $258,129 | 245 | 4.90/5.0 |
| Frederick | 22 | $249,635 | 154 | 3.39/5.0 |
| Sandra | 10 | $202,944 | 74 | 3.90/5.0 |
| Carrera | 8 | $166,907 | 84 | 4.18/5.0 |
| Patricia | 4 | $136,530 | 58 | 4.81/5.0 |
Analyzing the strategies of top hosts, such as their property selection, pricing, and guest communication, can offer valuable lessons for optimizing your own Airbnb operations in Vigo.
Dive Deeper: Advanced Vigo STR Market Data (2025)
Ready to unlock more insights? AirROI provides access to advanced metrics and comprehensive Airbnb data for Vigo. Explore detailed analytics beyond this report to refine your investment strategy, optimize pricing, and maximize your vacation rental profits.
Explore Advanced MetricsVigo Short-Term Rental Market Composition (2025): Property & Room Types
Room Type Distribution
Property Type Distribution
Market Composition Insights for Vigo
- The Vigo Airbnb market composition is heavily skewed towards Entire Home/Apt listings, which make up 89.4% of the 1,038 active rentals. This indicates strong guest preference for privacy and space.
- Looking at the property type distribution in Vigo, Apartment/Condo properties are the most common (84%), reflecting the local real estate landscape.
- Smaller segments like hotel/boutique, outdoor/unique, others (combined 3.7%) offer potential for unique stay experiences.
Vigo Airbnb Room Capacity Analysis (2025): Bedroom Distribution
Distribution of Listings by Number of Bedrooms
Room Capacity Insights for Vigo
- The dominant room capacity in Vigo is 1 bedroom listings, making up 40.3% of the market. This suggests a strong demand for properties suitable for couples or solo travelers.
- Together, 1 bedroom and 2 bedrooms properties represent 70.3% of the active Airbnb listings in Vigo, indicating a high concentration in these sizes.
- A significant 20.7% of listings offer 3+ bedrooms, catering to larger groups and families seeking more space in Vigo.
Vigo Vacation Rental Guest Capacity Trends (2025)
Distribution of Listings by Guest Capacity
Guest Capacity Insights for Vigo
- The most common guest capacity trend in Vigo vacation rentals is listings accommodating 4 guests (31.3%). This suggests the primary traveler segment is likely small families or groups.
- Properties designed for 4 guests and 2 guests dominate the Vigo STR market, accounting for 51.5% of listings.
- 20.4% of properties accommodate 6+ guests, serving the market segment for larger families or group travel in Vigo.
- On average, properties in Vigo are equipped to host 3.8 guests.
Vigo Airbnb Booking Patterns (2025): Available vs. Booked Days
Available Days Distribution
Booked Days Distribution
Booking Pattern Insights for Vigo
- The most common availability pattern in Vigo falls within the 271-366 days range, representing 47.6% of listings. This suggests many properties have significant open periods on their calendars.
- Approximately 78.9% of listings show high availability (181+ days open annually), indicating potential for increased bookings or specific owner usage patterns.
- For booked days, the 91-180 days range is most frequent in Vigo (31.8%), reflecting common guest stay durations or potential owner blocking patterns.
- A notable 22.1% of properties secure long booking periods (181+ days booked per year), highlighting successful long-term rental strategies or significant owner usage.
Vigo Airbnb Minimum Stay Requirements Analysis
Distribution of Listings by Minimum Night Requirement
1 Night
191 listings
20.2% of total
2 Nights
381 listings
40.3% of total
3 Nights
84 listings
8.9% of total
4-6 Nights
76 listings
8% of total
7-29 Nights
23 listings
2.4% of total
30+ Nights
191 listings
20.2% of total
Key Insights
- The most prevalent minimum stay requirement in Vigo is 2 Nights, adopted by 40.3% of listings. This highlights the market's preference for shorter, flexible bookings.
- A strong majority (60.5%) of the Vigo Airbnb data shows acceptance of very short stays (1-2 nights), indicating a dynamic, high-turnover market.
- A significant segment (20.2%) caters to monthly stays (30+ nights) in Vigo, pointing to opportunities in the extended-stay market.
Recommendations
- Align with the market by considering a 2 Nights minimum stay, as 40.3% of Vigo hosts use this setting.
- If feasible, allowing 1-night stays, especially midweek or during low season, could capture last-minute bookings, as only 20.2% currently do.
- Explore offering discounts for stays of 30+ nights to attract the 20.2% of the market seeking extended stays.
- Adjust minimum nights based on seasonality – potentially shorter during low season and longer during peak demand periods in Vigo.
Vigo Airbnb Cancellation Policy Trends Analysis (2025)
Refundable
1 listings
0.1% of total
Super Strict 60 Days
3 listings
0.4% of total
Flexible
240 listings
30% of total
Moderate
331 listings
41.4% of total
Firm
104 listings
13% of total
Strict
121 listings
15.1% of total
Cancellation Policy Insights for Vigo
- The prevailing Airbnb cancellation policy trend in Vigo is Moderate, used by 41.4% of listings.
- The market strongly favors guest-friendly terms, with 71.4% of listings offering Flexible or Moderate policies. This suggests guests in Vigo may expect booking flexibility.
Recommendations for Hosts
- Consider adopting a Moderate policy to align with the 41.4% market standard in Vigo.
- Regularly review your cancellation policy against competitors and market demand shifts in Vigo.
Vigo STR Booking Lead Time Analysis (2025)
Average Booking Lead Time by Month
Booking Lead Time Insights for Vigo
- The overall average booking lead time for vacation rentals in Vigo is 40 days.
- Guests book furthest in advance for stays during July (average 71 days), likely coinciding with peak travel demand or local events.
- The shortest booking windows occur for stays in March (average 29 days), indicating more last-minute travel plans during this time.
- Seasonally, Summer (62 days avg.) sees the longest lead times, while Winter (36 days avg.) has the shortest, reflecting typical travel planning cycles.
Recommendations for Hosts
- Use the overall average lead time (40 days) as a baseline for your pricing and availability strategy in Vigo.
- For July stays, consider implementing length-of-stay discounts or slightly higher rates for bookings made less than 71 days out to capitalize on advance planning.
- Target marketing efforts for the Summer season well in advance (at least 62 days) to capture early planners.
- Monitor your own booking lead times against these Vigo averages to identify opportunities for dynamic pricing adjustments.
Popular & Essential Airbnb Amenities in Vigo (2025)
Amenity Prevalence
Amenity Insights for Vigo
- Essential amenities in Vigo that guests expect include: Kitchen, TV. Lacking these (any) could significantly impact bookings.
- Popular amenities like Wifi, Hot water, Washer are common but not universal. Offering these can provide a competitive edge.
- Warning: Wifi is not universally provided but is considered essential globally. Ensure reliable Wifi is offered.
Recommendations for Hosts
- Ensure your listing includes all essential amenities for Vigo: Kitchen, TV.
- Prioritize adding missing essentials: Kitchen, TV.
- Consider adding popular differentiators like Wifi or Hot water to increase appeal.
- Highlight unique or less common amenities you offer (e.g., hot tub, dedicated workspace, EV charger) in your listing description and photos.
- Regularly check competitor amenities in Vigo to stay competitive.
Vigo Airbnb Guest Demographics & Profile Analysis (2025)
Guest Profile Summary for Vigo
- The typical guest profile for Airbnb in Vigo consists of a mix of domestic (48%) and international guests, with top international origins including Portugal, typically belonging to the Post-2000s (Gen Z/Alpha) group (50%), primarily speaking English or Spanish.
- Domestic travelers account for 47.8% of guests.
- Key international markets include Spain (47.8%) and Portugal (13%).
- Top languages spoken are English (34%) followed by Spanish (31.4%).
- A significant demographic segment is the Post-2000s (Gen Z/Alpha) group, representing 50% of guests.
Recommendations for Hosts
- Balance marketing efforts between domestic and international channels based on the guest mix.
- Tailor amenities and listing descriptions to appeal to the dominant Post-2000s (Gen Z/Alpha) demographic (e.g., highlight fast WiFi, smart home features, local guides).
- Highlight unique local experiences or amenities relevant to the primary guest profile.
- Consider seasonal promotions aligned with peak travel times for key origin markets.
Nearby Short-Term Rental Market Comparison
How does the Vigo Airbnb market stack up against its neighbors? Compare key performance metrics like average monthly revenue, ADR, and occupancy rates in surrounding areas to understand the broader regional STR landscape.
| Market | Active Properties | Monthly Revenue | Daily Rate | Avg. Occupancy |
|---|---|---|---|---|
| Penhalonga e Paços de Gaiolo | 23 | $4,193 | $340.45 | 44% |
| Sande e São Lourenço do Douro | 15 | $2,998 | $311.12 | 39% |
| Armamar | 59 | $2,357 | $253.66 | 38% |
| Alijó | 64 | $2,217 | $264.67 | 32% |
| Cinfães | 17 | $1,948 | $252.01 | 32% |
| Mesão Frio | 53 | $1,907 | $195.39 | 46% |
| Porto | 7,887 | $1,900 | $128.19 | 53% |
| Outes | 31 | $1,837 | $223.97 | 38% |
| Anreade e São Romão de Arego | 14 | $1,836 | $184.41 | 39% |
| Vila Nova de Gaia | 1,097 | $1,836 | $138.57 | 52% |