Sober Airbnb Market Analysis 2025: Short Term Rental Data & Vacation Rental Statistics in Galicia, Spain
Is Airbnb profitable in Sober in 2025? Explore comprehensive Airbnb analytics for Sober, Galicia, Spain to uncover income potential. This 2025 STR market report for Sober, based on AirROI data from April 2024 to March 2025, reveals key trends in the niche market of 39 active listings.
Whether you're considering an Airbnb investment in Sober, optimizing your existing vacation rental, or exploring rental arbitrage opportunities, understanding the Sober Airbnb data is crucial. Navigating the high regulation landscape is key to maximizing your short term rental income potential. Let's dive into the specifics.
Key Sober Airbnb Performance Metrics Overview
Monthly Airbnb Revenue Variations & Income Potential in Sober (2025)
Understanding the monthly revenue variations for Airbnb listings in Sober is key to maximizing your short term rental income potential. Seasonality significantly impacts earnings. Our analysis, based on data from the past 12 months, shows that the peak revenue month for STRs in Sober is typically August, while January often presents the lowest earnings, highlighting opportunities for strategic pricing adjustments during shoulder and low seasons. Explore the typical Airbnb income in Sober across different performance tiers:
- Best-in-class properties (Top 10%) achieve $2,992+ monthly, often utilizing dynamic pricing and superior guest experiences.
- Strong performing properties (Top 25%) earn $1,791 or more, indicating effective management and desirable locations/amenities.
- Typical properties (Median) generate around $1,017 per month, representing the average market performance.
- Entry-level properties (Bottom 25%) see earnings around $516, often with potential for optimization.
Average Monthly Airbnb Earnings Trend in Sober
Sober Airbnb Occupancy Rate Trends (2025)
Maximize your bookings by understanding the Sober STR occupancy trends. Seasonal demand shifts significantly influence how often properties are booked. Typically, Augustsees the highest demand (peak season occupancy), while January experiences the lowest (low season). Effective strategies, like adjusting minimum stays or offering promotions, can boost occupancy during slower periods. Here's how different property tiers perform in Sober:
- Best-in-class properties (Top 10%) achieve 52%+ occupancy, indicating high desirability and potentially optimized availability.
- Strong performing properties (Top 25%) maintain 37% or higher occupancy, suggesting good market fit and guest satisfaction.
- Typical properties (Median) have an occupancy rate around 24%.
- Entry-level properties (Bottom 25%) average 15% occupancy, potentially facing higher vacancy.
Average Monthly Occupancy Rate Trend in Sober
Average Daily Rate (ADR) Airbnb Trends in Sober (2025)
Effective short term rental pricing strategy in Sober involves understanding monthly ADR fluctuations. The Average Daily Rate (ADR) for Airbnb in Sober typically peaks in July and dips lowest during February. Leveraging Airbnb dynamic pricing tools or strategies based on this seasonality can significantly boost revenue. Here's a look at the typical nightly rates achieved:
- Best-in-class properties (Top 10%) command rates of $263+ per night, often due to premium features or locations.
- Strong performing properties (Top 25%) achieve nightly rates of $198 or more.
- Typical properties (Median) charge around $123 per night.
- Entry-level properties (Bottom 25%) earn around $90 per night.
Average Daily Rate (ADR) Trend by Month in Sober
Get Live Sober Market Intelligence 👇

Explore Real-time Analytics
Airbnb Seasonality Analysis & Trends in Sober (2025)
Peak Season (August, July, September)
- Revenue averages $2,169 per month
- Occupancy rates average 48.9%
- Daily rates average $158
Shoulder Season
- Revenue averages $1,223 per month
- Occupancy maintains around 21.5%
- Daily rates hold near $153
Low Season (January, March, November)
- Revenue drops to average $833 per month
- Occupancy decreases to average 17.2%
- Daily rates adjust to average $144
Seasonality Insights for Sober
- The Airbnb seasonality in Sober shows highly seasonal trends requiring careful strategy. While the sections above show seasonal averages, it's also insightful to look at the extremes:
- During the high season, the absolute peak month showcases Sober's highest earning potential, with monthly revenues capable of climbing to $2,860, occupancy reaching a high of 65.0%, and ADRs peaking at $159.
- Conversely, the slowest single month of the year, typically falling within the low season, marks the market's lowest point. In this month, revenue might dip to $575, occupancy could drop to 12.3%, and ADRs may adjust down to $140.
- Understanding both the seasonal averages and these monthly peaks and troughs in revenue, occupancy, and ADR is crucial for maximizing your Airbnb profit potential in Sober.
Seasonal Strategies for Maximizing Profit
- Peak Season: Maximize revenue through premium pricing and potentially longer minimum stays. Ensure high availability.
- Low Season: Offer competitive pricing, special promotions (e.g., extended stay discounts), and flexible cancellation policies. Target off-season travelers like remote workers or budget-conscious guests.
- Shoulder Seasons: Implement dynamic pricing that balances peak and low rates. Target weekend travelers or specific events. Offer slightly more flexible terms than peak season.
- Regularly analyze your own performance against these Sober seasonality benchmarks and adjust your pricing and availability strategy accordingly.
Best Areas for Airbnb Investment in Sober (2025)
Exploring the top neighborhoods for short-term rentals in Sober? This section highlights key areas, outlining why they are attractive for hosts and guests, along with notable local attractions. Consider these locations based on your target guest profile and investment strategy.
| Neighborhood / Area | Why Host Here? (Target Guests & Appeal) | Key Attractions & Landmarks |
|---|---|---|
| Santiago de Compostela | Famous for its historic importance and as the endpoint of the Camino de Santiago pilgrimage, it attracts visitors interested in history and culture all year round. | Santiago de Compostela Cathedral, Old Town, Parque de la Alameda, Museum of the Galician People, City of Culture of Galicia |
| Pontevedra | Known for its well-preserved medieval old town and lively atmosphere, it's a great spot for tourists seeking a charming city experience. | Pontevedra Old Town, Santuario da Peregrina, Praza da Ferrería, Museo de Pontevedra, Ría de Pontevedra |
| A Coruña | A bustling coastal city with a vibrant cultural life and beautiful beaches, perfect for both leisure and business travelers. | Torre de Hércules, Orzán Beach, Plaza de María Pita, A Coruña Aquarium, Museo de Bellas Artes |
| Sanxenxo | Popular beach destination known for its stunning coastlines and nightlife, particularly appealing to summer vacationers and beach lovers. | Silgar Beach, A Lanzada Beach, Marina of Sanxenxo, O Grove Peninsula, Isla de La Toja |
| Lugo | Renowned for its Roman walls and historical sites, Lugo attracts history enthusiasts and nature lovers alike. | Lugo Roman Walls, Lugo Cathedral, Museo Provincial, Parque do Mosaico, Termas Romanas |
| Tui | A small town with rich history and beautiful architecture, close to the border with Portugal, appealing to visitors looking for a quieter retreat. | Tui Cathedral, Old Town, Fort of Tui, A Guarda, Baiona |
| O Grove | A coastal town famous for its seafood and natural beauty, ideal for those interested in gastronomy and outdoor activities. | Isla de La Toja, O Grove Beach, Marismas de Lira, Aquarium of Galicia, Pazo de La Toja |
| Cangas do Morrazo | Offers beautiful beaches and access to the stunning Cíes Islands, ideal for outdoor enthusiasts and vacationers seeking tranquility. | Cíes Islands, Praia de Rodeira, Isla de Ons, Pazo de Cangas, Mirador de A Curota |
Understanding Airbnb License Requirements & STR Laws in Sober (2025)
Yes, Sober, Galicia, Spain enforces high STR regulations. Obtaining a license and ensuring compliance is almost certainly required according to current 2025 STR laws. Always verify the latest short term rental regulations and Airbnb license requirements directly with local government authorities for Sober to ensure full compliance before hosting.
(Source: AirROI data, 2025, based on 38% licensed listings)
Top Performing Airbnb Properties in Sober (2025)
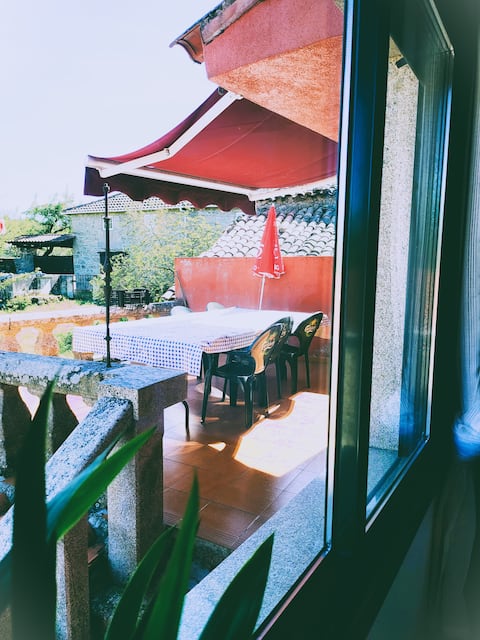
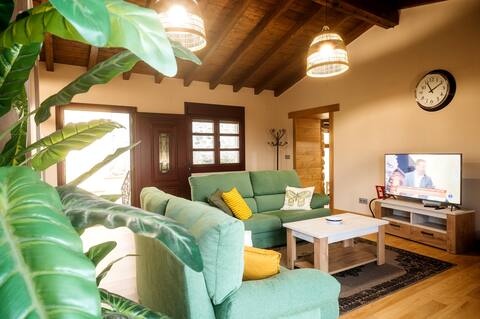
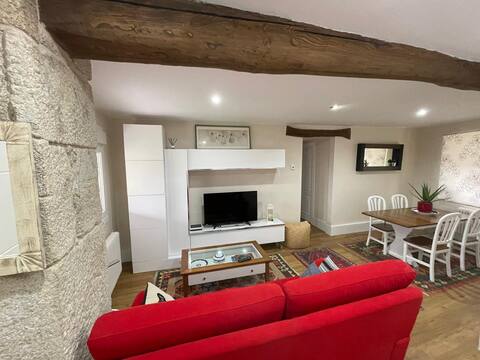
Benchmark your potential! Explore examples of top-performing Airbnb properties in Soberbased on Trailing Twelve Month (TTM) revenue. Analyze their characteristics, revenue, occupancy rate, and ADR to understand what drives success in this market.
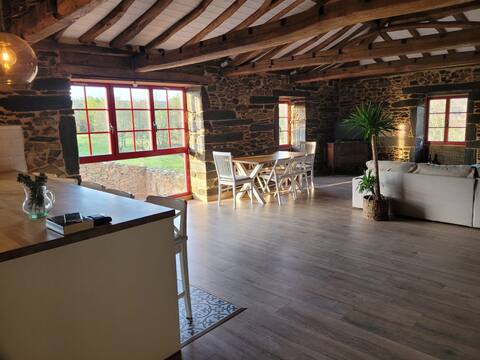
Cas´dos Suecos
Entire Place • 4 bedrooms

Casa de Pia Neiras
Entire Place • 7 bedrooms
Alojamiento Pena da Osa
Entire Place • 6 bedrooms
Casa Sancristan.
Entire Place • 2 bedrooms
Casa Bolmente a Ver en la Ribeira Sacra, Sober.
Entire Place • 2 bedrooms

Casa Mila , Ribeira sacra, Doade, 4 dormitorios
Entire Place • 4 bedrooms
Note: Performance varies based on location, size, amenities, seasonality, and management quality. Data reflects the past 12 months.
Top Performing Airbnb Hosts in Sober (2025)
Learn from the best! This table showcases top-performing Airbnb hosts in Sober based on the number of properties managed and estimated total revenue over the past year. Analyze their scale and performance metrics.
| Host Name | Properties | Grossing Revenue | Stay Reviews | Avg Rating |
|---|---|---|---|---|
| Cristina | 1 | $48,036 | 8 | 5.00/5.0 |
| Sandra | 5 | $44,570 | 76 | 5.00/5.0 |
| Carmen | 1 | $38,690 | 10 | 5.00/5.0 |
| Hosteo | 2 | $30,691 | 10 | 2.50/5.0 |
| Fernando | 1 | $28,347 | 8 | 4.88/5.0 |
| Maria | 1 | $17,254 | 13 | 5.00/5.0 |
| Mila | 1 | $16,546 | 7 | 5.00/5.0 |
| Marcos | 1 | $15,311 | 5 | 5.00/5.0 |
| Carlos | 1 | $14,920 | 54 | 5.00/5.0 |
| Asuncion | 1 | $14,601 | 23 | 5.00/5.0 |
Analyzing the strategies of top hosts, such as their property selection, pricing, and guest communication, can offer valuable lessons for optimizing your own Airbnb operations in Sober.
Dive Deeper: Advanced Sober STR Market Data (2025)
Ready to unlock more insights? AirROI provides access to advanced metrics and comprehensive Airbnb data for Sober. Explore detailed analytics beyond this report to refine your investment strategy, optimize pricing, and maximize your vacation rental profits.
Explore Advanced MetricsSober Short-Term Rental Market Composition (2025): Property & Room Types
Room Type Distribution
Property Type Distribution
Market Composition Insights for Sober
- The Sober Airbnb market composition is heavily skewed towards Entire Home/Apt listings, which make up 100% of the 39 active rentals. This indicates strong guest preference for privacy and space.
- Looking at the property type distribution in Sober, House properties are the most common (74.4%), reflecting the local real estate landscape.
- Houses represent a significant 74.4% portion, catering likely to families or larger groups.
Sober Airbnb Room Capacity Analysis (2025): Bedroom Distribution
Distribution of Listings by Number of Bedrooms
Room Capacity Insights for Sober
- The dominant room capacity in Sober is 2 bedrooms listings, making up 41% of the market. This suggests a strong demand for properties suitable for couples or solo travelers.
- Together, 2 bedrooms and 1 bedroom properties represent 61.5% of the active Airbnb listings in Sober, indicating a high concentration in these sizes.
- A significant 38.4% of listings offer 3+ bedrooms, catering to larger groups and families seeking more space in Sober.
Sober Vacation Rental Guest Capacity Trends (2025)
Distribution of Listings by Guest Capacity
Guest Capacity Insights for Sober
- The most common guest capacity trend in Sober vacation rentals is listings accommodating 8+ guests (35.9%). This suggests the primary traveler segment is likely larger groups.
- Properties designed for 8+ guests and 4 guests dominate the Sober STR market, accounting for 71.8% of listings.
- 46.2% of properties accommodate 6+ guests, serving the market segment for larger families or group travel in Sober.
- On average, properties in Sober are equipped to host 5.5 guests.
Sober Airbnb Booking Patterns (2025): Available vs. Booked Days
Available Days Distribution
Booked Days Distribution
Booking Pattern Insights for Sober
- The most common availability pattern in Sober falls within the 271-366 days range, representing 74.4% of listings. This suggests many properties have significant open periods on their calendars.
- Approximately 94.9% of listings show high availability (181+ days open annually), indicating potential for increased bookings or specific owner usage patterns.
- For booked days, the 31-90 days range is most frequent in Sober (48.7%), reflecting common guest stay durations or potential owner blocking patterns.
- A notable 5.1% of properties secure long booking periods (181+ days booked per year), highlighting successful long-term rental strategies or significant owner usage.
Sober Airbnb Minimum Stay Requirements Analysis
Distribution of Listings by Minimum Night Requirement
1 Night
1 listings
2.8% of total
2 Nights
30 listings
83.3% of total
3 Nights
1 listings
2.8% of total
4-6 Nights
3 listings
8.3% of total
30+ Nights
1 listings
2.8% of total
Key Insights
- The most prevalent minimum stay requirement in Sober is 2 Nights, adopted by 83.3% of listings. This highlights the market's preference for shorter, flexible bookings.
- A strong majority (86.1%) of the Sober Airbnb data shows acceptance of very short stays (1-2 nights), indicating a dynamic, high-turnover market.
- Dedicated monthly rentals (30+ nights) represent a small niche (2.8%), possibly an untapped area for hosts.
Recommendations
- Align with the market by considering a 2 Nights minimum stay, as 83.3% of Sober hosts use this setting.
- If feasible, allowing 1-night stays, especially midweek or during low season, could capture last-minute bookings, as only 2.8% currently do.
- A 2-night minimum appears standard (83.3%). Consider this for weekends or peak periods.
- Adjust minimum nights based on seasonality – potentially shorter during low season and longer during peak demand periods in Sober.
Sober Airbnb Cancellation Policy Trends Analysis (2025)
Flexible
6 listings
17.6% of total
Moderate
14 listings
41.2% of total
Firm
8 listings
23.5% of total
Strict
6 listings
17.6% of total
Cancellation Policy Insights for Sober
- The prevailing Airbnb cancellation policy trend in Sober is Moderate, used by 41.2% of listings.
- There's a relatively balanced mix between guest-friendly (58.8%) and stricter (41.1%) policies, offering choices for different guest needs.
Recommendations for Hosts
- Consider adopting a Moderate policy to align with the 41.2% market standard in Sober.
- Regularly review your cancellation policy against competitors and market demand shifts in Sober.
Sober STR Booking Lead Time Analysis (2025)
Average Booking Lead Time by Month
Booking Lead Time Insights for Sober
- The overall average booking lead time for vacation rentals in Sober is 61 days.
- Guests book furthest in advance for stays during July (average 88 days), likely coinciding with peak travel demand or local events.
- The shortest booking windows occur for stays in January (average 30 days), indicating more last-minute travel plans during this time.
- Seasonally, Summer (81 days avg.) sees the longest lead times, while Winter (34 days avg.) has the shortest, reflecting typical travel planning cycles.
Recommendations for Hosts
- Use the overall average lead time (61 days) as a baseline for your pricing and availability strategy in Sober.
- For July stays, consider implementing length-of-stay discounts or slightly higher rates for bookings made less than 88 days out to capitalize on advance planning.
- Target marketing efforts for the Summer season well in advance (at least 81 days) to capture early planners.
- Monitor your own booking lead times against these Sober averages to identify opportunities for dynamic pricing adjustments.
Popular & Essential Airbnb Amenities in Sober (2025)
Amenity Prevalence
Amenity Insights for Sober
- Essential amenities in Sober that guests expect include: Kitchen, Essentials. Lacking these (any) could significantly impact bookings.
- Popular amenities like Hair dryer, TV, Hot water are common but not universal. Offering these can provide a competitive edge.
Recommendations for Hosts
- Ensure your listing includes all essential amenities for Sober: Kitchen, Essentials.
- Prioritize adding missing essentials: Essentials.
- Consider adding popular differentiators like Hair dryer or TV to increase appeal.
- Highlight unique or less common amenities you offer (e.g., hot tub, dedicated workspace, EV charger) in your listing description and photos.
- Regularly check competitor amenities in Sober to stay competitive.
Sober Airbnb Guest Demographics & Profile Analysis (2025)
Guest Profile Summary for Sober
- The typical guest profile for Airbnb in Sober consists of primarily domestic travelers (80%), often arriving from nearby Madrid, typically belonging to the Post-2000s (Gen Z/Alpha) group (50%), primarily speaking Spanish or English.
- Domestic travelers account for 79.8% of guests.
- Key international markets include Spain (79.8%) and France (6.4%).
- Top languages spoken are Spanish (35.2%) followed by English (31.8%).
- A significant demographic segment is the Post-2000s (Gen Z/Alpha) group, representing 50% of guests.
Recommendations for Hosts
- Target domestic marketing efforts towards travelers from Madrid and A Coruña.
- Tailor amenities and listing descriptions to appeal to the dominant Post-2000s (Gen Z/Alpha) demographic (e.g., highlight fast WiFi, smart home features, local guides).
- Highlight unique local experiences or amenities relevant to the primary guest profile.
- Consider seasonal promotions aligned with peak travel times for key origin markets.
Nearby Short-Term Rental Market Comparison
How does the Sober Airbnb market stack up against its neighbors? Compare key performance metrics like average monthly revenue, ADR, and occupancy rates in surrounding areas to understand the broader regional STR landscape.
| Market | Active Properties | Monthly Revenue | Daily Rate | Avg. Occupancy |
|---|---|---|---|---|
| Penhalonga e Paços de Gaiolo | 23 | $4,193 | $340.45 | 44% |
| Sande e São Lourenço do Douro | 15 | $2,998 | $311.12 | 39% |
| Armamar | 59 | $2,357 | $253.66 | 38% |
| Alijó | 64 | $2,217 | $264.67 | 32% |
| Cinfães | 17 | $1,948 | $252.01 | 32% |
| Mesão Frio | 53 | $1,907 | $195.39 | 46% |
| Porto | 7,887 | $1,900 | $128.19 | 53% |
| Outes | 31 | $1,837 | $223.97 | 38% |
| Anreade e São Romão de Arego | 14 | $1,836 | $184.41 | 39% |
| Vila Nova de Gaia | 1,097 | $1,836 | $138.57 | 52% |