Ribeira Airbnb Market Analysis 2025: Short Term Rental Data & Vacation Rental Statistics in Galicia, Spain
Is Airbnb profitable in Ribeira in 2025? Explore comprehensive Airbnb analytics for Ribeira, Galicia, Spain to uncover income potential. This 2025 STR market report for Ribeira, based on AirROI data from April 2024 to March 2025, reveals key trends in the niche market of 108 active listings.
Whether you're considering an Airbnb investment in Ribeira, optimizing your existing vacation rental, or exploring rental arbitrage opportunities, understanding the Ribeira Airbnb data is crucial. Understanding the local regulations is key to maximizing your short term rental income potential. Let's dive into the specifics.
Key Ribeira Airbnb Performance Metrics Overview
Monthly Airbnb Revenue Variations & Income Potential in Ribeira (2025)
Understanding the monthly revenue variations for Airbnb listings in Ribeira is key to maximizing your short term rental income potential. Seasonality significantly impacts earnings. Our analysis, based on data from the past 12 months, shows that the peak revenue month for STRs in Ribeira is typically August, while February often presents the lowest earnings, highlighting opportunities for strategic pricing adjustments during shoulder and low seasons. Explore the typical Airbnb income in Ribeira across different performance tiers:
- Best-in-class properties (Top 10%) achieve $2,281+ monthly, often utilizing dynamic pricing and superior guest experiences.
- Strong performing properties (Top 25%) earn $1,530 or more, indicating effective management and desirable locations/amenities.
- Typical properties (Median) generate around $927 per month, representing the average market performance.
- Entry-level properties (Bottom 25%) see earnings around $484, often with potential for optimization.
Average Monthly Airbnb Earnings Trend in Ribeira
Ribeira Airbnb Occupancy Rate Trends (2025)
Maximize your bookings by understanding the Ribeira STR occupancy trends. Seasonal demand shifts significantly influence how often properties are booked. Typically, Augustsees the highest demand (peak season occupancy), while February experiences the lowest (low season). Effective strategies, like adjusting minimum stays or offering promotions, can boost occupancy during slower periods. Here's how different property tiers perform in Ribeira:
- Best-in-class properties (Top 10%) achieve 62%+ occupancy, indicating high desirability and potentially optimized availability.
- Strong performing properties (Top 25%) maintain 45% or higher occupancy, suggesting good market fit and guest satisfaction.
- Typical properties (Median) have an occupancy rate around 31%.
- Entry-level properties (Bottom 25%) average 16% occupancy, potentially facing higher vacancy.
Average Monthly Occupancy Rate Trend in Ribeira
Average Daily Rate (ADR) Airbnb Trends in Ribeira (2025)
Effective short term rental pricing strategy in Ribeira involves understanding monthly ADR fluctuations. The Average Daily Rate (ADR) for Airbnb in Ribeira typically peaks in August and dips lowest during March. Leveraging Airbnb dynamic pricing tools or strategies based on this seasonality can significantly boost revenue. Here's a look at the typical nightly rates achieved:
- Best-in-class properties (Top 10%) command rates of $170+ per night, often due to premium features or locations.
- Strong performing properties (Top 25%) achieve nightly rates of $123 or more.
- Typical properties (Median) charge around $97 per night.
- Entry-level properties (Bottom 25%) earn around $76 per night.
Average Daily Rate (ADR) Trend by Month in Ribeira
Get Live Ribeira Market Intelligence 👇

Explore Real-time Analytics
Airbnb Seasonality Analysis & Trends in Ribeira (2025)
Peak Season (August, July, June)
- Revenue averages $2,035 per month
- Occupancy rates average 52.6%
- Daily rates average $110
Shoulder Season
- Revenue averages $980 per month
- Occupancy maintains around 26.9%
- Daily rates hold near $105
Low Season (January, February, November)
- Revenue drops to average $575 per month
- Occupancy decreases to average 22.3%
- Daily rates adjust to average $104
Seasonality Insights for Ribeira
- The Airbnb seasonality in Ribeira shows highly seasonal trends requiring careful strategy. While the sections above show seasonal averages, it's also insightful to look at the extremes:
- During the high season, the absolute peak month showcases Ribeira's highest earning potential, with monthly revenues capable of climbing to $2,755, occupancy reaching a high of 71.9%, and ADRs peaking at $112.
- Conversely, the slowest single month of the year, typically falling within the low season, marks the market's lowest point. In this month, revenue might dip to $507, occupancy could drop to 19.2%, and ADRs may adjust down to $103.
- Understanding both the seasonal averages and these monthly peaks and troughs in revenue, occupancy, and ADR is crucial for maximizing your Airbnb profit potential in Ribeira.
Seasonal Strategies for Maximizing Profit
- Peak Season: Maximize revenue through premium pricing and potentially longer minimum stays. Ensure high availability.
- Low Season: Offer competitive pricing, special promotions (e.g., extended stay discounts), and flexible cancellation policies. Target off-season travelers like remote workers or budget-conscious guests.
- Shoulder Seasons: Implement dynamic pricing that balances peak and low rates. Target weekend travelers or specific events. Offer slightly more flexible terms than peak season.
- Regularly analyze your own performance against these Ribeira seasonality benchmarks and adjust your pricing and availability strategy accordingly.
Best Areas for Airbnb Investment in Ribeira (2025)
Exploring the top neighborhoods for short-term rentals in Ribeira? This section highlights key areas, outlining why they are attractive for hosts and guests, along with notable local attractions. Consider these locations based on your target guest profile and investment strategy.
| Neighborhood / Area | Why Host Here? (Target Guests & Appeal) | Key Attractions & Landmarks |
|---|---|---|
| Ribeira City Center | The heart of Ribeira, bustling with shops, restaurants, and vibrant local life. Perfect for tourists looking to enjoy the local culture and waterfront views. | Ribeira Port, Market of Ribeira, Church of Santa Maria do Campo, Playa de Compostela |
| Paseo Marítimo | A scenic waterfront promenade that attracts walkers, joggers, and those wanting to enjoy seaside views. Excellent for hosting guests who appreciate coastal activities. | Ribeira Beach, Marina, Tasca de Rianxeira, Restaurants with seafood views |
| Cabo de Cruz | A picturesque fishing village that offers a tranquil escape with beautiful beaches. Ideal for families and couples looking for relaxation. | Cabo de Cruz Beach, Fishing Harbor, Gastronomic experiences, Local seafood restaurants |
| Santiago de Compostela | Nearby city known for its historical significance and as a pilgrimage site. Regular influx of tourists makes it a great location for Airbnb. | Santiago Cathedral, Old Town, Museo do Pobo Galego, Parque de la Alameda |
| Porto do Son | A charming coastal area known for its natural beauty and access to stunning beaches, perfect for outdoor enthusiasts. | Cabo de Cruz Beach, Náutico Centro, Hiking trails, Local fish markets |
| A Pobra do Caramiñal | A quaint fishing village that attracts visitors looking for an authentic Galician experience. A quieter alternative to more touristy areas. | Local beaches, Boardwalk, Fishing culture, Gastronomy |
| Caldas de Reis | Known for its thermal springs and natural beauty, Caldas attracts both tourists seeking relaxation and nature lovers. | Thermal baths, Parque da Diversión, Local markets, Riverside walks |
| Noia | A historic town with a rich maritime tradition, Noia is less touristy but offers charm and beautiful architecture, appealing to cultural tourists. | Church of San Martiño, Historic old town, Noia River, Beaches |
Understanding Airbnb License Requirements & STR Laws in Ribeira (2025)
With 21% of listings showing registration in 2025, understanding potential Airbnb license requirements is crucial in Ribeira. Always verify the latest short term rental regulations and Airbnb license requirements directly with local government authorities for Ribeira to ensure full compliance before hosting.
(Source: AirROI data, 2025, based on 21% licensed listings)
Top Performing Airbnb Properties in Ribeira (2025)
Benchmark your potential! Explore examples of top-performing Airbnb properties in Ribeirabased on Trailing Twelve Month (TTM) revenue. Analyze their characteristics, revenue, occupancy rate, and ADR to understand what drives success in this market.

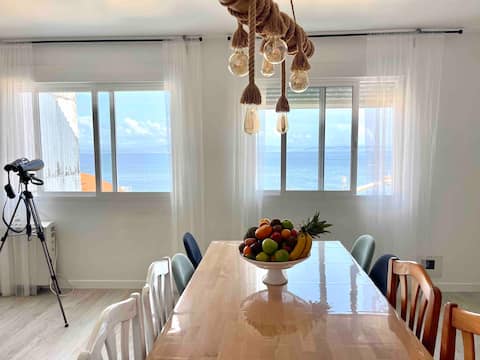
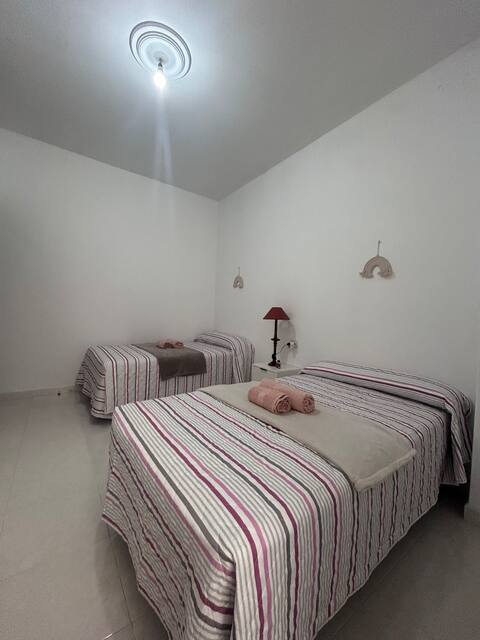
House in front of the beach.
Entire Place • 4 bedrooms
Beach and city.
Entire Place • 4 bedrooms

Casa Nicolás
Entire Place • 3 bedrooms

Jewel in the heart of Ribeira
Entire Place • 1 bedroom

Ribeira apartment, front line.
Entire Place • 2 bedrooms
Casa Retiro
Entire Place • 3 bedrooms
Note: Performance varies based on location, size, amenities, seasonality, and management quality. Data reflects the past 12 months.
Top Performing Airbnb Hosts in Ribeira (2025)
Learn from the best! This table showcases top-performing Airbnb hosts in Ribeira based on the number of properties managed and estimated total revenue over the past year. Analyze their scale and performance metrics.
| Host Name | Properties | Grossing Revenue | Stay Reviews | Avg Rating |
|---|---|---|---|---|
| Antonio | 1 | $45,031 | 6 | 5.00/5.0 |
| Luz | 3 | $34,614 | 24 | 4.40/5.0 |
| Rodrigo Antón | 1 | $29,478 | 15 | 4.93/5.0 |
| Conchi | 1 | $23,391 | 13 | 5.00/5.0 |
| Loreto | 2 | $21,432 | 37 | 2.48/5.0 |
| Sonia | 2 | $20,146 | 3 | 2.17/5.0 |
| Xeila | 1 | $20,058 | 31 | 4.84/5.0 |
| María | 2 | $19,671 | 30 | 4.76/5.0 |
| Virginia | 2 | $19,037 | 45 | 4.76/5.0 |
| María Jesús | 1 | $18,639 | 8 | 5.00/5.0 |
Analyzing the strategies of top hosts, such as their property selection, pricing, and guest communication, can offer valuable lessons for optimizing your own Airbnb operations in Ribeira.
Dive Deeper: Advanced Ribeira STR Market Data (2025)
Ready to unlock more insights? AirROI provides access to advanced metrics and comprehensive Airbnb data for Ribeira. Explore detailed analytics beyond this report to refine your investment strategy, optimize pricing, and maximize your vacation rental profits.
Explore Advanced MetricsRibeira Short-Term Rental Market Composition (2025): Property & Room Types
Room Type Distribution
Property Type Distribution
Market Composition Insights for Ribeira
- The Ribeira Airbnb market composition is heavily skewed towards Entire Home/Apt listings, which make up 91.7% of the 108 active rentals. This indicates strong guest preference for privacy and space.
- Looking at the property type distribution in Ribeira, Apartment/Condo properties are the most common (73.1%), reflecting the local real estate landscape.
- Houses represent a significant 20.4% portion, catering likely to families or larger groups.
- Smaller segments like outdoor/unique, hotel/boutique, unique stays, others (combined 6.5%) offer potential for unique stay experiences.
Ribeira Airbnb Room Capacity Analysis (2025): Bedroom Distribution
Distribution of Listings by Number of Bedrooms
Room Capacity Insights for Ribeira
- The dominant room capacity in Ribeira is 2 bedrooms listings, making up 33.3% of the market. This suggests a strong demand for properties suitable for couples or solo travelers.
- Together, 2 bedrooms and 3 bedrooms properties represent 62.0% of the active Airbnb listings in Ribeira, indicating a high concentration in these sizes.
- A significant 41.6% of listings offer 3+ bedrooms, catering to larger groups and families seeking more space in Ribeira.
Ribeira Vacation Rental Guest Capacity Trends (2025)
Distribution of Listings by Guest Capacity
Guest Capacity Insights for Ribeira
- The most common guest capacity trend in Ribeira vacation rentals is listings accommodating 4 guests (37%). This suggests the primary traveler segment is likely small families or groups.
- Properties designed for 4 guests and 6 guests dominate the Ribeira STR market, accounting for 59.2% of listings.
- 37.0% of properties accommodate 6+ guests, serving the market segment for larger families or group travel in Ribeira.
- On average, properties in Ribeira are equipped to host 4.8 guests.
Ribeira Airbnb Booking Patterns (2025): Available vs. Booked Days
Available Days Distribution
Booked Days Distribution
Booking Pattern Insights for Ribeira
- The most common availability pattern in Ribeira falls within the 271-366 days range, representing 73.1% of listings. This suggests many properties have significant open periods on their calendars.
- Approximately 93.5% of listings show high availability (181+ days open annually), indicating potential for increased bookings or specific owner usage patterns.
- For booked days, the 31-90 days range is most frequent in Ribeira (46.3%), reflecting common guest stay durations or potential owner blocking patterns.
- A notable 6.5% of properties secure long booking periods (181+ days booked per year), highlighting successful long-term rental strategies or significant owner usage.
Ribeira Airbnb Minimum Stay Requirements Analysis
Distribution of Listings by Minimum Night Requirement
1 Night
14 listings
14% of total
2 Nights
32 listings
32% of total
3 Nights
11 listings
11% of total
4-6 Nights
23 listings
23% of total
7-29 Nights
16 listings
16% of total
30+ Nights
4 listings
4% of total
Key Insights
- The most prevalent minimum stay requirement in Ribeira is 2 Nights, adopted by 32% of listings. This highlights the market's preference for shorter, flexible bookings.
Recommendations
- Align with the market by considering a 2 Nights minimum stay, as 32% of Ribeira hosts use this setting.
- If feasible, allowing 1-night stays, especially midweek or during low season, could capture last-minute bookings, as only 14% currently do.
- A 2-night minimum appears standard (32%). Consider this for weekends or peak periods.
- Adjust minimum nights based on seasonality – potentially shorter during low season and longer during peak demand periods in Ribeira.
Ribeira Airbnb Cancellation Policy Trends Analysis (2025)
Flexible
12 listings
14% of total
Moderate
26 listings
30.2% of total
Firm
27 listings
31.4% of total
Strict
21 listings
24.4% of total
Cancellation Policy Insights for Ribeira
- The prevailing Airbnb cancellation policy trend in Ribeira is Firm, used by 31.4% of listings.
- A majority (55.8%) of hosts in Ribeira utilize Firm or Strict policies, indicating a market where hosts prioritize booking security.
Recommendations for Hosts
- Consider adopting a Firm policy to align with the 31.4% market standard in Ribeira.
- Regularly review your cancellation policy against competitors and market demand shifts in Ribeira.
Ribeira STR Booking Lead Time Analysis (2025)
Average Booking Lead Time by Month
Booking Lead Time Insights for Ribeira
- The overall average booking lead time for vacation rentals in Ribeira is 58 days.
- Guests book furthest in advance for stays during July (average 102 days), likely coinciding with peak travel demand or local events.
- The shortest booking windows occur for stays in February (average 13 days), indicating more last-minute travel plans during this time.
- Seasonally, Summer (90 days avg.) sees the longest lead times, while Winter (32 days avg.) has the shortest, reflecting typical travel planning cycles.
Recommendations for Hosts
- Use the overall average lead time (58 days) as a baseline for your pricing and availability strategy in Ribeira.
- For July stays, consider implementing length-of-stay discounts or slightly higher rates for bookings made less than 102 days out to capitalize on advance planning.
- During February, focus on last-minute booking availability and promotions, as guests book with very short notice (13 days avg.).
- Target marketing efforts for the Summer season well in advance (at least 90 days) to capture early planners.
- Monitor your own booking lead times against these Ribeira averages to identify opportunities for dynamic pricing adjustments.
Popular & Essential Airbnb Amenities in Ribeira (2025)
Amenity Prevalence
Amenity Insights for Ribeira
- Essential amenities in Ribeira that guests expect include: Kitchen, TV, Washer. Lacking these (any) could significantly impact bookings.
- Popular amenities like Hot water, Essentials, Dishes and silverware are common but not universal. Offering these can provide a competitive edge.
Recommendations for Hosts
- Ensure your listing includes all essential amenities for Ribeira: Kitchen, TV, Washer.
- Prioritize adding missing essentials: Kitchen, TV, Washer.
- Consider adding popular differentiators like Hot water or Essentials to increase appeal.
- Highlight unique or less common amenities you offer (e.g., hot tub, dedicated workspace, EV charger) in your listing description and photos.
- Regularly check competitor amenities in Ribeira to stay competitive.
Ribeira Airbnb Guest Demographics & Profile Analysis (2025)
Guest Profile Summary for Ribeira
- The typical guest profile for Airbnb in Ribeira consists of primarily domestic travelers (75%), often arriving from nearby Madrid, typically belonging to the Post-2000s (Gen Z/Alpha) group (50%), primarily speaking Spanish or English.
- Domestic travelers account for 74.6% of guests.
- Key international markets include Spain (74.6%) and Portugal (4.2%).
- Top languages spoken are Spanish (38%) followed by English (29.2%).
- A significant demographic segment is the Post-2000s (Gen Z/Alpha) group, representing 50% of guests.
Recommendations for Hosts
- Target domestic marketing efforts towards travelers from Madrid and Galicia.
- Tailor amenities and listing descriptions to appeal to the dominant Post-2000s (Gen Z/Alpha) demographic (e.g., highlight fast WiFi, smart home features, local guides).
- Highlight unique local experiences or amenities relevant to the primary guest profile.
- Consider seasonal promotions aligned with peak travel times for key origin markets.
Nearby Short-Term Rental Market Comparison
How does the Ribeira Airbnb market stack up against its neighbors? Compare key performance metrics like average monthly revenue, ADR, and occupancy rates in surrounding areas to understand the broader regional STR landscape.
| Market | Active Properties | Monthly Revenue | Daily Rate | Avg. Occupancy |
|---|---|---|---|---|
| Penhalonga e Paços de Gaiolo | 23 | $4,193 | $340.45 | 44% |
| Sande e São Lourenço do Douro | 15 | $2,998 | $311.12 | 39% |
| Armamar | 59 | $2,357 | $253.66 | 38% |
| Alijó | 64 | $2,217 | $264.67 | 32% |
| Cinfães | 17 | $1,948 | $252.01 | 32% |
| Mesão Frio | 53 | $1,907 | $195.39 | 46% |
| Porto | 7,887 | $1,900 | $128.19 | 53% |
| Outes | 31 | $1,837 | $223.97 | 38% |
| Anreade e São Romão de Arego | 14 | $1,836 | $184.41 | 39% |
| Vila Nova de Gaia | 1,097 | $1,836 | $138.57 | 52% |