Oia Airbnb Market Analysis 2025: Short Term Rental Data & Vacation Rental Statistics in Galicia, Spain
Is Airbnb profitable in Oia in 2025? Explore comprehensive Airbnb analytics for Oia, Galicia, Spain to uncover income potential. This 2025 STR market report for Oia, based on AirROI data from April 2024 to March 2025, reveals key trends in the niche market of 29 active listings.
Whether you're considering an Airbnb investment in Oia, optimizing your existing vacation rental, or exploring rental arbitrage opportunities, understanding the Oia Airbnb data is crucial. Navigating the high regulation landscape is key to maximizing your short term rental income potential. Let's dive into the specifics.
Key Oia Airbnb Performance Metrics Overview
Monthly Airbnb Revenue Variations & Income Potential in Oia (2025)
Understanding the monthly revenue variations for Airbnb listings in Oia is key to maximizing your short term rental income potential. Seasonality significantly impacts earnings. Our analysis, based on data from the past 12 months, shows that the peak revenue month for STRs in Oia is typically August, while February often presents the lowest earnings, highlighting opportunities for strategic pricing adjustments during shoulder and low seasons. Explore the typical Airbnb income in Oia across different performance tiers:
- Best-in-class properties (Top 10%) achieve $2,799+ monthly, often utilizing dynamic pricing and superior guest experiences.
- Strong performing properties (Top 25%) earn $1,250 or more, indicating effective management and desirable locations/amenities.
- Typical properties (Median) generate around $665 per month, representing the average market performance.
- Entry-level properties (Bottom 25%) see earnings around $366, often with potential for optimization.
Average Monthly Airbnb Earnings Trend in Oia
Oia Airbnb Occupancy Rate Trends (2025)
Maximize your bookings by understanding the Oia STR occupancy trends. Seasonal demand shifts significantly influence how often properties are booked. Typically, Augustsees the highest demand (peak season occupancy), while January experiences the lowest (low season). Effective strategies, like adjusting minimum stays or offering promotions, can boost occupancy during slower periods. Here's how different property tiers perform in Oia:
- Best-in-class properties (Top 10%) achieve 52%+ occupancy, indicating high desirability and potentially optimized availability.
- Strong performing properties (Top 25%) maintain 33% or higher occupancy, suggesting good market fit and guest satisfaction.
- Typical properties (Median) have an occupancy rate around 20%.
- Entry-level properties (Bottom 25%) average 10% occupancy, potentially facing higher vacancy.
Average Monthly Occupancy Rate Trend in Oia
Average Daily Rate (ADR) Airbnb Trends in Oia (2025)
Effective short term rental pricing strategy in Oia involves understanding monthly ADR fluctuations. The Average Daily Rate (ADR) for Airbnb in Oia typically peaks in November and dips lowest during May. Leveraging Airbnb dynamic pricing tools or strategies based on this seasonality can significantly boost revenue. Here's a look at the typical nightly rates achieved:
- Best-in-class properties (Top 10%) command rates of $395+ per night, often due to premium features or locations.
- Strong performing properties (Top 25%) achieve nightly rates of $176 or more.
- Typical properties (Median) charge around $120 per night.
- Entry-level properties (Bottom 25%) earn around $75 per night.
Average Daily Rate (ADR) Trend by Month in Oia
Get Live Oia Market Intelligence 👇

Explore Real-time Analytics
Airbnb Seasonality Analysis & Trends in Oia (2025)
Peak Season (August, July, June)
- Revenue averages $2,279 per month
- Occupancy rates average 40.7%
- Daily rates average $161
Shoulder Season
- Revenue averages $910 per month
- Occupancy maintains around 22.2%
- Daily rates hold near $164
Low Season (January, February, March)
- Revenue drops to average $418 per month
- Occupancy decreases to average 13.4%
- Daily rates adjust to average $164
Seasonality Insights for Oia
- The Airbnb seasonality in Oia shows highly seasonal trends requiring careful strategy. While the sections above show seasonal averages, it's also insightful to look at the extremes:
- During the high season, the absolute peak month showcases Oia's highest earning potential, with monthly revenues capable of climbing to $3,615, occupancy reaching a high of 63.8%, and ADRs peaking at $179.
- Conversely, the slowest single month of the year, typically falling within the low season, marks the market's lowest point. In this month, revenue might dip to $363, occupancy could drop to 11.4%, and ADRs may adjust down to $157.
- Understanding both the seasonal averages and these monthly peaks and troughs in revenue, occupancy, and ADR is crucial for maximizing your Airbnb profit potential in Oia.
Seasonal Strategies for Maximizing Profit
- Peak Season: Maximize revenue through premium pricing and potentially longer minimum stays. Ensure high availability.
- Low Season: Offer competitive pricing, special promotions (e.g., extended stay discounts), and flexible cancellation policies. Target off-season travelers like remote workers or budget-conscious guests.
- Shoulder Seasons: Implement dynamic pricing that balances peak and low rates. Target weekend travelers or specific events. Offer slightly more flexible terms than peak season.
- Regularly analyze your own performance against these Oia seasonality benchmarks and adjust your pricing and availability strategy accordingly.
Best Areas for Airbnb Investment in Oia (2025)
Exploring the top neighborhoods for short-term rentals in Oia? This section highlights key areas, outlining why they are attractive for hosts and guests, along with notable local attractions. Consider these locations based on your target guest profile and investment strategy.
| Neighborhood / Area | Why Host Here? (Target Guests & Appeal) | Key Attractions & Landmarks |
|---|---|---|
| Oia Town | Charming coastal village known for its picturesque views and stunning sunsets. A popular destination for couples and photographers, providing a romantic setting for guests seeking a unique experience by the sea. | Oia Castle, Amoudi Bay, Santo Winery, The Blue Boat, Skaros Rock |
| Cape Silleiro | A beautiful natural area with breathtaking cliffs and panoramic ocean views. Perfect for nature lovers and outdoor enthusiasts looking to explore Galicia's coastal beauty. | Cape Silleiro Lighthouse, Hiking trails, Rocky beaches, Marine wildlife watching |
| Vikings Cemetery | A historical site rich in culture and legend, attracting history buffs and visitors interested in the local folklore. Provides a unique cultural experience for guests. | Cemetery of the Vikings, Local legends, Galician history tours |
| San Pedro de Oia | A less crowded area with authentic Galician culture and local cuisine. Ideal for guests who want to experience the local lifestyle away from the tourist spots. | San Pedro Church, Local seafood restaurants, Cultural festivals |
| Guía de Isora | Known for its volcanic landscapes and hiking opportunities, this area attracts adventurers and nature enthusiasts looking to explore beyond typical tourist routes. | Hiking trails, Volcanic beaches, Natural parks |
| Cabo Home | A stunning cape offering amazing views and access to secluded beaches. Appeals to travelers seeking peace and tranquility in a natural setting. | Cabo Home Light House, Beautiful beaches, Secluded picnic spots |
| Pazo de Rubianes | A historic Galician manor known for its gardens and wine production, appealing to guests interested in local culture and agritourism experiences. | Gardens, Wine tours, Historical architecture |
| A Guarda | A coastal town near the border with Portugal, famous for its seafood and scenic walks along the coastline. Great for those wanting a blend of culture, cuisine, and nature. | Beach of A Guarda, Castle of Santa Cruz, Local seafood market |
Understanding Airbnb License Requirements & STR Laws in Oia (2025)
Yes, Oia, Galicia, Spain enforces high STR regulations. Obtaining a license and ensuring compliance is almost certainly required according to current 2025 STR laws. Always verify the latest short term rental regulations and Airbnb license requirements directly with local government authorities for Oia to ensure full compliance before hosting.
(Source: AirROI data, 2025, based on 38% licensed listings)
Top Performing Airbnb Properties in Oia (2025)
Benchmark your potential! Explore examples of top-performing Airbnb properties in Oiabased on Trailing Twelve Month (TTM) revenue. Analyze their characteristics, revenue, occupancy rate, and ADR to understand what drives success in this market.
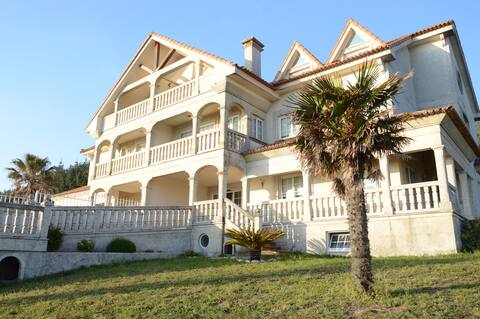
Holibai. Vila Arume Experience of Luxe en Galicia
Entire Place • 5 bedrooms
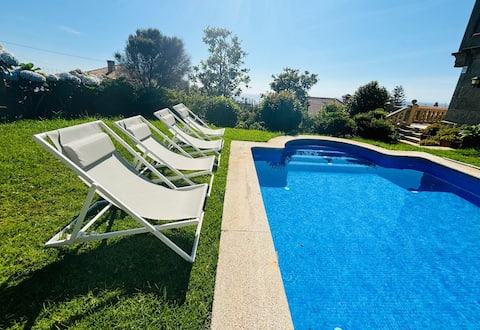
House with swimming pool and ocean view
Entire Place • 6 bedrooms
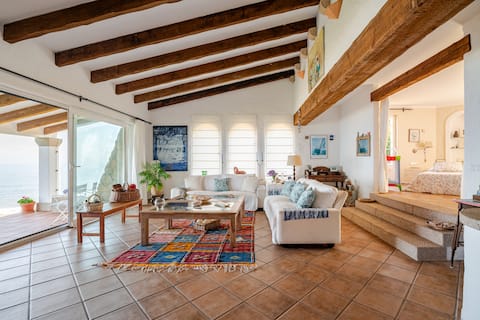
House with amazing view to the sea.
Entire Place • 4 bedrooms

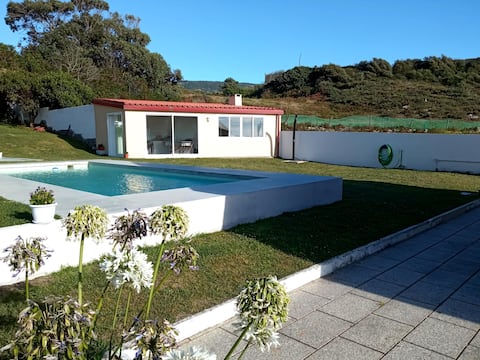
Casa Vista al Mar cerca de Baiona
Entire Place • 3 bedrooms

Teresa Caeiro
Entire Place • 2 bedrooms
Relaxing seaside getaway
Entire Place • 1 bedroom
Note: Performance varies based on location, size, amenities, seasonality, and management quality. Data reflects the past 12 months.
Top Performing Airbnb Hosts in Oia (2025)
Learn from the best! This table showcases top-performing Airbnb hosts in Oia based on the number of properties managed and estimated total revenue over the past year. Analyze their scale and performance metrics.
| Host Name | Properties | Grossing Revenue | Stay Reviews | Avg Rating |
|---|---|---|---|---|
| Holi | 1 | $42,155 | 4 | 5.00/5.0 |
| Jaime | 2 | $34,807 | 94 | 4.89/5.0 |
| Pablo | 2 | $24,771 | 28 | 4.93/5.0 |
| Begoña | 4 | $23,449 | 112 | 4.98/5.0 |
| Maria | 1 | $22,587 | 50 | 4.98/5.0 |
| Sheila | 1 | $21,162 | 15 | 4.93/5.0 |
| Venancio | 3 | $17,889 | 23 | 3.17/5.0 |
| Lorena | 1 | $17,250 | 17 | 4.88/5.0 |
| Jose | 1 | $16,999 | 44 | 4.80/5.0 |
| Carmen | 1 | $13,420 | 8 | 5.00/5.0 |
Analyzing the strategies of top hosts, such as their property selection, pricing, and guest communication, can offer valuable lessons for optimizing your own Airbnb operations in Oia.
Dive Deeper: Advanced Oia STR Market Data (2025)
Ready to unlock more insights? AirROI provides access to advanced metrics and comprehensive Airbnb data for Oia. Explore detailed analytics beyond this report to refine your investment strategy, optimize pricing, and maximize your vacation rental profits.
Explore Advanced MetricsOia Short-Term Rental Market Composition (2025): Property & Room Types
Room Type Distribution
Property Type Distribution
Market Composition Insights for Oia
- The Oia Airbnb market composition is heavily skewed towards Entire Home/Apt listings, which make up 65.5% of the 29 active rentals. This indicates strong guest preference for privacy and space.
- However, a notable 34.5% share for Private Rooms suggests opportunities for budget-conscious travelers or hosts renting out spare rooms.
- Looking at the property type distribution in Oia, House properties are the most common (69%), reflecting the local real estate landscape.
- Houses represent a significant 69% portion, catering likely to families or larger groups.
- The presence of 24.1% Hotel/Boutique listings indicates integration with traditional hospitality.
Oia Airbnb Room Capacity Analysis (2025): Bedroom Distribution
Distribution of Listings by Number of Bedrooms
Room Capacity Insights for Oia
- The dominant room capacity in Oia is 3 bedrooms listings, making up 20.7% of the market. This suggests a strong demand for properties suitable for families or small groups.
- Together, 3 bedrooms and 2 bedrooms properties represent 34.5% of the active Airbnb listings in Oia, indicating a high concentration in these sizes.
- A significant 44.8% of listings offer 3+ bedrooms, catering to larger groups and families seeking more space in Oia.
Oia Vacation Rental Guest Capacity Trends (2025)
Distribution of Listings by Guest Capacity
Guest Capacity Insights for Oia
- The most common guest capacity trend in Oia vacation rentals is listings accommodating 8+ guests (27.6%). This suggests the primary traveler segment is likely larger groups.
- Properties designed for 8+ guests and 4 guests dominate the Oia STR market, accounting for 48.3% of listings.
- 41.3% of properties accommodate 6+ guests, serving the market segment for larger families or group travel in Oia.
- On average, properties in Oia are equipped to host 4.0 guests.
Oia Airbnb Booking Patterns (2025): Available vs. Booked Days
Available Days Distribution
Booked Days Distribution
Booking Pattern Insights for Oia
- The most common availability pattern in Oia falls within the 271-366 days range, representing 69% of listings. This suggests many properties have significant open periods on their calendars.
- Approximately 100.0% of listings show high availability (181+ days open annually), indicating potential for increased bookings or specific owner usage patterns.
- For booked days, the 31-90 days range is most frequent in Oia (44.8%), reflecting common guest stay durations or potential owner blocking patterns.
Oia Airbnb Minimum Stay Requirements Analysis
Distribution of Listings by Minimum Night Requirement
1 Night
14 listings
48.3% of total
2 Nights
6 listings
20.7% of total
3 Nights
2 listings
6.9% of total
4-6 Nights
4 listings
13.8% of total
7-29 Nights
1 listings
3.4% of total
30+ Nights
2 listings
6.9% of total
Key Insights
- The most prevalent minimum stay requirement in Oia is 1 Night, adopted by 48.3% of listings. This highlights the market's preference for shorter, flexible bookings.
- A strong majority (69.0%) of the Oia Airbnb data shows acceptance of very short stays (1-2 nights), indicating a dynamic, high-turnover market.
Recommendations
- Align with the market by considering a 1 Night minimum stay, as 48.3% of Oia hosts use this setting.
- Explore offering discounts for stays of 30+ nights to attract the 6.9% of the market seeking extended stays.
- Adjust minimum nights based on seasonality – potentially shorter during low season and longer during peak demand periods in Oia.
Oia Airbnb Cancellation Policy Trends Analysis (2025)
Flexible
7 listings
25.9% of total
Moderate
8 listings
29.6% of total
Firm
3 listings
11.1% of total
Strict
9 listings
33.3% of total
Cancellation Policy Insights for Oia
- The prevailing Airbnb cancellation policy trend in Oia is Strict, used by 33.3% of listings.
- There's a relatively balanced mix between guest-friendly (55.5%) and stricter (44.4%) policies, offering choices for different guest needs.
Recommendations for Hosts
- Consider adopting a Strict policy to align with the 33.3% market standard in Oia.
- With 33.3% using Strict terms, this is a viable option in Oia, particularly for high-value properties or during peak demand periods.
- Regularly review your cancellation policy against competitors and market demand shifts in Oia.
Oia STR Booking Lead Time Analysis (2025)
Average Booking Lead Time by Month
Booking Lead Time Insights for Oia
- The overall average booking lead time for vacation rentals in Oia is 60 days.
- Guests book furthest in advance for stays during May (average 107 days), likely coinciding with peak travel demand or local events.
- The shortest booking windows occur for stays in February (average 18 days), indicating more last-minute travel plans during this time.
- Seasonally, Summer (92 days avg.) sees the longest lead times, while Winter (22 days avg.) has the shortest, reflecting typical travel planning cycles.
Recommendations for Hosts
- Use the overall average lead time (60 days) as a baseline for your pricing and availability strategy in Oia.
- For May stays, consider implementing length-of-stay discounts or slightly higher rates for bookings made less than 107 days out to capitalize on advance planning.
- Target marketing efforts for the Summer season well in advance (at least 92 days) to capture early planners.
- Monitor your own booking lead times against these Oia averages to identify opportunities for dynamic pricing adjustments.
Popular & Essential Airbnb Amenities in Oia (2025)
Amenity Prevalence
Amenity Insights for Oia
- Popular amenities like Free parking on premises, Kitchen, TV are common but not universal. Offering these can provide a competitive edge.
- Warning: Wifi is not universally provided but is considered essential globally. Ensure reliable Wifi is offered.
Recommendations for Hosts
- Consider adding popular differentiators like Free parking on premises or Kitchen to increase appeal.
- Highlight unique or less common amenities you offer (e.g., hot tub, dedicated workspace, EV charger) in your listing description and photos.
- Regularly check competitor amenities in Oia to stay competitive.
Oia Airbnb Guest Demographics & Profile Analysis (2025)
Guest Profile Summary for Oia
- The typical guest profile for Airbnb in Oia consists of a mix of domestic (39%) and international guests, with top international origins including Germany, typically belonging to the Post-2000s (Gen Z/Alpha) group (50%), primarily speaking English or Spanish.
- Domestic travelers account for 39.0% of guests.
- Key international markets include Spain (39%) and Germany (11.7%).
- Top languages spoken are English (40.6%) followed by Spanish (20.3%).
- A significant demographic segment is the Post-2000s (Gen Z/Alpha) group, representing 50% of guests.
Recommendations for Hosts
- Focus marketing internationally, particularly towards travelers from Germany.
- Tailor amenities and listing descriptions to appeal to the dominant Post-2000s (Gen Z/Alpha) demographic (e.g., highlight fast WiFi, smart home features, local guides).
- Highlight unique local experiences or amenities relevant to the primary guest profile.
- Consider seasonal promotions aligned with peak travel times for key origin markets.
Nearby Short-Term Rental Market Comparison
How does the Oia Airbnb market stack up against its neighbors? Compare key performance metrics like average monthly revenue, ADR, and occupancy rates in surrounding areas to understand the broader regional STR landscape.
| Market | Active Properties | Monthly Revenue | Daily Rate | Avg. Occupancy |
|---|---|---|---|---|
| Penhalonga e Paços de Gaiolo | 23 | $4,193 | $340.45 | 44% |
| Sande e São Lourenço do Douro | 15 | $2,998 | $311.12 | 39% |
| Armamar | 59 | $2,357 | $253.66 | 38% |
| Alijó | 64 | $2,217 | $264.67 | 32% |
| Cinfães | 17 | $1,948 | $252.01 | 32% |
| Mesão Frio | 53 | $1,907 | $195.39 | 46% |
| Porto | 7,887 | $1,900 | $128.19 | 53% |
| Outes | 31 | $1,837 | $223.97 | 38% |
| Anreade e São Romão de Arego | 14 | $1,836 | $184.41 | 39% |
| Vila Nova de Gaia | 1,097 | $1,836 | $138.57 | 52% |