Laxe Airbnb Market Analysis 2025: Short Term Rental Data & Vacation Rental Statistics in Galicia, Spain
Is Airbnb profitable in Laxe in 2025? Explore comprehensive Airbnb analytics for Laxe, Galicia, Spain to uncover income potential. This 2025 STR market report for Laxe, based on AirROI data from April 2024 to March 2025, reveals key trends in the niche market of 67 active listings.
Whether you're considering an Airbnb investment in Laxe, optimizing your existing vacation rental, or exploring rental arbitrage opportunities, understanding the Laxe Airbnb data is crucial. Understanding the local regulations is key to maximizing your short term rental income potential. Let's dive into the specifics.
Key Laxe Airbnb Performance Metrics Overview
Monthly Airbnb Revenue Variations & Income Potential in Laxe (2025)
Understanding the monthly revenue variations for Airbnb listings in Laxe is key to maximizing your short term rental income potential. Seasonality significantly impacts earnings. Our analysis, based on data from the past 12 months, shows that the peak revenue month for STRs in Laxe is typically August, while November often presents the lowest earnings, highlighting opportunities for strategic pricing adjustments during shoulder and low seasons. Explore the typical Airbnb income in Laxe across different performance tiers:
- Best-in-class properties (Top 10%) achieve $2,536+ monthly, often utilizing dynamic pricing and superior guest experiences.
- Strong performing properties (Top 25%) earn $1,575 or more, indicating effective management and desirable locations/amenities.
- Typical properties (Median) generate around $875 per month, representing the average market performance.
- Entry-level properties (Bottom 25%) see earnings around $471, often with potential for optimization.
Average Monthly Airbnb Earnings Trend in Laxe
Laxe Airbnb Occupancy Rate Trends (2025)
Maximize your bookings by understanding the Laxe STR occupancy trends. Seasonal demand shifts significantly influence how often properties are booked. Typically, Augustsees the highest demand (peak season occupancy), while November experiences the lowest (low season). Effective strategies, like adjusting minimum stays or offering promotions, can boost occupancy during slower periods. Here's how different property tiers perform in Laxe:
- Best-in-class properties (Top 10%) achieve 55%+ occupancy, indicating high desirability and potentially optimized availability.
- Strong performing properties (Top 25%) maintain 40% or higher occupancy, suggesting good market fit and guest satisfaction.
- Typical properties (Median) have an occupancy rate around 23%.
- Entry-level properties (Bottom 25%) average 14% occupancy, potentially facing higher vacancy.
Average Monthly Occupancy Rate Trend in Laxe
Average Daily Rate (ADR) Airbnb Trends in Laxe (2025)
Effective short term rental pricing strategy in Laxe involves understanding monthly ADR fluctuations. The Average Daily Rate (ADR) for Airbnb in Laxe typically peaks in August and dips lowest during February. Leveraging Airbnb dynamic pricing tools or strategies based on this seasonality can significantly boost revenue. Here's a look at the typical nightly rates achieved:
- Best-in-class properties (Top 10%) command rates of $199+ per night, often due to premium features or locations.
- Strong performing properties (Top 25%) achieve nightly rates of $143 or more.
- Typical properties (Median) charge around $109 per night.
- Entry-level properties (Bottom 25%) earn around $81 per night.
Average Daily Rate (ADR) Trend by Month in Laxe
Get Live Laxe Market Intelligence 👇

Explore Real-time Analytics
Airbnb Seasonality Analysis & Trends in Laxe (2025)
Peak Season (August, July, June)
- Revenue averages $2,158 per month
- Occupancy rates average 48.3%
- Daily rates average $130
Shoulder Season
- Revenue averages $971 per month
- Occupancy maintains around 23.6%
- Daily rates hold near $119
Low Season (February, March, November)
- Revenue drops to average $637 per month
- Occupancy decreases to average 17.4%
- Daily rates adjust to average $113
Seasonality Insights for Laxe
- The Airbnb seasonality in Laxe shows highly seasonal trends requiring careful strategy. While the sections above show seasonal averages, it's also insightful to look at the extremes:
- During the high season, the absolute peak month showcases Laxe's highest earning potential, with monthly revenues capable of climbing to $2,733, occupancy reaching a high of 62.6%, and ADRs peaking at $135.
- Conversely, the slowest single month of the year, typically falling within the low season, marks the market's lowest point. In this month, revenue might dip to $560, occupancy could drop to 16.2%, and ADRs may adjust down to $112.
- Understanding both the seasonal averages and these monthly peaks and troughs in revenue, occupancy, and ADR is crucial for maximizing your Airbnb profit potential in Laxe.
Seasonal Strategies for Maximizing Profit
- Peak Season: Maximize revenue through premium pricing and potentially longer minimum stays. Ensure high availability.
- Low Season: Offer competitive pricing, special promotions (e.g., extended stay discounts), and flexible cancellation policies. Target off-season travelers like remote workers or budget-conscious guests.
- Shoulder Seasons: Implement dynamic pricing that balances peak and low rates. Target weekend travelers or specific events. Offer slightly more flexible terms than peak season.
- Regularly analyze your own performance against these Laxe seasonality benchmarks and adjust your pricing and availability strategy accordingly.
Best Areas for Airbnb Investment in Laxe (2025)
Exploring the top neighborhoods for short-term rentals in Laxe? This section highlights key areas, outlining why they are attractive for hosts and guests, along with notable local attractions. Consider these locations based on your target guest profile and investment strategy.
| Neighborhood / Area | Why Host Here? (Target Guests & Appeal) | Key Attractions & Landmarks |
|---|---|---|
| Laxe Beach | A beautiful coastal area known for its serene beaches and picturesque views. Ideal for guests looking for a relaxing beach getaway and access to outdoor activities like swimming and surfing. | Laxe Beach, Punta de Laxe, Castillo de Laxe, Natural Park of Traba, Local seafood restaurants |
| Vila de Laxe | The charming town center that offers a blend of traditional Galician culture and modern amenities. A great location for tourists wanting to explore local shops and restaurants while being close to the coast. | Church of Santa María, Laxe's promenade, Local markets, Cultural festivals, Artisan shops |
| Camariñas | Famous for its lace-making and stunning coastal views, this area attracts visitors interested in culture and nature. Perfect for guests wanting to explore the natural landscapes and local heritage. | Camariñas Lighthouse, Ethnographic Museum of Camariñas, Praia do Lago, Nearby hiking trails, Maritimewalk |
| Arou | A quiet village offering a tranquil escape with lovely beaches and hiking opportunities. Ideal for families and travelers seeking a peaceful stay away from busy tourist spots. | Praia de Arou, Natural landscapes, Rural tourism experiences, Fishing spots, Secluded beaches |
| Flores | Known for its rich flora and scenic beauty, this area is perfect for nature lovers and outdoor enthusiasts. Visitors can enjoy hiking and exploring the diverse landscapes. | Natural parks, Flora and fauna observation, Hiking trails, Local wildlife, Photography spots |
| Muxía | Rich in history and stunning sea views, Muxía is famous for its pilgrimage routes and traditional architecture. Ideal for cultural travelers and those seeking spiritual experiences. | Santuario da Virxe da Barca, Cabo de Touriñán, Local history museums, Beautiful cliffs, Pilgrimage routes |
| Punta da Gata | A scenic point that offers breathtaking views of the ocean and surrounding landscapes. Great for guests who enjoy photography and nature activities. | Stunning cliffs, Ocean vistas, Wildlife observation, Hiking trails, Beautiful sunsets |
| Baldaio | Renowned for its natural beauty and calm waters, making it a perfect spot for relaxation and water sports. Attracts outdoor enthusiasts and families. | Baldaio Beach, Water sports activities, Natural reserves, Wildlife watching, Local cafes and eateries |
Understanding Airbnb License Requirements & STR Laws in Laxe (2025)
With 24% of listings showing registration in 2025, understanding potential Airbnb license requirements is crucial in Laxe. Always verify the latest short term rental regulations and Airbnb license requirements directly with local government authorities for Laxe to ensure full compliance before hosting.
(Source: AirROI data, 2025, based on 24% licensed listings)
Top Performing Airbnb Properties in Laxe (2025)
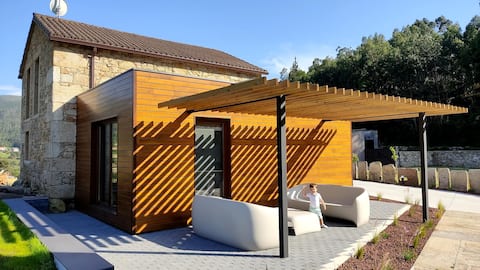
Benchmark your potential! Explore examples of top-performing Airbnb properties in Laxebased on Trailing Twelve Month (TTM) revenue. Analyze their characteristics, revenue, occupancy rate, and ADR to understand what drives success in this market.

Casa A Braña
Entire Place • 5 bedrooms
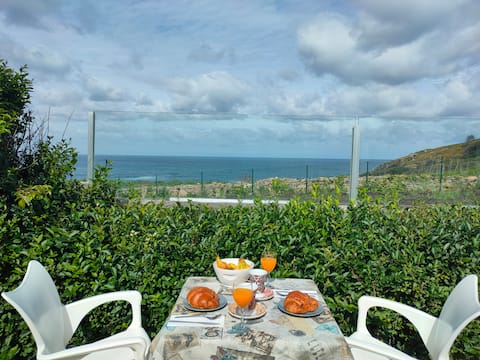
A Casa de Costa - Cottage with a Ocean View
Entire Place • 2 bedrooms

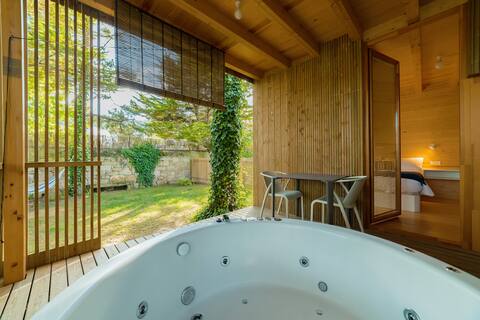
A Casa de Elisa - Ocean View Cottage
Entire Place • 3 bedrooms
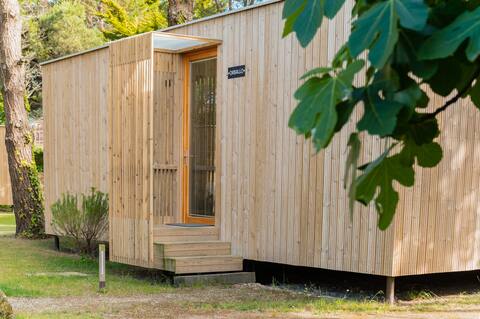
Cabin with private garden and beautiful views
Entire Place • 2 bedrooms
Entire Place • 2 bedrooms
Entire Place • 1 bedroom
Note: Performance varies based on location, size, amenities, seasonality, and management quality. Data reflects the past 12 months.
Top Performing Airbnb Hosts in Laxe (2025)
Learn from the best! This table showcases top-performing Airbnb hosts in Laxe based on the number of properties managed and estimated total revenue over the past year. Analyze their scale and performance metrics.
| Host Name | Properties | Grossing Revenue | Stay Reviews | Avg Rating |
|---|---|---|---|---|
| Julia | 3 | $64,398 | 79 | 4.97/5.0 |
| Jose | 4 | $64,259 | 64 | 4.88/5.0 |
| Rocio | 10 | $44,623 | 79 | 2.86/5.0 |
| Javier | 3 | $43,285 | 170 | 4.90/5.0 |
| Sergio | 2 | $39,447 | 17 | 2.47/5.0 |
| Francisco | 3 | $28,004 | 65 | 4.86/5.0 |
| Iván | 1 | $15,573 | 7 | 5.00/5.0 |
| Host #241943770 | 2 | $15,082 | 0 | 0.00/5.0 |
| Maria Jesus | 1 | $14,916 | 26 | 4.92/5.0 |
| Host #103802710 | 1 | $13,673 | 1 | 0.00/5.0 |
Analyzing the strategies of top hosts, such as their property selection, pricing, and guest communication, can offer valuable lessons for optimizing your own Airbnb operations in Laxe.
Dive Deeper: Advanced Laxe STR Market Data (2025)
Ready to unlock more insights? AirROI provides access to advanced metrics and comprehensive Airbnb data for Laxe. Explore detailed analytics beyond this report to refine your investment strategy, optimize pricing, and maximize your vacation rental profits.
Explore Advanced MetricsLaxe Short-Term Rental Market Composition (2025): Property & Room Types
Room Type Distribution
Property Type Distribution
Market Composition Insights for Laxe
- The Laxe Airbnb market composition is heavily skewed towards Entire Home/Apt listings, which make up 98.5% of the 67 active rentals. This indicates strong guest preference for privacy and space.
- Looking at the property type distribution in Laxe, Apartment/Condo properties are the most common (62.7%), reflecting the local real estate landscape.
- Houses represent a significant 28.4% portion, catering likely to families or larger groups.
Laxe Airbnb Room Capacity Analysis (2025): Bedroom Distribution
Distribution of Listings by Number of Bedrooms
Room Capacity Insights for Laxe
- The dominant room capacity in Laxe is 2 bedrooms listings, making up 49.3% of the market. This suggests a strong demand for properties suitable for couples or solo travelers.
- Together, 2 bedrooms and 3 bedrooms properties represent 79.2% of the active Airbnb listings in Laxe, indicating a high concentration in these sizes.
- A significant 40.4% of listings offer 3+ bedrooms, catering to larger groups and families seeking more space in Laxe.
Laxe Vacation Rental Guest Capacity Trends (2025)
Distribution of Listings by Guest Capacity
Guest Capacity Insights for Laxe
- The most common guest capacity trend in Laxe vacation rentals is listings accommodating 4 guests (41.8%). This suggests the primary traveler segment is likely small families or groups.
- Properties designed for 4 guests and 6 guests dominate the Laxe STR market, accounting for 59.7% of listings.
- 38.8% of properties accommodate 6+ guests, serving the market segment for larger families or group travel in Laxe.
- On average, properties in Laxe are equipped to host 5.1 guests.
Laxe Airbnb Booking Patterns (2025): Available vs. Booked Days
Available Days Distribution
Booked Days Distribution
Booking Pattern Insights for Laxe
- The most common availability pattern in Laxe falls within the 271-366 days range, representing 76.1% of listings. This suggests many properties have significant open periods on their calendars.
- Approximately 98.5% of listings show high availability (181+ days open annually), indicating potential for increased bookings or specific owner usage patterns.
- For booked days, the 31-90 days range is most frequent in Laxe (47.8%), reflecting common guest stay durations or potential owner blocking patterns.
- A notable 1.5% of properties secure long booking periods (181+ days booked per year), highlighting successful long-term rental strategies or significant owner usage.
Laxe Airbnb Minimum Stay Requirements Analysis
Distribution of Listings by Minimum Night Requirement
1 Night
23 listings
37.1% of total
2 Nights
13 listings
21% of total
3 Nights
8 listings
12.9% of total
4-6 Nights
13 listings
21% of total
30+ Nights
5 listings
8.1% of total
Key Insights
- The most prevalent minimum stay requirement in Laxe is 1 Night, adopted by 37.1% of listings. This highlights the market's preference for shorter, flexible bookings.
Recommendations
- Align with the market by considering a 1 Night minimum stay, as 37.1% of Laxe hosts use this setting.
- Explore offering discounts for stays of 30+ nights to attract the 8.1% of the market seeking extended stays.
- Adjust minimum nights based on seasonality – potentially shorter during low season and longer during peak demand periods in Laxe.
Laxe Airbnb Cancellation Policy Trends Analysis (2025)
Flexible
6 listings
11.8% of total
Moderate
15 listings
29.4% of total
Firm
13 listings
25.5% of total
Strict
17 listings
33.3% of total
Cancellation Policy Insights for Laxe
- The prevailing Airbnb cancellation policy trend in Laxe is Strict, used by 33.3% of listings.
- A majority (58.8%) of hosts in Laxe utilize Firm or Strict policies, indicating a market where hosts prioritize booking security.
Recommendations for Hosts
- Consider adopting a Strict policy to align with the 33.3% market standard in Laxe.
- With 33.3% using Strict terms, this is a viable option in Laxe, particularly for high-value properties or during peak demand periods.
- Regularly review your cancellation policy against competitors and market demand shifts in Laxe.
Laxe STR Booking Lead Time Analysis (2025)
Average Booking Lead Time by Month
Booking Lead Time Insights for Laxe
- The overall average booking lead time for vacation rentals in Laxe is 71 days.
- Guests book furthest in advance for stays during June (average 127 days), likely coinciding with peak travel demand or local events.
- The shortest booking windows occur for stays in February (average 19 days), indicating more last-minute travel plans during this time.
- Seasonally, Summer (109 days avg.) sees the longest lead times, while Winter (32 days avg.) has the shortest, reflecting typical travel planning cycles.
Recommendations for Hosts
- Use the overall average lead time (71 days) as a baseline for your pricing and availability strategy in Laxe.
- For June stays, consider implementing length-of-stay discounts or slightly higher rates for bookings made less than 127 days out to capitalize on advance planning.
- Target marketing efforts for the Summer season well in advance (at least 109 days) to capture early planners.
- Monitor your own booking lead times against these Laxe averages to identify opportunities for dynamic pricing adjustments.
Popular & Essential Airbnb Amenities in Laxe (2025)
Amenity Prevalence
Amenity Insights for Laxe
- Essential amenities in Laxe that guests expect include: Kitchen, TV, Hot water. Lacking these (any) could significantly impact bookings.
- Popular amenities like Essentials, Washer, Cooking basics are common but not universal. Offering these can provide a competitive edge.
Recommendations for Hosts
- Ensure your listing includes all essential amenities for Laxe: Kitchen, TV, Hot water.
- Prioritize adding missing essentials: Kitchen, TV, Hot water.
- Consider adding popular differentiators like Essentials or Washer to increase appeal.
- Highlight unique or less common amenities you offer (e.g., hot tub, dedicated workspace, EV charger) in your listing description and photos.
- Regularly check competitor amenities in Laxe to stay competitive.
Laxe Airbnb Guest Demographics & Profile Analysis (2025)
Guest Profile Summary for Laxe
- The typical guest profile for Airbnb in Laxe consists of a mix of domestic (58%) and international guests, often arriving from nearby Madrid, typically belonging to the Post-2000s (Gen Z/Alpha) group (50%), primarily speaking English or Spanish.
- Domestic travelers account for 57.7% of guests.
- Key international markets include Spain (57.7%) and France (9.2%).
- Top languages spoken are English (33.6%) followed by Spanish (29.3%).
- A significant demographic segment is the Post-2000s (Gen Z/Alpha) group, representing 50% of guests.
Recommendations for Hosts
- Balance marketing efforts between domestic and international channels based on the guest mix.
- Tailor amenities and listing descriptions to appeal to the dominant Post-2000s (Gen Z/Alpha) demographic (e.g., highlight fast WiFi, smart home features, local guides).
- Highlight unique local experiences or amenities relevant to the primary guest profile.
- Consider seasonal promotions aligned with peak travel times for key origin markets.
Nearby Short-Term Rental Market Comparison
How does the Laxe Airbnb market stack up against its neighbors? Compare key performance metrics like average monthly revenue, ADR, and occupancy rates in surrounding areas to understand the broader regional STR landscape.
| Market | Active Properties | Monthly Revenue | Daily Rate | Avg. Occupancy |
|---|---|---|---|---|
| Outes | 31 | $1,837 | $223.97 | 38% |
| Pazos | 10 | $1,698 | $184.98 | 40% |
| Brión | 23 | $1,556 | $229.02 | 40% |
| Santiago de Compostela | 480 | $1,548 | $140.94 | 47% |
| Vedra | 11 | $1,536 | $192.42 | 40% |
| Teo | 50 | $1,487 | $158.59 | 37% |
| A Estrada | 39 | $1,433 | $196.13 | 37% |
| Sigüeiro | 11 | $1,417 | $142.43 | 40% |
| Vila de Cruces | 18 | $1,412 | $177.02 | 30% |
| Mos | 14 | $1,400 | $119.82 | 35% |