Gondomar Airbnb Market Analysis 2025: Short Term Rental Data & Vacation Rental Statistics in Galicia, Spain
Is Airbnb profitable in Gondomar in 2025? Explore comprehensive Airbnb analytics for Gondomar, Galicia, Spain to uncover income potential. This 2025 STR market report for Gondomar, based on AirROI data from April 2024 to March 2025, reveals key trends in the niche market of 52 active listings.
Whether you're considering an Airbnb investment in Gondomar, optimizing your existing vacation rental, or exploring rental arbitrage opportunities, understanding the Gondomar Airbnb data is crucial. Navigating the high regulation landscape is key to maximizing your short term rental income potential. Let's dive into the specifics.
Key Gondomar Airbnb Performance Metrics Overview
Monthly Airbnb Revenue Variations & Income Potential in Gondomar (2025)
Understanding the monthly revenue variations for Airbnb listings in Gondomar is key to maximizing your short term rental income potential. Seasonality significantly impacts earnings. Our analysis, based on data from the past 12 months, shows that the peak revenue month for STRs in Gondomar is typically August, while February often presents the lowest earnings, highlighting opportunities for strategic pricing adjustments during shoulder and low seasons. Explore the typical Airbnb income in Gondomar across different performance tiers:
- Best-in-class properties (Top 10%) achieve $4,527+ monthly, often utilizing dynamic pricing and superior guest experiences.
- Strong performing properties (Top 25%) earn $2,452 or more, indicating effective management and desirable locations/amenities.
- Typical properties (Median) generate around $1,156 per month, representing the average market performance.
- Entry-level properties (Bottom 25%) see earnings around $581, often with potential for optimization.
Average Monthly Airbnb Earnings Trend in Gondomar
Gondomar Airbnb Occupancy Rate Trends (2025)
Maximize your bookings by understanding the Gondomar STR occupancy trends. Seasonal demand shifts significantly influence how often properties are booked. Typically, Augustsees the highest demand (peak season occupancy), while February experiences the lowest (low season). Effective strategies, like adjusting minimum stays or offering promotions, can boost occupancy during slower periods. Here's how different property tiers perform in Gondomar:
- Best-in-class properties (Top 10%) achieve 51%+ occupancy, indicating high desirability and potentially optimized availability.
- Strong performing properties (Top 25%) maintain 37% or higher occupancy, suggesting good market fit and guest satisfaction.
- Typical properties (Median) have an occupancy rate around 22%.
- Entry-level properties (Bottom 25%) average 10% occupancy, potentially facing higher vacancy.
Average Monthly Occupancy Rate Trend in Gondomar
Average Daily Rate (ADR) Airbnb Trends in Gondomar (2025)
Effective short term rental pricing strategy in Gondomar involves understanding monthly ADR fluctuations. The Average Daily Rate (ADR) for Airbnb in Gondomar typically peaks in November and dips lowest during March. Leveraging Airbnb dynamic pricing tools or strategies based on this seasonality can significantly boost revenue. Here's a look at the typical nightly rates achieved:
- Best-in-class properties (Top 10%) command rates of $425+ per night, often due to premium features or locations.
- Strong performing properties (Top 25%) achieve nightly rates of $304 or more.
- Typical properties (Median) charge around $174 per night.
- Entry-level properties (Bottom 25%) earn around $111 per night.
Average Daily Rate (ADR) Trend by Month in Gondomar
Get Live Gondomar Market Intelligence 👇

Explore Real-time Analytics
Airbnb Seasonality Analysis & Trends in Gondomar (2025)
Peak Season (August, July, June)
- Revenue averages $3,897 per month
- Occupancy rates average 42.9%
- Daily rates average $238
Shoulder Season
- Revenue averages $1,385 per month
- Occupancy maintains around 22.6%
- Daily rates hold near $234
Low Season (January, February, November)
- Revenue drops to average $536 per month
- Occupancy decreases to average 13.1%
- Daily rates adjust to average $241
Seasonality Insights for Gondomar
- The Airbnb seasonality in Gondomar shows highly seasonal trends requiring careful strategy. While the sections above show seasonal averages, it's also insightful to look at the extremes:
- During the high season, the absolute peak month showcases Gondomar's highest earning potential, with monthly revenues capable of climbing to $5,129, occupancy reaching a high of 59.3%, and ADRs peaking at $250.
- Conversely, the slowest single month of the year, typically falling within the low season, marks the market's lowest point. In this month, revenue might dip to $344, occupancy could drop to 10.7%, and ADRs may adjust down to $232.
- Understanding both the seasonal averages and these monthly peaks and troughs in revenue, occupancy, and ADR is crucial for maximizing your Airbnb profit potential in Gondomar.
Seasonal Strategies for Maximizing Profit
- Peak Season: Maximize revenue through premium pricing and potentially longer minimum stays. Ensure high availability.
- Low Season: Offer competitive pricing, special promotions (e.g., extended stay discounts), and flexible cancellation policies. Target off-season travelers like remote workers or budget-conscious guests.
- Shoulder Seasons: Implement dynamic pricing that balances peak and low rates. Target weekend travelers or specific events. Offer slightly more flexible terms than peak season.
- Regularly analyze your own performance against these Gondomar seasonality benchmarks and adjust your pricing and availability strategy accordingly.
Best Areas for Airbnb Investment in Gondomar (2025)
Exploring the top neighborhoods for short-term rentals in Gondomar? This section highlights key areas, outlining why they are attractive for hosts and guests, along with notable local attractions. Consider these locations based on your target guest profile and investment strategy.
| Neighborhood / Area | Why Host Here? (Target Guests & Appeal) | Key Attractions & Landmarks |
|---|---|---|
| Val Miñor | A beautiful region nearby Gondomar known for its stunning beaches and scenic views. It's a popular destination for families and beach lovers looking for a relaxing getaway. | Playa de Patos, Playa de la Madorra, Pazo de Rubianes, Mirador de Monteferro, Marinas del Val Miñor |
| Chayán | A picturesque village in Gondomar that offers a serene atmosphere and beautiful landscapes. Ideal for travelers looking for a peaceful stay immersed in nature. | Barceló Montecastelo, Parque Natural de las Fragas do Eume, Senderismo en la naturaleza, Rutas a caballo |
| Gondomar town center | The town center offers a mix of culture and local charm, attracting visitors who want to explore the authentic Galician lifestyle and enjoy local cuisine. | Iglesia de San Benito, Mercado de Gondomar, Fiestas tradicionales, Río Miñor, Parque de A Pastora |
| Sampaio | A small village with access to essential amenities and local attractions. It offers a quieter environment while still providing connectivity to nearby city areas. | Ruinas de la Capilla de San Juan, Travesía de Sampaio, Senderos naturales, Playa del Monzo |
| Monteferro | This area offers hiking opportunities and seaside views, attracting outdoor enthusiasts and those looking to enjoy nature in tranquility. | Sendero de Monteferro, Vistas sobre la Ría de Vigo, Actividades de senderismo, Miradores naturales |
| Baiña | A charming village with local businesses and a close-knit community atmosphere. Perfect for cultural immersions and connecting with locals. | Iglesia de Santa María, Mercados locales, Festas populares, Caminos rurales |
| O Maratón | A vibrant area known for its cultural events and entertainment options. Attracts visitors looking for local festivities and lively experiences. | Festival del Maratón, Eventos culturales, Conciertos al aire libre, Gastronomía de la región |
| Areas de Recreo | These recreational areas provide space for families and travelers to relax and enjoy outdoor activities, making it ideal for Airbnb hosting. | Parques de ocio, Caminos para bicicletas, Actividades al aire libre, Espacios verdes para picnic |
Understanding Airbnb License Requirements & STR Laws in Gondomar (2025)
Yes, Gondomar, Galicia, Spain enforces high STR regulations. Obtaining a license and ensuring compliance is almost certainly required according to current 2025 STR laws. Always verify the latest short term rental regulations and Airbnb license requirements directly with local government authorities for Gondomar to ensure full compliance before hosting.
(Source: AirROI data, 2025, based on 33% licensed listings)
Top Performing Airbnb Properties in Gondomar (2025)
Benchmark your potential! Explore examples of top-performing Airbnb properties in Gondomarbased on Trailing Twelve Month (TTM) revenue. Analyze their characteristics, revenue, occupancy rate, and ADR to understand what drives success in this market.
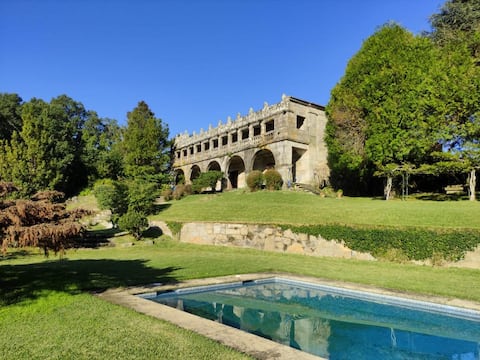
PAZO VILLARES ( GONDOMAR )
Entire Place • 7 bedrooms

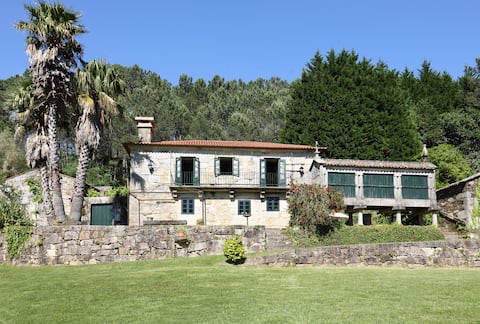
Villa Don
Entire Place • 7 bedrooms
Spectacular Casa del Cura de Oliveira
Entire Place • 4 bedrooms
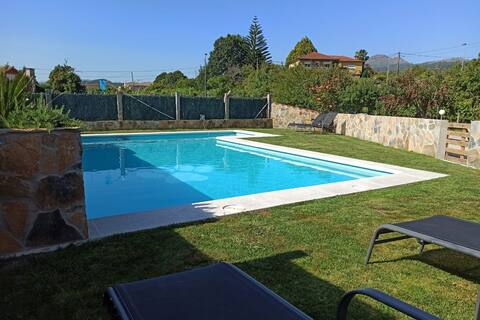
CHEERFUL HOUSE WITH POOL IN GONDOMAR(VAL MIÑOR)
Entire Place • 7 bedrooms

Spectacular Casona do Cereixo en Val Miñor
Entire Place • 5 bedrooms
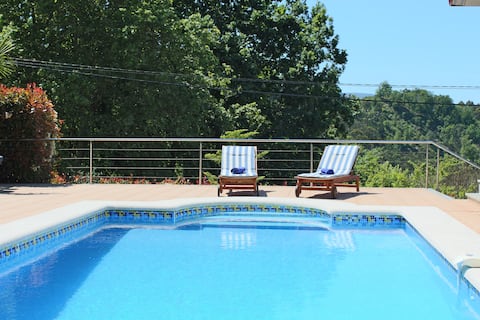
Exclusive house with pool in Gondomar
Entire Place • 4 bedrooms
Note: Performance varies based on location, size, amenities, seasonality, and management quality. Data reflects the past 12 months.
Top Performing Airbnb Hosts in Gondomar (2025)
Learn from the best! This table showcases top-performing Airbnb hosts in Gondomar based on the number of properties managed and estimated total revenue over the past year. Analyze their scale and performance metrics.
| Host Name | Properties | Grossing Revenue | Stay Reviews | Avg Rating |
|---|---|---|---|---|
| Sandra | 9 | $257,337 | 81 | 4.15/5.0 |
| Mariluz | 1 | $55,066 | 15 | 4.73/5.0 |
| Host #440409554 | 1 | $27,312 | 0 | 0.00/5.0 |
| Noelia | 1 | $21,611 | 74 | 4.93/5.0 |
| Host #60455346 | 1 | $20,436 | 0 | 0.00/5.0 |
| Host #3219304 | 1 | $18,849 | 18 | 4.89/5.0 |
| Gabriel | 1 | $17,277 | 10 | 5.00/5.0 |
| Beatriz | 1 | $16,458 | 11 | 4.82/5.0 |
| Host #83966822 | 1 | $15,713 | 0 | 0.00/5.0 |
| Host #268830917 | 2 | $15,475 | 0 | 0.00/5.0 |
Analyzing the strategies of top hosts, such as their property selection, pricing, and guest communication, can offer valuable lessons for optimizing your own Airbnb operations in Gondomar.
Dive Deeper: Advanced Gondomar STR Market Data (2025)
Ready to unlock more insights? AirROI provides access to advanced metrics and comprehensive Airbnb data for Gondomar. Explore detailed analytics beyond this report to refine your investment strategy, optimize pricing, and maximize your vacation rental profits.
Explore Advanced MetricsGondomar Short-Term Rental Market Composition (2025): Property & Room Types
Room Type Distribution
Property Type Distribution
Market Composition Insights for Gondomar
- The Gondomar Airbnb market composition is heavily skewed towards Entire Home/Apt listings, which make up 98.1% of the 52 active rentals. This indicates strong guest preference for privacy and space.
- Looking at the property type distribution in Gondomar, House properties are the most common (82.7%), reflecting the local real estate landscape.
- Houses represent a significant 82.7% portion, catering likely to families or larger groups.
- The presence of 5.8% Hotel/Boutique listings indicates integration with traditional hospitality.
- Smaller segments like outdoor/unique, others (combined 3.8%) offer potential for unique stay experiences.
Gondomar Airbnb Room Capacity Analysis (2025): Bedroom Distribution
Distribution of Listings by Number of Bedrooms
Room Capacity Insights for Gondomar
- The dominant room capacity in Gondomar is 3 bedrooms listings, making up 38.5% of the market. This suggests a strong demand for properties suitable for families or small groups.
- Together, 3 bedrooms and 5+ bedrooms properties represent 61.6% of the active Airbnb listings in Gondomar, indicating a high concentration in these sizes.
- A significant 73.1% of listings offer 3+ bedrooms, catering to larger groups and families seeking more space in Gondomar.
Gondomar Vacation Rental Guest Capacity Trends (2025)
Distribution of Listings by Guest Capacity
Guest Capacity Insights for Gondomar
- The most common guest capacity trend in Gondomar vacation rentals is listings accommodating 8+ guests (38.5%). This suggests the primary traveler segment is likely larger groups.
- Properties designed for 8+ guests and 6 guests dominate the Gondomar STR market, accounting for 65.4% of listings.
- 69.2% of properties accommodate 6+ guests, serving the market segment for larger families or group travel in Gondomar.
- On average, properties in Gondomar are equipped to host 6.1 guests.
Gondomar Airbnb Booking Patterns (2025): Available vs. Booked Days
Available Days Distribution
Booked Days Distribution
Booking Pattern Insights for Gondomar
- The most common availability pattern in Gondomar falls within the 271-366 days range, representing 86.5% of listings. This suggests many properties have significant open periods on their calendars.
- Approximately 98.0% of listings show high availability (181+ days open annually), indicating potential for increased bookings or specific owner usage patterns.
- For booked days, the 31-90 days range is most frequent in Gondomar (44.2%), reflecting common guest stay durations or potential owner blocking patterns.
- A notable 1.9% of properties secure long booking periods (181+ days booked per year), highlighting successful long-term rental strategies or significant owner usage.
Gondomar Airbnb Minimum Stay Requirements Analysis
Distribution of Listings by Minimum Night Requirement
1 Night
2 listings
4.4% of total
2 Nights
15 listings
33.3% of total
3 Nights
9 listings
20% of total
4-6 Nights
9 listings
20% of total
7-29 Nights
7 listings
15.6% of total
30+ Nights
3 listings
6.7% of total
Key Insights
- The most prevalent minimum stay requirement in Gondomar is 2 Nights, adopted by 33.3% of listings. This highlights the market's preference for shorter, flexible bookings.
Recommendations
- Align with the market by considering a 2 Nights minimum stay, as 33.3% of Gondomar hosts use this setting.
- If feasible, allowing 1-night stays, especially midweek or during low season, could capture last-minute bookings, as only 4.4% currently do.
- A 2-night minimum appears standard (33.3%). Consider this for weekends or peak periods.
- Explore offering discounts for stays of 30+ nights to attract the 6.7% of the market seeking extended stays.
- Adjust minimum nights based on seasonality – potentially shorter during low season and longer during peak demand periods in Gondomar.
Gondomar Airbnb Cancellation Policy Trends Analysis (2025)
Flexible
6 listings
15.8% of total
Moderate
9 listings
23.7% of total
Firm
16 listings
42.1% of total
Strict
7 listings
18.4% of total
Cancellation Policy Insights for Gondomar
- The prevailing Airbnb cancellation policy trend in Gondomar is Firm, used by 42.1% of listings.
- A majority (60.5%) of hosts in Gondomar utilize Firm or Strict policies, indicating a market where hosts prioritize booking security.
Recommendations for Hosts
- Consider adopting a Firm policy to align with the 42.1% market standard in Gondomar.
- Regularly review your cancellation policy against competitors and market demand shifts in Gondomar.
Gondomar STR Booking Lead Time Analysis (2025)
Average Booking Lead Time by Month
Booking Lead Time Insights for Gondomar
- The overall average booking lead time for vacation rentals in Gondomar is 60 days.
- Guests book furthest in advance for stays during August (average 96 days), likely coinciding with peak travel demand or local events.
- The shortest booking windows occur for stays in February (average 33 days), indicating more last-minute travel plans during this time.
- Seasonally, Fall (80 days avg.) sees the longest lead times, while Winter (53 days avg.) has the shortest, reflecting typical travel planning cycles.
Recommendations for Hosts
- Use the overall average lead time (60 days) as a baseline for your pricing and availability strategy in Gondomar.
- For August stays, consider implementing length-of-stay discounts or slightly higher rates for bookings made less than 96 days out to capitalize on advance planning.
- Target marketing efforts for the Fall season well in advance (at least 80 days) to capture early planners.
- Monitor your own booking lead times against these Gondomar averages to identify opportunities for dynamic pricing adjustments.
Popular & Essential Airbnb Amenities in Gondomar (2025)
Amenity Prevalence
Amenity Insights for Gondomar
- Essential amenities in Gondomar that guests expect include: Kitchen, Washer, TV, Essentials. Lacking these (any) could significantly impact bookings.
- Popular amenities like Hot water, Free parking on premises, Heating are common but not universal. Offering these can provide a competitive edge.
- Warning: Wifi is not universally provided but is considered essential globally. Ensure reliable Wifi is offered.
Recommendations for Hosts
- Ensure your listing includes all essential amenities for Gondomar: Kitchen, Washer, TV, Essentials.
- Prioritize adding missing essentials: TV, Essentials.
- Consider adding popular differentiators like Hot water or Free parking on premises to increase appeal.
- Highlight unique or less common amenities you offer (e.g., hot tub, dedicated workspace, EV charger) in your listing description and photos.
- Regularly check competitor amenities in Gondomar to stay competitive.
Gondomar Airbnb Guest Demographics & Profile Analysis (2025)
Guest Profile Summary for Gondomar
- The typical guest profile for Airbnb in Gondomar consists of a mix of domestic (64%) and international guests, often arriving from nearby Madrid, typically belonging to the Post-2000s (Gen Z/Alpha) group (50%), primarily speaking English or Spanish.
- Domestic travelers account for 64.0% of guests.
- Key international markets include Spain (64%) and United Kingdom (6.7%).
- Top languages spoken are English (37.3%) followed by Spanish (33.3%).
- A significant demographic segment is the Post-2000s (Gen Z/Alpha) group, representing 50% of guests.
Recommendations for Hosts
- Target domestic marketing efforts towards travelers from Madrid and Vigo.
- Tailor amenities and listing descriptions to appeal to the dominant Post-2000s (Gen Z/Alpha) demographic (e.g., highlight fast WiFi, smart home features, local guides).
- Highlight unique local experiences or amenities relevant to the primary guest profile.
- Consider seasonal promotions aligned with peak travel times for key origin markets.
Nearby Short-Term Rental Market Comparison
How does the Gondomar Airbnb market stack up against its neighbors? Compare key performance metrics like average monthly revenue, ADR, and occupancy rates in surrounding areas to understand the broader regional STR landscape.
| Market | Active Properties | Monthly Revenue | Daily Rate | Avg. Occupancy |
|---|---|---|---|---|
| Penhalonga e Paços de Gaiolo | 23 | $4,193 | $340.45 | 44% |
| Sande e São Lourenço do Douro | 15 | $2,998 | $311.12 | 39% |
| Armamar | 59 | $2,357 | $253.66 | 38% |
| Alijó | 64 | $2,217 | $264.67 | 32% |
| Cinfães | 17 | $1,948 | $252.01 | 32% |
| Mesão Frio | 53 | $1,907 | $195.39 | 46% |
| Porto | 7,887 | $1,900 | $128.19 | 53% |
| Outes | 31 | $1,837 | $223.97 | 38% |
| Anreade e São Romão de Arego | 14 | $1,836 | $184.41 | 39% |
| Vila Nova de Gaia | 1,097 | $1,836 | $138.57 | 52% |