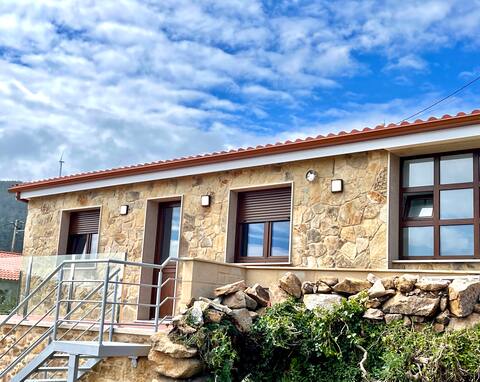
Dumbría Airbnb Market Analysis 2025: Short Term Rental Data & Vacation Rental Statistics in Galicia, Spain
Is Airbnb profitable in Dumbría in 2025? Explore comprehensive Airbnb analytics for Dumbría, Galicia, Spain to uncover income potential. This 2025 STR market report for Dumbría, based on AirROI data from April 2024 to March 2025, reveals key trends in the niche market of 35 active listings.
Whether you're considering an Airbnb investment in Dumbría, optimizing your existing vacation rental, or exploring rental arbitrage opportunities, understanding the Dumbría Airbnb data is crucial. Navigating the high regulation landscape is key to maximizing your short term rental income potential. Let's dive into the specifics.
Key Dumbría Airbnb Performance Metrics Overview
Monthly Airbnb Revenue Variations & Income Potential in Dumbría (2025)
Understanding the monthly revenue variations for Airbnb listings in Dumbría is key to maximizing your short term rental income potential. Seasonality significantly impacts earnings. Our analysis, based on data from the past 12 months, shows that the peak revenue month for STRs in Dumbría is typically August, while December often presents the lowest earnings, highlighting opportunities for strategic pricing adjustments during shoulder and low seasons. Explore the typical Airbnb income in Dumbría across different performance tiers:
- Best-in-class properties (Top 10%) achieve $2,547+ monthly, often utilizing dynamic pricing and superior guest experiences.
- Strong performing properties (Top 25%) earn $1,966 or more, indicating effective management and desirable locations/amenities.
- Typical properties (Median) generate around $959 per month, representing the average market performance.
- Entry-level properties (Bottom 25%) see earnings around $372, often with potential for optimization.
Average Monthly Airbnb Earnings Trend in Dumbría
Dumbría Airbnb Occupancy Rate Trends (2025)
Maximize your bookings by understanding the Dumbría STR occupancy trends. Seasonal demand shifts significantly influence how often properties are booked. Typically, Augustsees the highest demand (peak season occupancy), while April experiences the lowest (low season). Effective strategies, like adjusting minimum stays or offering promotions, can boost occupancy during slower periods. Here's how different property tiers perform in Dumbría:
- Best-in-class properties (Top 10%) achieve 51%+ occupancy, indicating high desirability and potentially optimized availability.
- Strong performing properties (Top 25%) maintain 41% or higher occupancy, suggesting good market fit and guest satisfaction.
- Typical properties (Median) have an occupancy rate around 27%.
- Entry-level properties (Bottom 25%) average 10% occupancy, potentially facing higher vacancy.
Average Monthly Occupancy Rate Trend in Dumbría
Average Daily Rate (ADR) Airbnb Trends in Dumbría (2025)
Effective short term rental pricing strategy in Dumbría involves understanding monthly ADR fluctuations. The Average Daily Rate (ADR) for Airbnb in Dumbría typically peaks in August and dips lowest during March. Leveraging Airbnb dynamic pricing tools or strategies based on this seasonality can significantly boost revenue. Here's a look at the typical nightly rates achieved:
- Best-in-class properties (Top 10%) command rates of $190+ per night, often due to premium features or locations.
- Strong performing properties (Top 25%) achieve nightly rates of $146 or more.
- Typical properties (Median) charge around $117 per night.
- Entry-level properties (Bottom 25%) earn around $85 per night.
Average Daily Rate (ADR) Trend by Month in Dumbría
Get Live Dumbría Market Intelligence 👇

Explore Real-time Analytics
Airbnb Seasonality Analysis & Trends in Dumbría (2025)
Peak Season (August, July, May)
- Revenue averages $2,043 per month
- Occupancy rates average 42.6%
- Daily rates average $140
Shoulder Season
- Revenue averages $1,037 per month
- Occupancy maintains around 22.7%
- Daily rates hold near $126
Low Season (January, October, December)
- Revenue drops to average $898 per month
- Occupancy decreases to average 22.0%
- Daily rates adjust to average $125
Seasonality Insights for Dumbría
- The Airbnb seasonality in Dumbría shows highly seasonal trends requiring careful strategy. While the sections above show seasonal averages, it's also insightful to look at the extremes:
- During the high season, the absolute peak month showcases Dumbría's highest earning potential, with monthly revenues capable of climbing to $2,705, occupancy reaching a high of 61.5%, and ADRs peaking at $142.
- Conversely, the slowest single month of the year, typically falling within the low season, marks the market's lowest point. In this month, revenue might dip to $822, occupancy could drop to 9.4%, and ADRs may adjust down to $117.
- Understanding both the seasonal averages and these monthly peaks and troughs in revenue, occupancy, and ADR is crucial for maximizing your Airbnb profit potential in Dumbría.
Seasonal Strategies for Maximizing Profit
- Peak Season: Maximize revenue through premium pricing and potentially longer minimum stays. Ensure high availability.
- Low Season: Offer competitive pricing, special promotions (e.g., extended stay discounts), and flexible cancellation policies. Target off-season travelers like remote workers or budget-conscious guests.
- Shoulder Seasons: Implement dynamic pricing that balances peak and low rates. Target weekend travelers or specific events. Offer slightly more flexible terms than peak season.
- Regularly analyze your own performance against these Dumbría seasonality benchmarks and adjust your pricing and availability strategy accordingly.
Best Areas for Airbnb Investment in Dumbría (2025)
Exploring the top neighborhoods for short-term rentals in Dumbría? This section highlights key areas, outlining why they are attractive for hosts and guests, along with notable local attractions. Consider these locations based on your target guest profile and investment strategy.
| Neighborhood / Area | Why Host Here? (Target Guests & Appeal) | Key Attractions & Landmarks |
|---|---|---|
| Cabo de Finisterre | Famous for its dramatic cliffs and as the westernmost point of mainland Spain, Cabo de Finisterre attracts tourists looking for natural beauty and historic significance. Ideal for outdoor enthusiasts and those interested in scenic views. | Cape Finisterre Lighthouse, Cabo da Roca, Hiking trails, Beautiful beaches |
| Muxía | Known for its picturesque coastal scenery and the sanctuary of Our Lady of the Boat. Muxía offers a tranquil atmosphere, perfect for visitors looking to explore Galicia's spirituality and natural beauty. | Santuario da Virxe da Barca, Beaches, Hiking routes, Local seafood restaurants |
| Carnota | Famous for its long beach and traditional hórreos (granaries), Carnota is a stunning coastal village that attracts both beachgoers and those interested in local culture and architecture. | Carnota Beach, Hórreos, Laguna de O Freixo, Local hiking paths |
| Dumbría | Located centrally in the Costa da Morte, Dumbría has easy access to various attractions and is a great base for exploring the region's natural landscapes and beaches. | Ponteceso Beach, Nearby hiking trails, Sierra de Outes |
| Laxe | A charming fishing village known for its beautiful beaches and cozy atmosphere. Laxe is a popular destination for families and offers a relaxed environment for vacationers. | Laxe Beach, Embarcadero, Cultural festivals, Restaurants |
| Fisterra | A small town that is a pilgrimage destination and has profound historical and cultural significance. Situated on the Atlantic coast, it attracts many tourists looking for history and beautiful landscapes. | Fisterra Lighthouse, Camino de Santiago trails, Beautiful coasts, Local seafood |
| Santisima Trinidad (Beach) | This area offers some of the most stunning beaches in Galicia, which appeals to both locals and tourists. The scenic beauty and peaceful atmosphere make it a desired location for beach lovers. | Beaches, Incredible sunsets, Coastal walks, Water sports |
| Malpica de Bergantiños | A quaint coastal town known for its fishing industry, Malpica offers beautiful landscapes and rich local culture. It is great for those wanting to immerse themselves in Galician traditions. | Malpica Beach, Harbor, Local restaurants, Cultural events |
Understanding Airbnb License Requirements & STR Laws in Dumbría (2025)
Yes, Dumbría, Galicia, Spain enforces high STR regulations. Obtaining a license and ensuring compliance is almost certainly required according to current 2025 STR laws. Always verify the latest short term rental regulations and Airbnb license requirements directly with local government authorities for Dumbría to ensure full compliance before hosting.
(Source: AirROI data, 2025, based on 51% licensed listings)
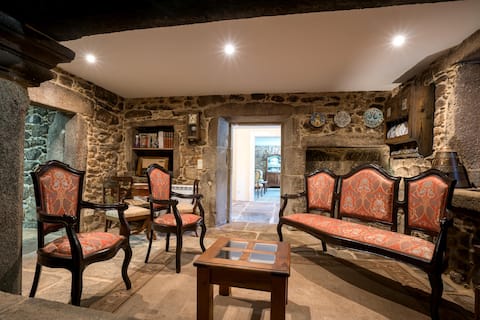
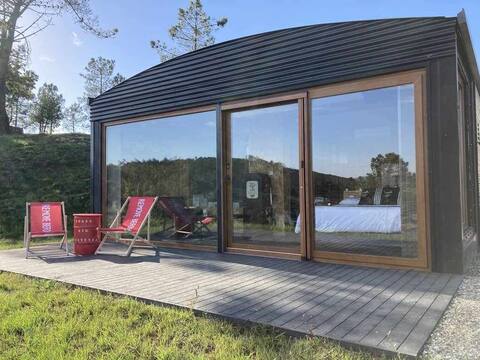
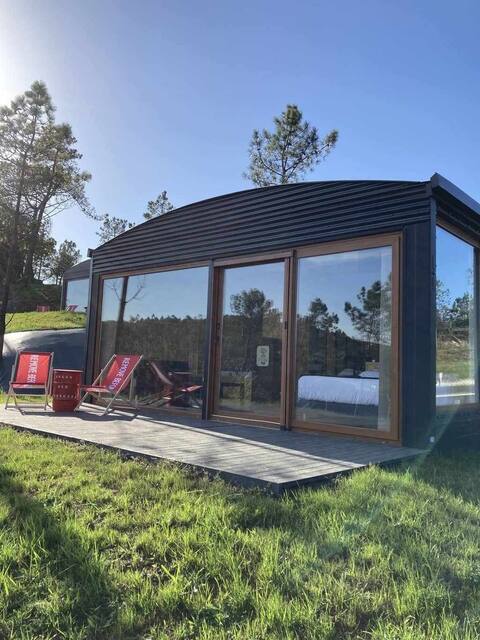
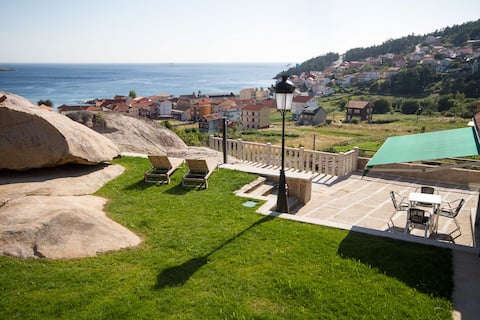
Top Performing Airbnb Properties in Dumbría (2025)
Benchmark your potential! Explore examples of top-performing Airbnb properties in Dumbríabased on Trailing Twelve Month (TTM) revenue. Analyze their characteristics, revenue, occupancy rate, and ADR to understand what drives success in this market.

November cabin - One (accessible)
Entire Place • 1 bedroom
Casa o Leiteiro. Costa da Morte (Dumbría)
Entire Place • 6 bedrooms
Whiskey Cabin - Four
Entire Place • 1 bedroom
Eco Cabin - Three
Entire Place • 1 bedroom
Soleiro Ezaro
Entire Place • 2 bedrooms
Solpor de Ézaro.
Entire Place • 2 bedrooms
Note: Performance varies based on location, size, amenities, seasonality, and management quality. Data reflects the past 12 months.
Top Performing Airbnb Hosts in Dumbría (2025)
Learn from the best! This table showcases top-performing Airbnb hosts in Dumbría based on the number of properties managed and estimated total revenue over the past year. Analyze their scale and performance metrics.
| Host Name | Properties | Grossing Revenue | Stay Reviews | Avg Rating |
|---|---|---|---|---|
| Jennifer | 4 | $86,027 | 33 | 3.72/5.0 |
| Victor Manuel | 8 | $73,161 | 155 | 3.54/5.0 |
| Elena | 1 | $29,274 | 21 | 4.90/5.0 |
| Maria | 2 | $25,029 | 62 | 4.76/5.0 |
| Juan J. | 5 | $15,970 | 18 | 3.92/5.0 |
| Ana Y Domingo | 3 | $15,222 | 135 | 4.84/5.0 |
| Stefanie | 1 | $15,195 | 10 | 4.80/5.0 |
| Manuel | 1 | $11,159 | 11 | 5.00/5.0 |
| Emilio José | 1 | $10,677 | 35 | 4.94/5.0 |
| Host #473104642 | 1 | $9,710 | 3 | 5.00/5.0 |
Analyzing the strategies of top hosts, such as their property selection, pricing, and guest communication, can offer valuable lessons for optimizing your own Airbnb operations in Dumbría.
Dive Deeper: Advanced Dumbría STR Market Data (2025)
Ready to unlock more insights? AirROI provides access to advanced metrics and comprehensive Airbnb data for Dumbría. Explore detailed analytics beyond this report to refine your investment strategy, optimize pricing, and maximize your vacation rental profits.
Explore Advanced MetricsDumbría Short-Term Rental Market Composition (2025): Property & Room Types
Room Type Distribution
Property Type Distribution
Market Composition Insights for Dumbría
- The Dumbría Airbnb market composition is heavily skewed towards Entire Home/Apt listings, which make up 88.6% of the 35 active rentals. This indicates strong guest preference for privacy and space.
- Looking at the property type distribution in Dumbría, House properties are the most common (48.6%), reflecting the local real estate landscape.
- Houses represent a significant 48.6% portion, catering likely to families or larger groups.
- The presence of 11.4% Hotel/Boutique listings indicates integration with traditional hospitality.
- Smaller segments like outdoor/unique (combined 2.9%) offer potential for unique stay experiences.
Dumbría Airbnb Room Capacity Analysis (2025): Bedroom Distribution
Distribution of Listings by Number of Bedrooms
Room Capacity Insights for Dumbría
- The dominant room capacity in Dumbría is 2 bedrooms listings, making up 45.7% of the market. This suggests a strong demand for properties suitable for couples or solo travelers.
- Together, 2 bedrooms and 1 bedroom properties represent 77.1% of the active Airbnb listings in Dumbría, indicating a high concentration in these sizes.
- A significant 22.9% of listings offer 3+ bedrooms, catering to larger groups and families seeking more space in Dumbría.
Dumbría Vacation Rental Guest Capacity Trends (2025)
Distribution of Listings by Guest Capacity
Guest Capacity Insights for Dumbría
- The most common guest capacity trend in Dumbría vacation rentals is listings accommodating 4 guests (31.4%). This suggests the primary traveler segment is likely small families or groups.
- Properties designed for 4 guests and 5 guests dominate the Dumbría STR market, accounting for 54.3% of listings.
- 20.1% of properties accommodate 6+ guests, serving the market segment for larger families or group travel in Dumbría.
- On average, properties in Dumbría are equipped to host 4.5 guests.
Dumbría Airbnb Booking Patterns (2025): Available vs. Booked Days
Available Days Distribution
Booked Days Distribution
Booking Pattern Insights for Dumbría
- The most common availability pattern in Dumbría falls within the 271-366 days range, representing 65.7% of listings. This suggests many properties have significant open periods on their calendars.
- Approximately 97.1% of listings show high availability (181+ days open annually), indicating potential for increased bookings or specific owner usage patterns.
- For booked days, the 31-90 days range is most frequent in Dumbría (37.1%), reflecting common guest stay durations or potential owner blocking patterns.
- A notable 2.9% of properties secure long booking periods (181+ days booked per year), highlighting successful long-term rental strategies or significant owner usage.
Dumbría Airbnb Minimum Stay Requirements Analysis
Distribution of Listings by Minimum Night Requirement
1 Night
12 listings
35.3% of total
2 Nights
8 listings
23.5% of total
3 Nights
2 listings
5.9% of total
4-6 Nights
3 listings
8.8% of total
7-29 Nights
7 listings
20.6% of total
30+ Nights
2 listings
5.9% of total
Key Insights
- The most prevalent minimum stay requirement in Dumbría is 1 Night, adopted by 35.3% of listings. This highlights the market's preference for shorter, flexible bookings.
Recommendations
- Align with the market by considering a 1 Night minimum stay, as 35.3% of Dumbría hosts use this setting.
- Explore offering discounts for stays of 30+ nights to attract the 5.9% of the market seeking extended stays.
- Adjust minimum nights based on seasonality – potentially shorter during low season and longer during peak demand periods in Dumbría.
Dumbría Airbnb Cancellation Policy Trends Analysis (2025)
Flexible
2 listings
7.4% of total
Moderate
4 listings
14.8% of total
Firm
5 listings
18.5% of total
Strict
16 listings
59.3% of total
Cancellation Policy Insights for Dumbría
- The prevailing Airbnb cancellation policy trend in Dumbría is Strict, used by 59.3% of listings.
- A majority (77.8%) of hosts in Dumbría utilize Firm or Strict policies, indicating a market where hosts prioritize booking security.
Recommendations for Hosts
- Consider adopting a Strict policy to align with the 59.3% market standard in Dumbría.
- With 59.3% using Strict terms, this is a viable option in Dumbría, particularly for high-value properties or during peak demand periods.
- Regularly review your cancellation policy against competitors and market demand shifts in Dumbría.
Dumbría STR Booking Lead Time Analysis (2025)
Average Booking Lead Time by Month
Booking Lead Time Insights for Dumbría
- The overall average booking lead time for vacation rentals in Dumbría is 46 days.
- Guests book furthest in advance for stays during July (average 84 days), likely coinciding with peak travel demand or local events.
- The shortest booking windows occur for stays in March (average 16 days), indicating more last-minute travel plans during this time.
- Seasonally, Summer (69 days avg.) sees the longest lead times, while Spring (32 days avg.) has the shortest, reflecting typical travel planning cycles.
Recommendations for Hosts
- Use the overall average lead time (46 days) as a baseline for your pricing and availability strategy in Dumbría.
- For July stays, consider implementing length-of-stay discounts or slightly higher rates for bookings made less than 84 days out to capitalize on advance planning.
- Target marketing efforts for the Summer season well in advance (at least 69 days) to capture early planners.
- Monitor your own booking lead times against these Dumbría averages to identify opportunities for dynamic pricing adjustments.
Popular & Essential Airbnb Amenities in Dumbría (2025)
Amenity Prevalence
Amenity Insights for Dumbría
- Popular amenities like TV, Hangers, Essentials are common but not universal. Offering these can provide a competitive edge.
- Warning: Wifi is not universally provided but is considered essential globally. Ensure reliable Wifi is offered.
Recommendations for Hosts
- Consider adding popular differentiators like TV or Hangers to increase appeal.
- Highlight unique or less common amenities you offer (e.g., hot tub, dedicated workspace, EV charger) in your listing description and photos.
- Regularly check competitor amenities in Dumbría to stay competitive.
Dumbría Airbnb Guest Demographics & Profile Analysis (2025)
Guest Profile Summary for Dumbría
- The typical guest profile for Airbnb in Dumbría consists of a mix of domestic (58%) and international guests, often arriving from nearby Madrid, typically belonging to the Post-2000s (Gen Z/Alpha) group (50%), primarily speaking Spanish or English.
- Domestic travelers account for 57.6% of guests.
- Key international markets include Spain (57.6%) and France (14.1%).
- Top languages spoken are Spanish (37%) followed by English (30.4%).
- A significant demographic segment is the Post-2000s (Gen Z/Alpha) group, representing 50% of guests.
Recommendations for Hosts
- Balance marketing efforts between domestic and international channels based on the guest mix.
- Tailor amenities and listing descriptions to appeal to the dominant Post-2000s (Gen Z/Alpha) demographic (e.g., highlight fast WiFi, smart home features, local guides).
- Highlight unique local experiences or amenities relevant to the primary guest profile.
- Consider seasonal promotions aligned with peak travel times for key origin markets.
Nearby Short-Term Rental Market Comparison
How does the Dumbría Airbnb market stack up against its neighbors? Compare key performance metrics like average monthly revenue, ADR, and occupancy rates in surrounding areas to understand the broader regional STR landscape.
| Market | Active Properties | Monthly Revenue | Daily Rate | Avg. Occupancy |
|---|---|---|---|---|
| Penhalonga e Paços de Gaiolo | 23 | $4,193 | $340.45 | 44% |
| Sande e São Lourenço do Douro | 15 | $2,998 | $311.12 | 39% |
| Cinfães | 17 | $1,948 | $252.01 | 32% |
| Porto | 7,887 | $1,900 | $128.19 | 53% |
| Outes | 31 | $1,837 | $223.97 | 38% |
| Vila Nova de Gaia | 1,097 | $1,836 | $138.57 | 52% |
| Valongo | 20 | $1,815 | $122.68 | 47% |
| Paredes | 43 | $1,806 | $152.44 | 41% |
| Cidade da Maia | 19 | $1,787 | $149.80 | 47% |
| Felgueiras | 22 | $1,780 | $222.13 | 37% |