Cambados Airbnb Market Analysis 2025: Short Term Rental Data & Vacation Rental Statistics in Galicia, Spain
Is Airbnb profitable in Cambados in 2025? Explore comprehensive Airbnb analytics for Cambados, Galicia, Spain to uncover income potential. This 2025 STR market report for Cambados, based on AirROI data from April 2024 to March 2025, reveals key trends in the niche market of 110 active listings.
Whether you're considering an Airbnb investment in Cambados, optimizing your existing vacation rental, or exploring rental arbitrage opportunities, understanding the Cambados Airbnb data is crucial. Understanding the local regulations is key to maximizing your short term rental income potential. Let's dive into the specifics.
Key Cambados Airbnb Performance Metrics Overview
Monthly Airbnb Revenue Variations & Income Potential in Cambados (2025)
Understanding the monthly revenue variations for Airbnb listings in Cambados is key to maximizing your short term rental income potential. Seasonality significantly impacts earnings. Our analysis, based on data from the past 12 months, shows that the peak revenue month for STRs in Cambados is typically August, while February often presents the lowest earnings, highlighting opportunities for strategic pricing adjustments during shoulder and low seasons. Explore the typical Airbnb income in Cambados across different performance tiers:
- Best-in-class properties (Top 10%) achieve $3,150+ monthly, often utilizing dynamic pricing and superior guest experiences.
- Strong performing properties (Top 25%) earn $2,059 or more, indicating effective management and desirable locations/amenities.
- Typical properties (Median) generate around $995 per month, representing the average market performance.
- Entry-level properties (Bottom 25%) see earnings around $383, often with potential for optimization.
Average Monthly Airbnb Earnings Trend in Cambados
Cambados Airbnb Occupancy Rate Trends (2025)
Maximize your bookings by understanding the Cambados STR occupancy trends. Seasonal demand shifts significantly influence how often properties are booked. Typically, Augustsees the highest demand (peak season occupancy), while February experiences the lowest (low season). Effective strategies, like adjusting minimum stays or offering promotions, can boost occupancy during slower periods. Here's how different property tiers perform in Cambados:
- Best-in-class properties (Top 10%) achieve 55%+ occupancy, indicating high desirability and potentially optimized availability.
- Strong performing properties (Top 25%) maintain 40% or higher occupancy, suggesting good market fit and guest satisfaction.
- Typical properties (Median) have an occupancy rate around 23%.
- Entry-level properties (Bottom 25%) average 9% occupancy, potentially facing higher vacancy.
Average Monthly Occupancy Rate Trend in Cambados
Average Daily Rate (ADR) Airbnb Trends in Cambados (2025)
Effective short term rental pricing strategy in Cambados involves understanding monthly ADR fluctuations. The Average Daily Rate (ADR) for Airbnb in Cambados typically peaks in August and dips lowest during November. Leveraging Airbnb dynamic pricing tools or strategies based on this seasonality can significantly boost revenue. Here's a look at the typical nightly rates achieved:
- Best-in-class properties (Top 10%) command rates of $238+ per night, often due to premium features or locations.
- Strong performing properties (Top 25%) achieve nightly rates of $167 or more.
- Typical properties (Median) charge around $133 per night.
- Entry-level properties (Bottom 25%) earn around $107 per night.
Average Daily Rate (ADR) Trend by Month in Cambados
Get Live Cambados Market Intelligence 👇

Explore Real-time Analytics
Airbnb Seasonality Analysis & Trends in Cambados (2025)
Peak Season (August, July, April)
- Revenue averages $2,353 per month
- Occupancy rates average 40.7%
- Daily rates average $169
Shoulder Season
- Revenue averages $1,357 per month
- Occupancy maintains around 24.5%
- Daily rates hold near $160
Low Season (January, February, March)
- Revenue drops to average $805 per month
- Occupancy decreases to average 18.2%
- Daily rates adjust to average $152
Seasonality Insights for Cambados
- The Airbnb seasonality in Cambados shows highly seasonal trends requiring careful strategy. While the sections above show seasonal averages, it's also insightful to look at the extremes:
- During the high season, the absolute peak month showcases Cambados's highest earning potential, with monthly revenues capable of climbing to $3,108, occupancy reaching a high of 55.5%, and ADRs peaking at $174.
- Conversely, the slowest single month of the year, typically falling within the low season, marks the market's lowest point. In this month, revenue might dip to $676, occupancy could drop to 15.0%, and ADRs may adjust down to $149.
- Understanding both the seasonal averages and these monthly peaks and troughs in revenue, occupancy, and ADR is crucial for maximizing your Airbnb profit potential in Cambados.
Seasonal Strategies for Maximizing Profit
- Peak Season: Maximize revenue through premium pricing and potentially longer minimum stays. Ensure high availability.
- Low Season: Offer competitive pricing, special promotions (e.g., extended stay discounts), and flexible cancellation policies. Target off-season travelers like remote workers or budget-conscious guests.
- Shoulder Seasons: Implement dynamic pricing that balances peak and low rates. Target weekend travelers or specific events. Offer slightly more flexible terms than peak season.
- Regularly analyze your own performance against these Cambados seasonality benchmarks and adjust your pricing and availability strategy accordingly.
Best Areas for Airbnb Investment in Cambados (2025)
Exploring the top neighborhoods for short-term rentals in Cambados? This section highlights key areas, outlining why they are attractive for hosts and guests, along with notable local attractions. Consider these locations based on your target guest profile and investment strategy.
| Neighborhood / Area | Why Host Here? (Target Guests & Appeal) | Key Attractions & Landmarks |
|---|---|---|
| Centro Histórico | The historic center of Cambados is full of charm, with traditional Galician architecture, cobbled streets, and a rich cultural heritage. It's a prime spot for tourists wanting to experience the essence of the town. | Iglesia de San Bieito, Pazo de Fefiñáns, Marina de Cambados, Museo Etnográfico, Festa do Albariño, Calle de Valle Inclán |
| Rúa do Mercado | Known for its local markets and vibrant local culture, Rúa do Mercado offers visitors a taste of everyday life in Cambados while being close to shopping and dining options. | Mercado de Cambados, Gastronomic experiences, Local Tapas bars, Artisan shops, Craft fairs, Cultural events |
| Castillo de A Lanzada | This castle area offers stunning views of the coastline and is a popular spot for beachgoers. Hosting here attracts visitors interested in beach activities and historical sites. | Castillo de A Lanzada, Beach access, Surfing, Sunbathing spots, Nature trails, Hiking opportunities |
| Playa de Vilagarcia | A short distance from Cambados, this beach is popular among families and young people, providing a lively atmosphere during the summer with various water activities. | Vilagarcia beach, Water sports, Beach volleyball courts, Restaurants sea view, Parks nearby, Summer events |
| Sanxenxo | Located nearby, Sanxenxo is known for its vibrant nightlife and beautiful beaches. This area is suitable for attracting tourists looking for entertainment and relaxation. | Silgar Beach, Night clubs, Shopping streets, Marinas, Water sports, Dining options |
| Islas Cíes | Famous for its natural beauty and protected national park status, this area is appealing for nature lovers and those wanting to experience pristine beaches and hiking. | Cíes Islands National Park, Beaches, Hiking trails, Birdwatching, Scenic views, Camping |
| Pazo de Rubianes | This historical country house offers a unique experience for visitors who want to explore rural Galicia and enjoy wine tourism and nature. | Pazo de Rubianes, Wine tours, Gardens, Culinary experiences, Cultural events, Traditional festivals |
| Barraña de Santo Tomé | A serene beach spot that's perfect for relaxation and family outings, making it attractive for tourists looking for quieter accommodations near Cambados. | Barraña beach, Picnic areas, Walking trails, Seaside restaurants, Family-friendly activities, Fishing spots |
Understanding Airbnb License Requirements & STR Laws in Cambados (2025)
With 28% of listings showing registration in 2025, understanding potential Airbnb license requirements is crucial in Cambados. Always verify the latest short term rental regulations and Airbnb license requirements directly with local government authorities for Cambados to ensure full compliance before hosting.
(Source: AirROI data, 2025, based on 28% licensed listings)
Top Performing Airbnb Properties in Cambados (2025)
Benchmark your potential! Explore examples of top-performing Airbnb properties in Cambadosbased on Trailing Twelve Month (TTM) revenue. Analyze their characteristics, revenue, occupancy rate, and ADR to understand what drives success in this market.
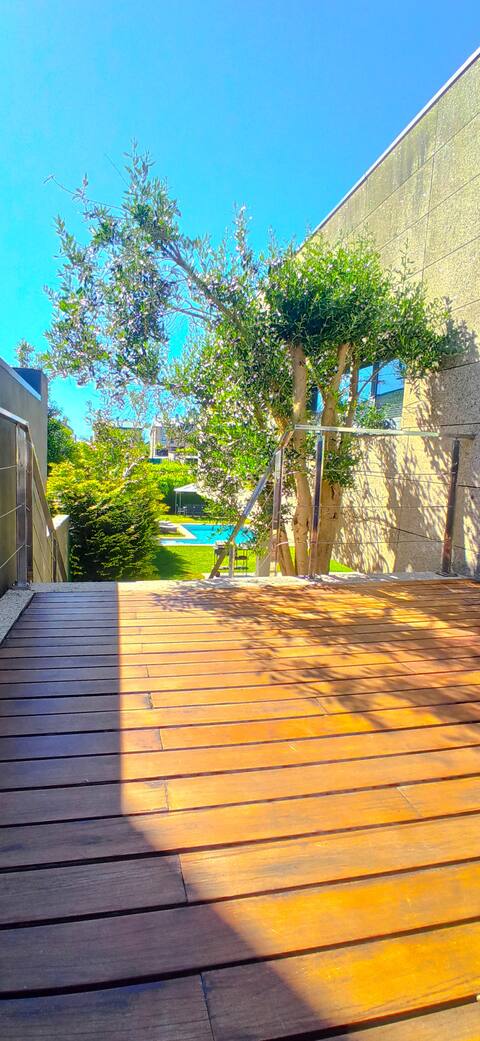
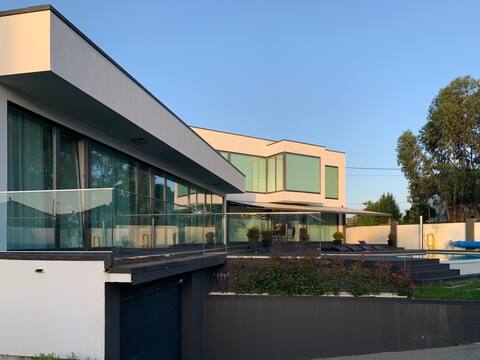
Casa moderna en el corazón de las Rías Baixas
Entire Place • 3 bedrooms
Casa Esclavi - Cambados
Entire Place • 4 bedrooms
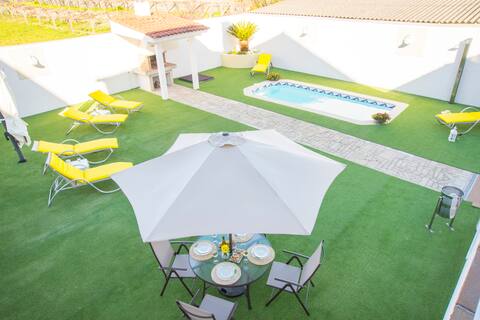
LAS PALMERAS, villa with pool and barbecue
Entire Place • 6 bedrooms
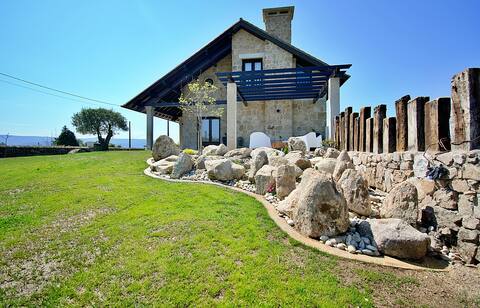
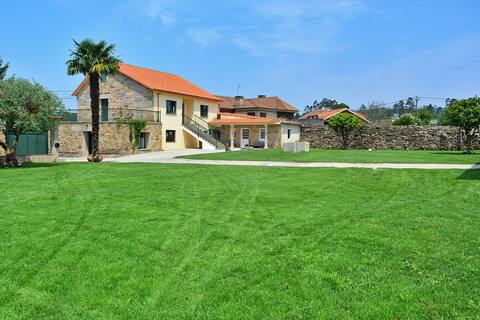
House in Cambados with gated garden.
Entire Place • 4 bedrooms
Pomba House
Entire Place • 4 bedrooms
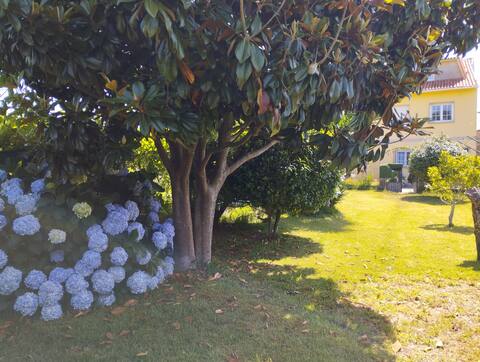
House with huge garden and barbecue in Cambados
Entire Place • 5 bedrooms
Note: Performance varies based on location, size, amenities, seasonality, and management quality. Data reflects the past 12 months.
Top Performing Airbnb Hosts in Cambados (2025)
Learn from the best! This table showcases top-performing Airbnb hosts in Cambados based on the number of properties managed and estimated total revenue over the past year. Analyze their scale and performance metrics.
| Host Name | Properties | Grossing Revenue | Stay Reviews | Avg Rating |
|---|---|---|---|---|
| Galihost | 12 | $145,515 | 63 | 2.47/5.0 |
| Host #541104802 | 1 | $49,082 | 0 | 0.00/5.0 |
| Paris | 1 | $42,507 | 18 | 5.00/5.0 |
| Erundina | 3 | $35,131 | 141 | 4.98/5.0 |
| Sonia | 1 | $29,621 | 6 | 4.83/5.0 |
| Montse | 1 | $29,546 | 7 | 4.57/5.0 |
| Celia | 1 | $28,650 | 18 | 5.00/5.0 |
| Verónica | 1 | $24,736 | 9 | 5.00/5.0 |
| Host #494470014 | 1 | $23,711 | 1 | 0.00/5.0 |
| Francis | 1 | $23,033 | 9 | 4.44/5.0 |
Analyzing the strategies of top hosts, such as their property selection, pricing, and guest communication, can offer valuable lessons for optimizing your own Airbnb operations in Cambados.
Dive Deeper: Advanced Cambados STR Market Data (2025)
Ready to unlock more insights? AirROI provides access to advanced metrics and comprehensive Airbnb data for Cambados. Explore detailed analytics beyond this report to refine your investment strategy, optimize pricing, and maximize your vacation rental profits.
Explore Advanced MetricsCambados Short-Term Rental Market Composition (2025): Property & Room Types
Room Type Distribution
Property Type Distribution
Market Composition Insights for Cambados
- The Cambados Airbnb market composition is heavily skewed towards Entire Home/Apt listings, which make up 98.2% of the 110 active rentals. This indicates strong guest preference for privacy and space.
- Looking at the property type distribution in Cambados, Apartment/Condo properties are the most common (66.4%), reflecting the local real estate landscape.
- Houses represent a significant 31.8% portion, catering likely to families or larger groups.
- Smaller segments like others, hotel/boutique (combined 1.8%) offer potential for unique stay experiences.
Cambados Airbnb Room Capacity Analysis (2025): Bedroom Distribution
Distribution of Listings by Number of Bedrooms
Room Capacity Insights for Cambados
- The dominant room capacity in Cambados is 3 bedrooms listings, making up 35.5% of the market. This suggests a strong demand for properties suitable for families or small groups.
- Together, 3 bedrooms and 2 bedrooms properties represent 66.4% of the active Airbnb listings in Cambados, indicating a high concentration in these sizes.
- A significant 51.0% of listings offer 3+ bedrooms, catering to larger groups and families seeking more space in Cambados.
Cambados Vacation Rental Guest Capacity Trends (2025)
Distribution of Listings by Guest Capacity
Guest Capacity Insights for Cambados
- The most common guest capacity trend in Cambados vacation rentals is listings accommodating 4 guests (37.3%). This suggests the primary traveler segment is likely small families or groups.
- Properties designed for 4 guests and 6 guests dominate the Cambados STR market, accounting for 62.8% of listings.
- 44.6% of properties accommodate 6+ guests, serving the market segment for larger families or group travel in Cambados.
- On average, properties in Cambados are equipped to host 5.2 guests.
Cambados Airbnb Booking Patterns (2025): Available vs. Booked Days
Available Days Distribution
Booked Days Distribution
Booking Pattern Insights for Cambados
- The most common availability pattern in Cambados falls within the 271-366 days range, representing 79.1% of listings. This suggests many properties have significant open periods on their calendars.
- Approximately 97.3% of listings show high availability (181+ days open annually), indicating potential for increased bookings or specific owner usage patterns.
- For booked days, the 31-90 days range is most frequent in Cambados (51.8%), reflecting common guest stay durations or potential owner blocking patterns.
- A notable 3.6% of properties secure long booking periods (181+ days booked per year), highlighting successful long-term rental strategies or significant owner usage.
Cambados Airbnb Minimum Stay Requirements Analysis
Distribution of Listings by Minimum Night Requirement
1 Night
15 listings
14.4% of total
2 Nights
33 listings
31.7% of total
3 Nights
18 listings
17.3% of total
4-6 Nights
27 listings
26% of total
7-29 Nights
2 listings
1.9% of total
30+ Nights
9 listings
8.7% of total
Key Insights
- The most prevalent minimum stay requirement in Cambados is 2 Nights, adopted by 31.7% of listings. This highlights the market's preference for shorter, flexible bookings.
Recommendations
- Align with the market by considering a 2 Nights minimum stay, as 31.7% of Cambados hosts use this setting.
- If feasible, allowing 1-night stays, especially midweek or during low season, could capture last-minute bookings, as only 14.4% currently do.
- A 2-night minimum appears standard (31.7%). Consider this for weekends or peak periods.
- Explore offering discounts for stays of 30+ nights to attract the 8.7% of the market seeking extended stays.
- Adjust minimum nights based on seasonality – potentially shorter during low season and longer during peak demand periods in Cambados.
Cambados Airbnb Cancellation Policy Trends Analysis (2025)
Super Strict 60 Days
1 listings
1.2% of total
Super Strict 30 Days
1 listings
1.2% of total
Flexible
13 listings
15.9% of total
Moderate
26 listings
31.7% of total
Firm
25 listings
30.5% of total
Strict
16 listings
19.5% of total
Cancellation Policy Insights for Cambados
- The prevailing Airbnb cancellation policy trend in Cambados is Moderate, used by 31.7% of listings.
- There's a relatively balanced mix between guest-friendly (47.6%) and stricter (50.0%) policies, offering choices for different guest needs.
Recommendations for Hosts
- Consider adopting a Moderate policy to align with the 31.7% market standard in Cambados.
- Regularly review your cancellation policy against competitors and market demand shifts in Cambados.
Cambados STR Booking Lead Time Analysis (2025)
Average Booking Lead Time by Month
Booking Lead Time Insights for Cambados
- The overall average booking lead time for vacation rentals in Cambados is 54 days.
- Guests book furthest in advance for stays during July (average 98 days), likely coinciding with peak travel demand or local events.
- The shortest booking windows occur for stays in March (average 19 days), indicating more last-minute travel plans during this time.
- Seasonally, Summer (93 days avg.) sees the longest lead times, while Spring (32 days avg.) has the shortest, reflecting typical travel planning cycles.
Recommendations for Hosts
- Use the overall average lead time (54 days) as a baseline for your pricing and availability strategy in Cambados.
- For July stays, consider implementing length-of-stay discounts or slightly higher rates for bookings made less than 98 days out to capitalize on advance planning.
- Target marketing efforts for the Summer season well in advance (at least 93 days) to capture early planners.
- Monitor your own booking lead times against these Cambados averages to identify opportunities for dynamic pricing adjustments.
Popular & Essential Airbnb Amenities in Cambados (2025)
Amenity Prevalence
Amenity Insights for Cambados
- Essential amenities in Cambados that guests expect include: TV, Kitchen, Washer. Lacking these (any) could significantly impact bookings.
- Popular amenities like Hot water, Essentials, Refrigerator are common but not universal. Offering these can provide a competitive edge.
Recommendations for Hosts
- Ensure your listing includes all essential amenities for Cambados: TV, Kitchen, Washer.
- Prioritize adding missing essentials: Kitchen, Washer.
- Consider adding popular differentiators like Hot water or Essentials to increase appeal.
- Highlight unique or less common amenities you offer (e.g., hot tub, dedicated workspace, EV charger) in your listing description and photos.
- Regularly check competitor amenities in Cambados to stay competitive.
Cambados Airbnb Guest Demographics & Profile Analysis (2025)
Guest Profile Summary for Cambados
- The typical guest profile for Airbnb in Cambados consists of primarily domestic travelers (71%), often arriving from nearby Madrid, typically belonging to the Post-2000s (Gen Z/Alpha) group (50%), primarily speaking Spanish or English.
- Domestic travelers account for 71.0% of guests.
- Key international markets include Spain (71%) and United Kingdom (6.9%).
- Top languages spoken are Spanish (41.9%) followed by English (34.9%).
- A significant demographic segment is the Post-2000s (Gen Z/Alpha) group, representing 50% of guests.
Recommendations for Hosts
- Target domestic marketing efforts towards travelers from Madrid and A Coruña.
- Tailor amenities and listing descriptions to appeal to the dominant Post-2000s (Gen Z/Alpha) demographic (e.g., highlight fast WiFi, smart home features, local guides).
- Highlight unique local experiences or amenities relevant to the primary guest profile.
- Consider seasonal promotions aligned with peak travel times for key origin markets.
Nearby Short-Term Rental Market Comparison
How does the Cambados Airbnb market stack up against its neighbors? Compare key performance metrics like average monthly revenue, ADR, and occupancy rates in surrounding areas to understand the broader regional STR landscape.
| Market | Active Properties | Monthly Revenue | Daily Rate | Avg. Occupancy |
|---|---|---|---|---|
| Penhalonga e Paços de Gaiolo | 23 | $4,193 | $340.45 | 44% |
| Sande e São Lourenço do Douro | 15 | $2,998 | $311.12 | 39% |
| Armamar | 59 | $2,357 | $253.66 | 38% |
| Alijó | 64 | $2,217 | $264.67 | 32% |
| Cinfães | 17 | $1,948 | $252.01 | 32% |
| Mesão Frio | 53 | $1,907 | $195.39 | 46% |
| Porto | 7,887 | $1,900 | $128.19 | 53% |
| Outes | 31 | $1,837 | $223.97 | 38% |
| Anreade e São Romão de Arego | 14 | $1,836 | $184.41 | 39% |
| Vila Nova de Gaia | 1,097 | $1,836 | $138.57 | 52% |