Ares Airbnb Market Analysis 2025: Short Term Rental Data & Vacation Rental Statistics in Galicia, Spain
Is Airbnb profitable in Ares in 2025? Explore comprehensive Airbnb analytics for Ares, Galicia, Spain to uncover income potential. This 2025 STR market report for Ares, based on AirROI data from April 2024 to March 2025, reveals key trends in the niche market of 58 active listings.
Whether you're considering an Airbnb investment in Ares, optimizing your existing vacation rental, or exploring rental arbitrage opportunities, understanding the Ares Airbnb data is crucial. Understanding the local regulations is key to maximizing your short term rental income potential. Let's dive into the specifics.
Key Ares Airbnb Performance Metrics Overview
Monthly Airbnb Revenue Variations & Income Potential in Ares (2025)
Understanding the monthly revenue variations for Airbnb listings in Ares is key to maximizing your short term rental income potential. Seasonality significantly impacts earnings. Our analysis, based on data from the past 12 months, shows that the peak revenue month for STRs in Ares is typically August, while February often presents the lowest earnings, highlighting opportunities for strategic pricing adjustments during shoulder and low seasons. Explore the typical Airbnb income in Ares across different performance tiers:
- Best-in-class properties (Top 10%) achieve $2,210+ monthly, often utilizing dynamic pricing and superior guest experiences.
- Strong performing properties (Top 25%) earn $1,591 or more, indicating effective management and desirable locations/amenities.
- Typical properties (Median) generate around $1,043 per month, representing the average market performance.
- Entry-level properties (Bottom 25%) see earnings around $594, often with potential for optimization.
Average Monthly Airbnb Earnings Trend in Ares
Ares Airbnb Occupancy Rate Trends (2025)
Maximize your bookings by understanding the Ares STR occupancy trends. Seasonal demand shifts significantly influence how often properties are booked. Typically, Augustsees the highest demand (peak season occupancy), while February experiences the lowest (low season). Effective strategies, like adjusting minimum stays or offering promotions, can boost occupancy during slower periods. Here's how different property tiers perform in Ares:
- Best-in-class properties (Top 10%) achieve 59%+ occupancy, indicating high desirability and potentially optimized availability.
- Strong performing properties (Top 25%) maintain 47% or higher occupancy, suggesting good market fit and guest satisfaction.
- Typical properties (Median) have an occupancy rate around 30%.
- Entry-level properties (Bottom 25%) average 19% occupancy, potentially facing higher vacancy.
Average Monthly Occupancy Rate Trend in Ares
Average Daily Rate (ADR) Airbnb Trends in Ares (2025)
Effective short term rental pricing strategy in Ares involves understanding monthly ADR fluctuations. The Average Daily Rate (ADR) for Airbnb in Ares typically peaks in August and dips lowest during February. Leveraging Airbnb dynamic pricing tools or strategies based on this seasonality can significantly boost revenue. Here's a look at the typical nightly rates achieved:
- Best-in-class properties (Top 10%) command rates of $190+ per night, often due to premium features or locations.
- Strong performing properties (Top 25%) achieve nightly rates of $123 or more.
- Typical properties (Median) charge around $91 per night.
- Entry-level properties (Bottom 25%) earn around $72 per night.
Average Daily Rate (ADR) Trend by Month in Ares
Get Live Ares Market Intelligence 👇

Explore Real-time Analytics
Airbnb Seasonality Analysis & Trends in Ares (2025)
Peak Season (August, July, June)
- Revenue averages $2,294 per month
- Occupancy rates average 57.7%
- Daily rates average $124
Shoulder Season
- Revenue averages $1,036 per month
- Occupancy maintains around 29.1%
- Daily rates hold near $113
Low Season (January, February, March)
- Revenue drops to average $464 per month
- Occupancy decreases to average 17.5%
- Daily rates adjust to average $100
Seasonality Insights for Ares
- The Airbnb seasonality in Ares shows highly seasonal trends requiring careful strategy. While the sections above show seasonal averages, it's also insightful to look at the extremes:
- During the high season, the absolute peak month showcases Ares's highest earning potential, with monthly revenues capable of climbing to $2,896, occupancy reaching a high of 77.0%, and ADRs peaking at $125.
- Conversely, the slowest single month of the year, typically falling within the low season, marks the market's lowest point. In this month, revenue might dip to $352, occupancy could drop to 15.0%, and ADRs may adjust down to $99.
- Understanding both the seasonal averages and these monthly peaks and troughs in revenue, occupancy, and ADR is crucial for maximizing your Airbnb profit potential in Ares.
Seasonal Strategies for Maximizing Profit
- Peak Season: Maximize revenue through premium pricing and potentially longer minimum stays. Ensure high availability.
- Low Season: Offer competitive pricing, special promotions (e.g., extended stay discounts), and flexible cancellation policies. Target off-season travelers like remote workers or budget-conscious guests.
- Shoulder Seasons: Implement dynamic pricing that balances peak and low rates. Target weekend travelers or specific events. Offer slightly more flexible terms than peak season.
- Regularly analyze your own performance against these Ares seasonality benchmarks and adjust your pricing and availability strategy accordingly.
Best Areas for Airbnb Investment in Ares (2025)
Exploring the top neighborhoods for short-term rentals in Ares? This section highlights key areas, outlining why they are attractive for hosts and guests, along with notable local attractions. Consider these locations based on your target guest profile and investment strategy.
| Neighborhood / Area | Why Host Here? (Target Guests & Appeal) | Key Attractions & Landmarks |
|---|---|---|
| Ares Beach | Beautiful coastal area with sandy beaches, popular for family vacations and water sports. Excellent for attracting both local and international tourists looking for a beach getaway. | Praia de Ares, Paseo Marítimo, Marismas de Ares, Batería de Campolongo, Praia de Chanteiro |
| Historical Center of Ares | Charming town center with narrow streets, traditional Galician architecture and local shops. Ideal for those seeking a cultural experience and local gastronomy. | Iglesia de Santa María, Conjunto histórico de Ares, Plaza de la Constitución, Mercado de Ares, Museo del Mar |
| San Pedro de Ares | Quaint village known for its picturesque landscapes and tranquil environment, perfect for nature lovers and those seeking a peaceful retreat. | Praia de San Pedro, Cabo de la Estaca de Bares, Natural Area of Ares, Cabo de Bares lighthouse, Paseos por la naturaleza |
| Punta d'Áres | Scenic point offering stunning views of the Atlantic Ocean, a hotspot for photography and sunset views. Attractive to tourists and nature lovers. | Mirador de Punta d'Áres, Cliffs and ocean views, Hiking trails, Birdwatching opportunities, Local seafood restaurants |
| Cabo de Bares | A nature reserve known for its dramatic cliffs and biodiversity. Ideal for adventure tourists and those interested in hiking and exploring nature. | Cabo de Bares viewpoint, Hiking trails, Wildlife observation, Beaches like Praia de Bares, Kayaking and sailing |
| O Vicedo | Close to Ares, this village offers a quieter experience with beautiful beaches and local culture. Great for families and those wanting to escape the crowds. | Praia de Morouzos, Natural Park of the River Eo, Local seafood markets, Fishing experiences, Small cafés and bars |
| Cedeira | A bustling town nearby known for its beach and surf culture. Draws in younger tourists and surfers looking for excitement and activities. | Praia de Cedeira, Surfing schools, Restaurants and nightlife, Natural Park of the Fragas do Eume, Beautiful coastal walks |
| Miño | This nearby town offers access to a vast river beach and is perfect for summer tourism. Appeals to families and outdoor enthusiasts looking for water activities. | Miño River beach, Local festivals, Hiking trails along the river, Ferry services to nearby attractions, Restaurants along the riverbank |
Understanding Airbnb License Requirements & STR Laws in Ares (2025)
With 29% of listings showing registration in 2025, understanding potential Airbnb license requirements is crucial in Ares. Always verify the latest short term rental regulations and Airbnb license requirements directly with local government authorities for Ares to ensure full compliance before hosting.
(Source: AirROI data, 2025, based on 29% licensed listings)
Top Performing Airbnb Properties in Ares (2025)
Benchmark your potential! Explore examples of top-performing Airbnb properties in Aresbased on Trailing Twelve Month (TTM) revenue. Analyze their characteristics, revenue, occupancy rate, and ADR to understand what drives success in this market.
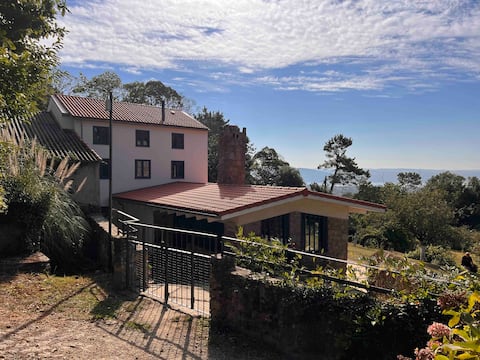
Exclusive cottage in a protected environment
Entire Place • 4 bedrooms

15-meter beach access NETS within 15 meters of beach access.
Entire Place • 4 bedrooms
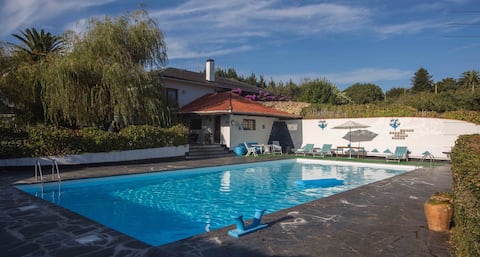
Chalet with pool in beach area
Entire Place • 4 bedrooms
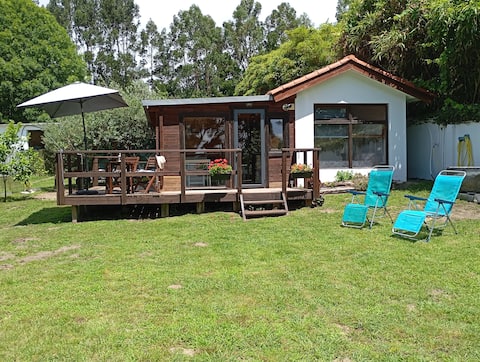
Beach cabin with garden.
Entire Place • 2 bedrooms
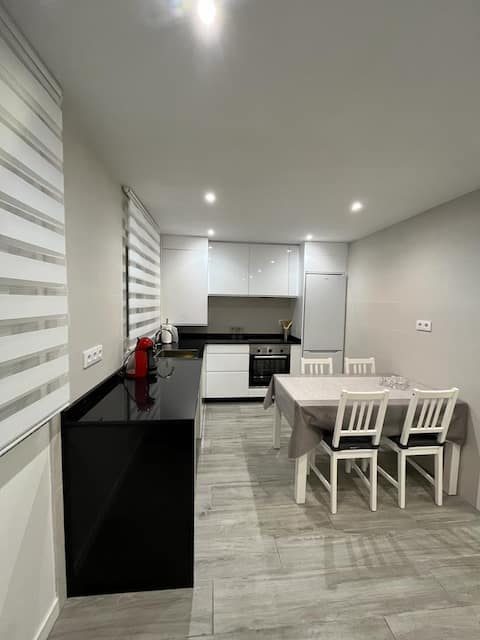
Ares Tourist Housing
Entire Place • 3 bedrooms

Casa Prado Grande in Redes (Ares)
Entire Place • 1 bedroom
Note: Performance varies based on location, size, amenities, seasonality, and management quality. Data reflects the past 12 months.
Top Performing Airbnb Hosts in Ares (2025)
Learn from the best! This table showcases top-performing Airbnb hosts in Ares based on the number of properties managed and estimated total revenue over the past year. Analyze their scale and performance metrics.
| Host Name | Properties | Grossing Revenue | Stay Reviews | Avg Rating |
|---|---|---|---|---|
| Patricia | 2 | $44,246 | 41 | 4.87/5.0 |
| Juan José Espiñeira López | 2 | $28,581 | 45 | 4.39/5.0 |
| Blanca | 2 | $27,575 | 26 | 4.92/5.0 |
| Jose Manuel | 2 | $25,942 | 171 | 4.88/5.0 |
| Isabel | 1 | $25,244 | 63 | 4.95/5.0 |
| Javier | 1 | $23,390 | 60 | 4.95/5.0 |
| Vicente | 1 | $23,294 | 84 | 4.90/5.0 |
| Alberto | 1 | $15,766 | 21 | 4.90/5.0 |
| Francisco Albino | 2 | $15,397 | 20 | 2.50/5.0 |
| Jaime | 2 | $15,083 | 27 | 4.88/5.0 |
Analyzing the strategies of top hosts, such as their property selection, pricing, and guest communication, can offer valuable lessons for optimizing your own Airbnb operations in Ares.
Dive Deeper: Advanced Ares STR Market Data (2025)
Ready to unlock more insights? AirROI provides access to advanced metrics and comprehensive Airbnb data for Ares. Explore detailed analytics beyond this report to refine your investment strategy, optimize pricing, and maximize your vacation rental profits.
Explore Advanced MetricsAres Short-Term Rental Market Composition (2025): Property & Room Types
Room Type Distribution
Property Type Distribution
Market Composition Insights for Ares
- The Ares Airbnb market composition is heavily skewed towards Entire Home/Apt listings, which make up 98.3% of the 58 active rentals. This indicates strong guest preference for privacy and space.
- Looking at the property type distribution in Ares, Apartment/Condo properties are the most common (72.4%), reflecting the local real estate landscape.
- Houses represent a significant 25.9% portion, catering likely to families or larger groups.
- Smaller segments like hotel/boutique (combined 1.7%) offer potential for unique stay experiences.
Ares Airbnb Room Capacity Analysis (2025): Bedroom Distribution
Distribution of Listings by Number of Bedrooms
Room Capacity Insights for Ares
- The dominant room capacity in Ares is 2 bedrooms listings, making up 39.7% of the market. This suggests a strong demand for properties suitable for couples or solo travelers.
- Together, 2 bedrooms and 1 bedroom properties represent 69.0% of the active Airbnb listings in Ares, indicating a high concentration in these sizes.
- A significant 29.2% of listings offer 3+ bedrooms, catering to larger groups and families seeking more space in Ares.
Ares Vacation Rental Guest Capacity Trends (2025)
Distribution of Listings by Guest Capacity
Guest Capacity Insights for Ares
- The most common guest capacity trend in Ares vacation rentals is listings accommodating 4 guests (41.4%). This suggests the primary traveler segment is likely small families or groups.
- Properties designed for 4 guests and 6 guests dominate the Ares STR market, accounting for 63.8% of listings.
- 34.4% of properties accommodate 6+ guests, serving the market segment for larger families or group travel in Ares.
- On average, properties in Ares are equipped to host 4.6 guests.
Ares Airbnb Booking Patterns (2025): Available vs. Booked Days
Available Days Distribution
Booked Days Distribution
Booking Pattern Insights for Ares
- The most common availability pattern in Ares falls within the 271-366 days range, representing 56.9% of listings. This suggests many properties have significant open periods on their calendars.
- Approximately 91.4% of listings show high availability (181+ days open annually), indicating potential for increased bookings or specific owner usage patterns.
- For booked days, the 31-90 days range is most frequent in Ares (46.6%), reflecting common guest stay durations or potential owner blocking patterns.
- A notable 8.6% of properties secure long booking periods (181+ days booked per year), highlighting successful long-term rental strategies or significant owner usage.
Ares Airbnb Minimum Stay Requirements Analysis
Distribution of Listings by Minimum Night Requirement
1 Night
7 listings
13% of total
2 Nights
18 listings
33.3% of total
3 Nights
12 listings
22.2% of total
4-6 Nights
9 listings
16.7% of total
7-29 Nights
5 listings
9.3% of total
30+ Nights
3 listings
5.6% of total
Key Insights
- The most prevalent minimum stay requirement in Ares is 2 Nights, adopted by 33.3% of listings. This highlights the market's preference for shorter, flexible bookings.
Recommendations
- Align with the market by considering a 2 Nights minimum stay, as 33.3% of Ares hosts use this setting.
- If feasible, allowing 1-night stays, especially midweek or during low season, could capture last-minute bookings, as only 13% currently do.
- A 2-night minimum appears standard (33.3%). Consider this for weekends or peak periods.
- Explore offering discounts for stays of 30+ nights to attract the 5.6% of the market seeking extended stays.
- Adjust minimum nights based on seasonality – potentially shorter during low season and longer during peak demand periods in Ares.
Ares Airbnb Cancellation Policy Trends Analysis (2025)
Flexible
4 listings
8.7% of total
Moderate
13 listings
28.3% of total
Firm
17 listings
37% of total
Strict
12 listings
26.1% of total
Cancellation Policy Insights for Ares
- The prevailing Airbnb cancellation policy trend in Ares is Firm, used by 37% of listings.
- A majority (63.1%) of hosts in Ares utilize Firm or Strict policies, indicating a market where hosts prioritize booking security.
Recommendations for Hosts
- Consider adopting a Firm policy to align with the 37% market standard in Ares.
- Regularly review your cancellation policy against competitors and market demand shifts in Ares.
Ares STR Booking Lead Time Analysis (2025)
Average Booking Lead Time by Month
Booking Lead Time Insights for Ares
- The overall average booking lead time for vacation rentals in Ares is 44 days.
- Guests book furthest in advance for stays during July (average 128 days), likely coinciding with peak travel demand or local events.
- The shortest booking windows occur for stays in February (average 8 days), indicating more last-minute travel plans during this time.
- Seasonally, Summer (89 days avg.) sees the longest lead times, while Winter (13 days avg.) has the shortest, reflecting typical travel planning cycles.
Recommendations for Hosts
- Use the overall average lead time (44 days) as a baseline for your pricing and availability strategy in Ares.
- For July stays, consider implementing length-of-stay discounts or slightly higher rates for bookings made less than 128 days out to capitalize on advance planning.
- During February, focus on last-minute booking availability and promotions, as guests book with very short notice (8 days avg.).
- Target marketing efforts for the Summer season well in advance (at least 89 days) to capture early planners.
- Monitor your own booking lead times against these Ares averages to identify opportunities for dynamic pricing adjustments.
Popular & Essential Airbnb Amenities in Ares (2025)
Amenity Prevalence
Amenity Insights for Ares
- Essential amenities in Ares that guests expect include: Kitchen. Lacking these (this) could significantly impact bookings.
- Popular amenities like TV, Hot water, Washer are common but not universal. Offering these can provide a competitive edge.
Recommendations for Hosts
- Ensure your listing includes all essential amenities for Ares: Kitchen.
- Prioritize adding missing essentials: Kitchen.
- Consider adding popular differentiators like TV or Hot water to increase appeal.
- Highlight unique or less common amenities you offer (e.g., hot tub, dedicated workspace, EV charger) in your listing description and photos.
- Regularly check competitor amenities in Ares to stay competitive.
Ares Airbnb Guest Demographics & Profile Analysis (2025)
Guest Profile Summary for Ares
- The typical guest profile for Airbnb in Ares consists of primarily domestic travelers (79%), often arriving from nearby Madrid, typically belonging to the Post-2000s (Gen Z/Alpha) group (50%), primarily speaking Spanish or English.
- Domestic travelers account for 79.3% of guests.
- Key international markets include Spain (79.3%) and United Kingdom (5.3%).
- Top languages spoken are Spanish (44%) followed by English (31.9%).
- A significant demographic segment is the Post-2000s (Gen Z/Alpha) group, representing 50% of guests.
Recommendations for Hosts
- Target domestic marketing efforts towards travelers from Madrid and Lugo.
- Tailor amenities and listing descriptions to appeal to the dominant Post-2000s (Gen Z/Alpha) demographic (e.g., highlight fast WiFi, smart home features, local guides).
- Highlight unique local experiences or amenities relevant to the primary guest profile.
- Consider seasonal promotions aligned with peak travel times for key origin markets.
Nearby Short-Term Rental Market Comparison
How does the Ares Airbnb market stack up against its neighbors? Compare key performance metrics like average monthly revenue, ADR, and occupancy rates in surrounding areas to understand the broader regional STR landscape.
| Market | Active Properties | Monthly Revenue | Daily Rate | Avg. Occupancy |
|---|---|---|---|---|
| Outes | 31 | $1,837 | $223.97 | 38% |
| A Fonsagrada | 16 | $1,773 | $154.02 | 42% |
| Pazos | 10 | $1,698 | $184.98 | 40% |
| Brión | 23 | $1,556 | $229.02 | 40% |
| Santiago de Compostela | 480 | $1,548 | $140.94 | 47% |
| Portomarín | 13 | $1,545 | $152.80 | 50% |
| Vedra | 11 | $1,536 | $192.42 | 40% |
| Teo | 50 | $1,487 | $158.59 | 37% |
| A Estrada | 39 | $1,433 | $196.13 | 37% |
| Sigüeiro | 11 | $1,417 | $142.43 | 40% |