Vilanova i la Geltrú Airbnb Market Analysis 2025: Short Term Rental Data & Vacation Rental Statistics in Catalonia, Spain
Is Airbnb profitable in Vilanova i la Geltrú in 2025? Explore comprehensive Airbnb analytics for Vilanova i la Geltrú, Catalonia, Spain to uncover income potential. This 2025 STR market report for Vilanova i la Geltrú, based on AirROI data from April 2024 to March 2025, reveals key trends in the niche market of 166 active listings.
Whether you're considering an Airbnb investment in Vilanova i la Geltrú, optimizing your existing vacation rental, or exploring rental arbitrage opportunities, understanding the Vilanova i la Geltrú Airbnb data is crucial. Navigating the high regulation landscape is key to maximizing your short term rental income potential. Let's dive into the specifics.
Key Vilanova i la Geltrú Airbnb Performance Metrics Overview
Monthly Airbnb Revenue Variations & Income Potential in Vilanova i la Geltrú (2025)
Understanding the monthly revenue variations for Airbnb listings in Vilanova i la Geltrú is key to maximizing your short term rental income potential. Seasonality significantly impacts earnings. Our analysis, based on data from the past 12 months, shows that the peak revenue month for STRs in Vilanova i la Geltrú is typically August, while March often presents the lowest earnings, highlighting opportunities for strategic pricing adjustments during shoulder and low seasons. Explore the typical Airbnb income in Vilanova i la Geltrú across different performance tiers:
- Best-in-class properties (Top 10%) achieve $4,287+ monthly, often utilizing dynamic pricing and superior guest experiences.
- Strong performing properties (Top 25%) earn $2,982 or more, indicating effective management and desirable locations/amenities.
- Typical properties (Median) generate around $1,862 per month, representing the average market performance.
- Entry-level properties (Bottom 25%) see earnings around $911, often with potential for optimization.
Average Monthly Airbnb Earnings Trend in Vilanova i la Geltrú
Vilanova i la Geltrú Airbnb Occupancy Rate Trends (2025)
Maximize your bookings by understanding the Vilanova i la Geltrú STR occupancy trends. Seasonal demand shifts significantly influence how often properties are booked. Typically, Augustsees the highest demand (peak season occupancy), while January experiences the lowest (low season). Effective strategies, like adjusting minimum stays or offering promotions, can boost occupancy during slower periods. Here's how different property tiers perform in Vilanova i la Geltrú:
- Best-in-class properties (Top 10%) achieve 85%+ occupancy, indicating high desirability and potentially optimized availability.
- Strong performing properties (Top 25%) maintain 67% or higher occupancy, suggesting good market fit and guest satisfaction.
- Typical properties (Median) have an occupancy rate around 43%.
- Entry-level properties (Bottom 25%) average 21% occupancy, potentially facing higher vacancy.
Average Monthly Occupancy Rate Trend in Vilanova i la Geltrú
Average Daily Rate (ADR) Airbnb Trends in Vilanova i la Geltrú (2025)
Effective short term rental pricing strategy in Vilanova i la Geltrú involves understanding monthly ADR fluctuations. The Average Daily Rate (ADR) for Airbnb in Vilanova i la Geltrú typically peaks in July and dips lowest during November. Leveraging Airbnb dynamic pricing tools or strategies based on this seasonality can significantly boost revenue. Here's a look at the typical nightly rates achieved:
- Best-in-class properties (Top 10%) command rates of $263+ per night, often due to premium features or locations.
- Strong performing properties (Top 25%) achieve nightly rates of $181 or more.
- Typical properties (Median) charge around $130 per night.
- Entry-level properties (Bottom 25%) earn around $90 per night.
Average Daily Rate (ADR) Trend by Month in Vilanova i la Geltrú
Get Live Vilanova i la Geltrú Market Intelligence 👇

Explore Real-time Analytics
Airbnb Seasonality Analysis & Trends in Vilanova i la Geltrú (2025)
Peak Season (August, July, May)
- Revenue averages $3,479 per month
- Occupancy rates average 57.4%
- Daily rates average $189
Shoulder Season
- Revenue averages $2,285 per month
- Occupancy maintains around 43.5%
- Daily rates hold near $178
Low Season (February, March, November)
- Revenue drops to average $1,551 per month
- Occupancy decreases to average 36.6%
- Daily rates adjust to average $160
Seasonality Insights for Vilanova i la Geltrú
- The Airbnb seasonality in Vilanova i la Geltrú shows highly seasonal trends requiring careful strategy. While the sections above show seasonal averages, it's also insightful to look at the extremes:
- During the high season, the absolute peak month showcases Vilanova i la Geltrú's highest earning potential, with monthly revenues capable of climbing to $3,749, occupancy reaching a high of 67.9%, and ADRs peaking at $192.
- Conversely, the slowest single month of the year, typically falling within the low season, marks the market's lowest point. In this month, revenue might dip to $1,468, occupancy could drop to 31.4%, and ADRs may adjust down to $145.
- Understanding both the seasonal averages and these monthly peaks and troughs in revenue, occupancy, and ADR is crucial for maximizing your Airbnb profit potential in Vilanova i la Geltrú.
Seasonal Strategies for Maximizing Profit
- Peak Season: Maximize revenue through premium pricing and potentially longer minimum stays. Ensure high availability.
- Low Season: Offer competitive pricing, special promotions (e.g., extended stay discounts), and flexible cancellation policies. Target off-season travelers like remote workers or budget-conscious guests.
- Shoulder Seasons: Implement dynamic pricing that balances peak and low rates. Target weekend travelers or specific events. Offer slightly more flexible terms than peak season.
- Regularly analyze your own performance against these Vilanova i la Geltrú seasonality benchmarks and adjust your pricing and availability strategy accordingly.
Best Areas for Airbnb Investment in Vilanova i la Geltrú (2025)
Exploring the top neighborhoods for short-term rentals in Vilanova i la Geltrú? This section highlights key areas, outlining why they are attractive for hosts and guests, along with notable local attractions. Consider these locations based on your target guest profile and investment strategy.
| Neighborhood / Area | Why Host Here? (Target Guests & Appeal) | Key Attractions & Landmarks |
|---|---|---|
| Playa de Vilanova | A popular beach area known for its golden sand and family-friendly atmosphere. Ideal for tourists looking to enjoy sun and sea, with plenty of beachfront restaurants and activities. | La Playa de Vilanova, Paseo Marítimo, Beach Clubs, Water Sports, Local Seafood Restaurants |
| Vilanova Town Center | The historic heart of Vilanova i la Geltrú, featuring charming streets, shops, and cafes. Great for tourists wanting to experience local culture and cuisine. | Vilanova Town Hall, Carrer de la Xile, Plaça de les Cols, Local Markets, Vilanova Museum |
| Ribes Roges | A quieter beach area with a more relaxed vibe, attracting families and those looking to escape the busier tourist spots. Offers beautiful views and a peaceful environment. | Ribes Roges Beach, Seafront Promenade, Public Parks, Local Cafes, Cycling Routes |
| Vilanova Port | A vibrant marina area with a mix of leisure and commercial activities. Perfect for tourists interested in boating, fishing, and enjoying waterfront dining. | Vilanova Marina, Fish Market, Waterfront Restaurants, Boat Tours, Cultural Events |
| La Geltrú | This area features a blend of beach and historic charm, with narrow streets and beautiful architecture. Ideal for visitors who enjoy a mix of relaxation and history. | Carrer de la Geltrú, Church of Sant Juan, Historic Buildings, Local Festivals, Cozy Cafes |
| CUnitat de Vigilància i Iniciatives-Régimen | This is an emerging area which is gaining popularity among tourists for its unique features and community activities. It is great for those looking for something different. | Local Art Installations, Community Markets, Workshops, Cultural Events, Outdoor Activities |
| Sant Gervasi | A stylish neighborhood that is increasingly sought after, featuring boutique shops and trendy eateries. Attracts visitors who appreciate aesthetics and style. | Boutique Shops, Gourmet Restaurants, Art Galleries, Relaxing Parks, Local Events |
| Cunit Beach | Slightly further but a fantastic beach option, known for its expansive sandy shores and friendly atmosphere. Popular with families and water sports enthusiasts. | Cunit Beach, Water Sports Activities, Local Beach Bars, Parks, Family-Friendly Activities |
Understanding Airbnb License Requirements & STR Laws in Vilanova i la Geltrú (2025)
Yes, Vilanova i la Geltrú, Catalonia, Spain enforces high STR regulations. Obtaining a license and ensuring compliance is almost certainly required according to current 2025 STR laws. Always verify the latest short term rental regulations and Airbnb license requirements directly with local government authorities for Vilanova i la Geltrú to ensure full compliance before hosting.
(Source: AirROI data, 2025, based on 75% licensed listings)
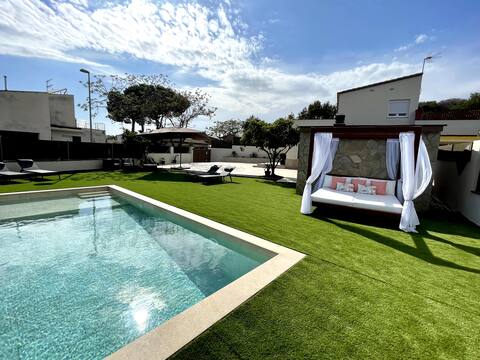
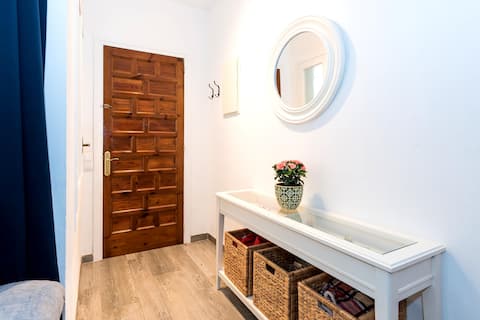
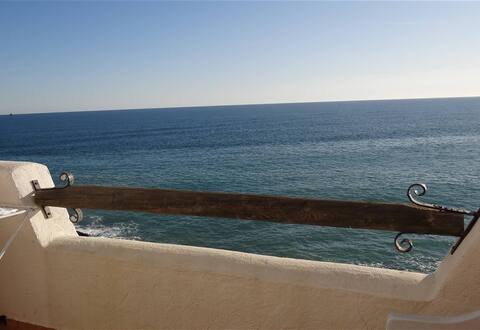
Top Performing Airbnb Properties in Vilanova i la Geltrú (2025)
Benchmark your potential! Explore examples of top-performing Airbnb properties in Vilanova i la Geltrúbased on Trailing Twelve Month (TTM) revenue. Analyze their characteristics, revenue, occupancy rate, and ADR to understand what drives success in this market.

Classic Beach Villa | Far by Palmera Group
Entire Place • 6 bedrooms
Cozy house with pool
Entire Place • 3 bedrooms
Pacefull house on the beach , Les portes Del Mar
Entire Place • 3 bedrooms

Duplex penthouse with a private balcony and a pool
Entire Place • 3 bedrooms

Villa Colibri 10 minuts. walk/beach/City. Garden +
Entire Place • 5 bedrooms
Sea breeze
Entire Place • 2 bedrooms
Note: Performance varies based on location, size, amenities, seasonality, and management quality. Data reflects the past 12 months.
Top Performing Airbnb Hosts in Vilanova i la Geltrú (2025)
Learn from the best! This table showcases top-performing Airbnb hosts in Vilanova i la Geltrú based on the number of properties managed and estimated total revenue over the past year. Analyze their scale and performance metrics.
| Host Name | Properties | Grossing Revenue | Stay Reviews | Avg Rating |
|---|---|---|---|---|
| Mark | 8 | $208,160 | 152 | 4.80/5.0 |
| Sonia | 9 | $173,432 | 85 | 3.79/5.0 |
| Jan | 3 | $131,478 | 58 | 4.96/5.0 |
| Rafael | 4 | $105,910 | 319 | 4.73/5.0 |
| Andrea | 5 | $77,224 | 123 | 4.82/5.0 |
| Félix | 7 | $75,575 | 18 | 1.97/5.0 |
| Ivan | 2 | $68,036 | 192 | 4.92/5.0 |
| Dana | 1 | $66,007 | 60 | 5.00/5.0 |
| Suso | 4 | $64,613 | 15 | 3.75/5.0 |
| Sergio | 3 | $64,600 | 693 | 4.78/5.0 |
Analyzing the strategies of top hosts, such as their property selection, pricing, and guest communication, can offer valuable lessons for optimizing your own Airbnb operations in Vilanova i la Geltrú.
Dive Deeper: Advanced Vilanova i la Geltrú STR Market Data (2025)
Ready to unlock more insights? AirROI provides access to advanced metrics and comprehensive Airbnb data for Vilanova i la Geltrú. Explore detailed analytics beyond this report to refine your investment strategy, optimize pricing, and maximize your vacation rental profits.
Explore Advanced MetricsVilanova i la Geltrú Short-Term Rental Market Composition (2025): Property & Room Types
Room Type Distribution
Property Type Distribution
Market Composition Insights for Vilanova i la Geltrú
- The Vilanova i la Geltrú Airbnb market composition is heavily skewed towards Entire Home/Apt listings, which make up 91.6% of the 166 active rentals. This indicates strong guest preference for privacy and space.
- Looking at the property type distribution in Vilanova i la Geltrú, Apartment/Condo properties are the most common (80.7%), reflecting the local real estate landscape.
- Houses represent a significant 16.3% portion, catering likely to families or larger groups.
- Smaller segments like outdoor/unique, hotel/boutique, others (combined 3.0%) offer potential for unique stay experiences.
Vilanova i la Geltrú Airbnb Room Capacity Analysis (2025): Bedroom Distribution
Distribution of Listings by Number of Bedrooms
Room Capacity Insights for Vilanova i la Geltrú
- The dominant room capacity in Vilanova i la Geltrú is 2 bedrooms listings, making up 34.3% of the market. This suggests a strong demand for properties suitable for couples or solo travelers.
- Together, 2 bedrooms and 3 bedrooms properties represent 65.0% of the active Airbnb listings in Vilanova i la Geltrú, indicating a high concentration in these sizes.
- A significant 43.3% of listings offer 3+ bedrooms, catering to larger groups and families seeking more space in Vilanova i la Geltrú.
Vilanova i la Geltrú Vacation Rental Guest Capacity Trends (2025)
Distribution of Listings by Guest Capacity
Guest Capacity Insights for Vilanova i la Geltrú
- The most common guest capacity trend in Vilanova i la Geltrú vacation rentals is listings accommodating 4 guests (31.9%). This suggests the primary traveler segment is likely small families or groups.
- Properties designed for 4 guests and 6 guests dominate the Vilanova i la Geltrú STR market, accounting for 53.6% of listings.
- 31.3% of properties accommodate 6+ guests, serving the market segment for larger families or group travel in Vilanova i la Geltrú.
- On average, properties in Vilanova i la Geltrú are equipped to host 4.5 guests.
Vilanova i la Geltrú Airbnb Booking Patterns (2025): Available vs. Booked Days
Available Days Distribution
Booked Days Distribution
Booking Pattern Insights for Vilanova i la Geltrú
- The most common availability pattern in Vilanova i la Geltrú falls within the 271-366 days range, representing 38.6% of listings. This suggests many properties have significant open periods on their calendars.
- Approximately 75.9% of listings show high availability (181+ days open annually), indicating potential for increased bookings or specific owner usage patterns.
- For booked days, the 91-180 days range is most frequent in Vilanova i la Geltrú (36.1%), reflecting common guest stay durations or potential owner blocking patterns.
- A notable 27.7% of properties secure long booking periods (181+ days booked per year), highlighting successful long-term rental strategies or significant owner usage.
Vilanova i la Geltrú Airbnb Minimum Stay Requirements Analysis
Distribution of Listings by Minimum Night Requirement
1 Night
26 listings
17.1% of total
2 Nights
25 listings
16.4% of total
3 Nights
22 listings
14.5% of total
4-6 Nights
40 listings
26.3% of total
7-29 Nights
4 listings
2.6% of total
30+ Nights
35 listings
23% of total
Key Insights
- The most prevalent minimum stay requirement in Vilanova i la Geltrú is 4-6 Nights, adopted by 26.3% of listings. This highlights the market's preference for longer commitments.
- A significant segment (23%) caters to monthly stays (30+ nights) in Vilanova i la Geltrú, pointing to opportunities in the extended-stay market.
Recommendations
- Align with the market by considering a 4-6 Nights minimum stay, as 26.3% of Vilanova i la Geltrú hosts use this setting.
- If feasible, allowing 1-night stays, especially midweek or during low season, could capture last-minute bookings, as only 17.1% currently do.
- Explore offering discounts for stays of 30+ nights to attract the 23% of the market seeking extended stays.
- Adjust minimum nights based on seasonality – potentially shorter during low season and longer during peak demand periods in Vilanova i la Geltrú.
Vilanova i la Geltrú Airbnb Cancellation Policy Trends Analysis (2025)
Super Strict 60 Days
4 listings
2.9% of total
Super Strict 30 Days
6 listings
4.3% of total
Flexible
19 listings
13.6% of total
Moderate
35 listings
25% of total
Firm
37 listings
26.4% of total
Strict
39 listings
27.9% of total
Cancellation Policy Insights for Vilanova i la Geltrú
- The prevailing Airbnb cancellation policy trend in Vilanova i la Geltrú is Strict, used by 27.9% of listings.
- A majority (54.3%) of hosts in Vilanova i la Geltrú utilize Firm or Strict policies, indicating a market where hosts prioritize booking security.
Recommendations for Hosts
- Consider adopting a Strict policy to align with the 27.9% market standard in Vilanova i la Geltrú.
- Regularly review your cancellation policy against competitors and market demand shifts in Vilanova i la Geltrú.
Vilanova i la Geltrú STR Booking Lead Time Analysis (2025)
Average Booking Lead Time by Month
Booking Lead Time Insights for Vilanova i la Geltrú
- The overall average booking lead time for vacation rentals in Vilanova i la Geltrú is 55 days.
- Guests book furthest in advance for stays during July (average 111 days), likely coinciding with peak travel demand or local events.
- The shortest booking windows occur for stays in February (average 40 days), indicating more last-minute travel plans during this time.
- Seasonally, Summer (90 days avg.) sees the longest lead times, while Winter (45 days avg.) has the shortest, reflecting typical travel planning cycles.
Recommendations for Hosts
- Use the overall average lead time (55 days) as a baseline for your pricing and availability strategy in Vilanova i la Geltrú.
- For July stays, consider implementing length-of-stay discounts or slightly higher rates for bookings made less than 111 days out to capitalize on advance planning.
- Target marketing efforts for the Summer season well in advance (at least 90 days) to capture early planners.
- Monitor your own booking lead times against these Vilanova i la Geltrú averages to identify opportunities for dynamic pricing adjustments.
Popular & Essential Airbnb Amenities in Vilanova i la Geltrú (2025)
Amenity Prevalence
Amenity Insights for Vilanova i la Geltrú
- Essential amenities in Vilanova i la Geltrú that guests expect include: Wifi, Kitchen. Lacking these (any) could significantly impact bookings.
- Popular amenities like Hot water, Heating, TV are common but not universal. Offering these can provide a competitive edge.
Recommendations for Hosts
- Ensure your listing includes all essential amenities for Vilanova i la Geltrú: Wifi, Kitchen.
- Prioritize adding missing essentials: Wifi, Kitchen.
- Consider adding popular differentiators like Hot water or Heating to increase appeal.
- Highlight unique or less common amenities you offer (e.g., hot tub, dedicated workspace, EV charger) in your listing description and photos.
- Regularly check competitor amenities in Vilanova i la Geltrú to stay competitive.
Vilanova i la Geltrú Airbnb Guest Demographics & Profile Analysis (2025)
Guest Profile Summary for Vilanova i la Geltrú
- The typical guest profile for Airbnb in Vilanova i la Geltrú consists of predominantly international visitors (80%), with top international origins including France, typically belonging to the Post-2000s (Gen Z/Alpha) group (50%), primarily speaking English or Spanish.
- Domestic travelers account for 20.3% of guests.
- Key international markets include Spain (20.3%) and France (17.3%).
- Top languages spoken are English (36.6%) followed by Spanish (19.7%).
- A significant demographic segment is the Post-2000s (Gen Z/Alpha) group, representing 50% of guests.
Recommendations for Hosts
- Focus marketing internationally, particularly towards travelers from France.
- Tailor amenities and listing descriptions to appeal to the dominant Post-2000s (Gen Z/Alpha) demographic (e.g., highlight fast WiFi, smart home features, local guides).
- Highlight unique local experiences or amenities relevant to the primary guest profile.
- Consider seasonal promotions aligned with peak travel times for key origin markets.
Nearby Short-Term Rental Market Comparison
How does the Vilanova i la Geltrú Airbnb market stack up against its neighbors? Compare key performance metrics like average monthly revenue, ADR, and occupancy rates in surrounding areas to understand the broader regional STR landscape.
| Market | Active Properties | Monthly Revenue | Daily Rate | Avg. Occupancy |
|---|---|---|---|---|
| Canyelles | 49 | $5,958 | $1023.94 | 37% |
| Arenys de Munt | 28 | $5,100 | $514.27 | 41% |
| Teià | 25 | $5,027 | $348.45 | 45% |
| Cornellà del Terri | 17 | $4,960 | $460.96 | 41% |
| Tiana | 12 | $4,955 | $299.97 | 48% |
| Amer | 10 | $4,848 | $397.58 | 40% |
| Bescanó | 11 | $4,761 | $445.38 | 41% |
| Porqueres | 12 | $4,714 | $469.05 | 36% |
| Premià de Dalt | 28 | $4,630 | $345.43 | 49% |
| Cabrils | 53 | $4,474 | $436.58 | 48% |