Tivissa Airbnb Market Analysis 2025: Short Term Rental Data & Vacation Rental Statistics in Catalonia, Spain
Is Airbnb profitable in Tivissa in 2025? Explore comprehensive Airbnb analytics for Tivissa, Catalonia, Spain to uncover income potential. This 2025 STR market report for Tivissa, based on AirROI data from April 2024 to March 2025, reveals key trends in the niche market of 20 active listings.
Whether you're considering an Airbnb investment in Tivissa, optimizing your existing vacation rental, or exploring rental arbitrage opportunities, understanding the Tivissa Airbnb data is crucial. Navigating the high regulation landscape is key to maximizing your short term rental income potential. Let's dive into the specifics.
Key Tivissa Airbnb Performance Metrics Overview
Monthly Airbnb Revenue Variations & Income Potential in Tivissa (2025)
Understanding the monthly revenue variations for Airbnb listings in Tivissa is key to maximizing your short term rental income potential. Seasonality significantly impacts earnings. Our analysis, based on data from the past 12 months, shows that the peak revenue month for STRs in Tivissa is typically July, while February often presents the lowest earnings, highlighting opportunities for strategic pricing adjustments during shoulder and low seasons. Explore the typical Airbnb income in Tivissa across different performance tiers:
- Best-in-class properties (Top 10%) achieve $3,322+ monthly, often utilizing dynamic pricing and superior guest experiences.
- Strong performing properties (Top 25%) earn $1,930 or more, indicating effective management and desirable locations/amenities.
- Typical properties (Median) generate around $838 per month, representing the average market performance.
- Entry-level properties (Bottom 25%) see earnings around $338, often with potential for optimization.
Average Monthly Airbnb Earnings Trend in Tivissa
Tivissa Airbnb Occupancy Rate Trends (2025)
Maximize your bookings by understanding the Tivissa STR occupancy trends. Seasonal demand shifts significantly influence how often properties are booked. Typically, Julysees the highest demand (peak season occupancy), while February experiences the lowest (low season). Effective strategies, like adjusting minimum stays or offering promotions, can boost occupancy during slower periods. Here's how different property tiers perform in Tivissa:
- Best-in-class properties (Top 10%) achieve 62%+ occupancy, indicating high desirability and potentially optimized availability.
- Strong performing properties (Top 25%) maintain 42% or higher occupancy, suggesting good market fit and guest satisfaction.
- Typical properties (Median) have an occupancy rate around 27%.
- Entry-level properties (Bottom 25%) average 13% occupancy, potentially facing higher vacancy.
Average Monthly Occupancy Rate Trend in Tivissa
Average Daily Rate (ADR) Airbnb Trends in Tivissa (2025)
Effective short term rental pricing strategy in Tivissa involves understanding monthly ADR fluctuations. The Average Daily Rate (ADR) for Airbnb in Tivissa typically peaks in January and dips lowest during September. Leveraging Airbnb dynamic pricing tools or strategies based on this seasonality can significantly boost revenue. Here's a look at the typical nightly rates achieved:
- Best-in-class properties (Top 10%) command rates of $218+ per night, often due to premium features or locations.
- Strong performing properties (Top 25%) achieve nightly rates of $127 or more.
- Typical properties (Median) charge around $73 per night.
- Entry-level properties (Bottom 25%) earn around $52 per night.
Average Daily Rate (ADR) Trend by Month in Tivissa
Get Live Tivissa Market Intelligence 👇

Explore Real-time Analytics
Airbnb Seasonality Analysis & Trends in Tivissa (2025)
Peak Season (July, August, May)
- Revenue averages $2,105 per month
- Occupancy rates average 42.6%
- Daily rates average $114
Shoulder Season
- Revenue averages $1,235 per month
- Occupancy maintains around 27.5%
- Daily rates hold near $116
Low Season (January, February, October)
- Revenue drops to average $752 per month
- Occupancy decreases to average 25.4%
- Daily rates adjust to average $117
Seasonality Insights for Tivissa
- The Airbnb seasonality in Tivissa shows highly seasonal trends requiring careful strategy. While the sections above show seasonal averages, it's also insightful to look at the extremes:
- During the high season, the absolute peak month showcases Tivissa's highest earning potential, with monthly revenues capable of climbing to $2,502, occupancy reaching a high of 52.0%, and ADRs peaking at $122.
- Conversely, the slowest single month of the year, typically falling within the low season, marks the market's lowest point. In this month, revenue might dip to $533, occupancy could drop to 19.9%, and ADRs may adjust down to $112.
- Understanding both the seasonal averages and these monthly peaks and troughs in revenue, occupancy, and ADR is crucial for maximizing your Airbnb profit potential in Tivissa.
Seasonal Strategies for Maximizing Profit
- Peak Season: Maximize revenue through premium pricing and potentially longer minimum stays. Ensure high availability.
- Low Season: Offer competitive pricing, special promotions (e.g., extended stay discounts), and flexible cancellation policies. Target off-season travelers like remote workers or budget-conscious guests.
- Shoulder Seasons: Implement dynamic pricing that balances peak and low rates. Target weekend travelers or specific events. Offer slightly more flexible terms than peak season.
- Regularly analyze your own performance against these Tivissa seasonality benchmarks and adjust your pricing and availability strategy accordingly.
Best Areas for Airbnb Investment in Tivissa (2025)
Exploring the top neighborhoods for short-term rentals in Tivissa? This section highlights key areas, outlining why they are attractive for hosts and guests, along with notable local attractions. Consider these locations based on your target guest profile and investment strategy.
| Neighborhood / Area | Why Host Here? (Target Guests & Appeal) | Key Attractions & Landmarks |
|---|---|---|
| Tivissa Village | Charming historic village with traditional Catalan architecture and a relaxed atmosphere. Ideal for travelers looking for an authentic cultural experience in the heart of Catalonia. | Local wine cellars, Sant Bartomeu Church, Cultural festivals, Walking trails, Scenic viewpoints |
| Miravet | A picturesque village located near the river Ebro, known for its medieval castle and stunning landscapes. Attracts history enthusiasts and nature lovers. | Miravet Castle, Ebro River views, Kayaking, Artisan shops, Historical sites |
| Caseres | Small, quiet village perfect for those seeking tranquility and beautiful nature surroundings. Great for eco-tourism and rural retreats. | Beautiful hiking trails, Natural parks, Local wildlife, Rural landscapes, Stargazing |
| Falset | Located nearby, known for its excellent wine production and charming town center. Attracts wine lovers and culinary tourists. | Wine tasting tours, Falset Castle, Gastronomy festivals, Local markets, Historical tours |
| Riba-roja d’Ebre | A river town with outdoor activities including fishing and hiking. Popular for families and adventurers. | Ebro River activities, Nature trails, Fishing spots, Picnic areas, Outdoor sports |
| Vandellòs i l’Hospitalet de l’Infant | Coastal area with beautiful beaches and a variety of outdoor activities available. Suitable for beach tourism and family vacations. | Beaches, Water sports, Nature reserves, Coastal hiking, Family-friendly activities |
| Colldejou | A serene village surrounded by nature, perfect for rural tourism and relaxation away from urban life. | Natural landscapes, Hiking paths, Quiet retreats, Villager interactions, Traditional cuisine |
| Pratdip | A hidden gem with stunning views and hiking opportunities, ideal for those interested in nature and peace. | Mountain trails, Village charm, Local festivals, Cultural heritage, Relaxing spots |
Understanding Airbnb License Requirements & STR Laws in Tivissa (2025)
Yes, Tivissa, Catalonia, Spain enforces high STR regulations. Obtaining a license and ensuring compliance is almost certainly required according to current 2025 STR laws. Always verify the latest short term rental regulations and Airbnb license requirements directly with local government authorities for Tivissa to ensure full compliance before hosting.
(Source: AirROI data, 2025, based on 80% licensed listings)
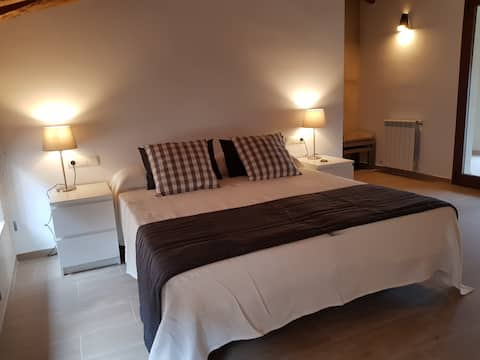
Top Performing Airbnb Properties in Tivissa (2025)
Benchmark your potential! Explore examples of top-performing Airbnb properties in Tivissabased on Trailing Twelve Month (TTM) revenue. Analyze their characteristics, revenue, occupancy rate, and ADR to understand what drives success in this market.

Rural accommodation Les Violetes
Entire Place • 7 bedrooms
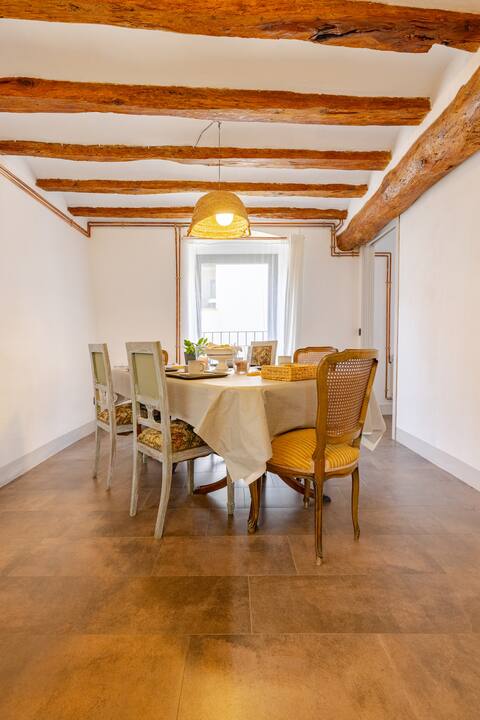
CASA MURADA - Rural accommodation
Entire Place • 5 bedrooms
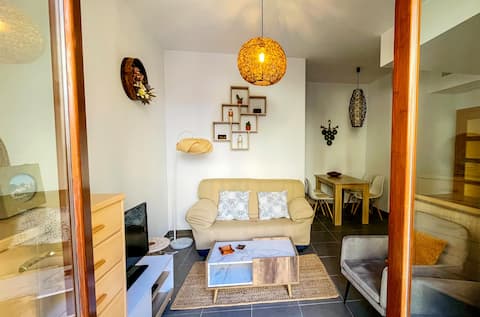
Ca la Mum
Entire Place • 2 bedrooms
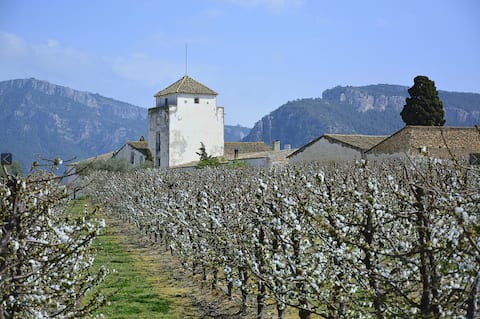
Finca Mas d'Alerany- Pool und Terrase - 8-16 pax
Entire Place • 7 bedrooms

The corner of the stairs
Entire Place • 2 bedrooms
Apartament rural Monetze
Entire Place • 3 bedrooms
Note: Performance varies based on location, size, amenities, seasonality, and management quality. Data reflects the past 12 months.
Top Performing Airbnb Hosts in Tivissa (2025)
Learn from the best! This table showcases top-performing Airbnb hosts in Tivissa based on the number of properties managed and estimated total revenue over the past year. Analyze their scale and performance metrics.
| Host Name | Properties | Grossing Revenue | Stay Reviews | Avg Rating |
|---|---|---|---|---|
| Ingrid | 1 | $50,319 | 10 | 4.90/5.0 |
| Jordi | 1 | $29,555 | 20 | 5.00/5.0 |
| Marta | 1 | $26,936 | 33 | 5.00/5.0 |
| Roser - | 1 | $24,466 | 5 | 5.00/5.0 |
| Eva | 1 | $20,853 | 17 | 4.88/5.0 |
| Monica | 1 | $17,151 | 20 | 4.90/5.0 |
| Host #117734246 | 1 | $14,566 | 30 | 4.83/5.0 |
| Wilma | 2 | $13,393 | 18 | 4.79/5.0 |
| Josep | 1 | $8,421 | 30 | 4.87/5.0 |
| Laura | 2 | $6,503 | 7 | 4.54/5.0 |
Analyzing the strategies of top hosts, such as their property selection, pricing, and guest communication, can offer valuable lessons for optimizing your own Airbnb operations in Tivissa.
Dive Deeper: Advanced Tivissa STR Market Data (2025)
Ready to unlock more insights? AirROI provides access to advanced metrics and comprehensive Airbnb data for Tivissa. Explore detailed analytics beyond this report to refine your investment strategy, optimize pricing, and maximize your vacation rental profits.
Explore Advanced MetricsTivissa Short-Term Rental Market Composition (2025): Property & Room Types
Room Type Distribution
Property Type Distribution
Market Composition Insights for Tivissa
- The Tivissa Airbnb market composition is heavily skewed towards Entire Home/Apt listings, which make up 65% of the 20 active rentals. This indicates strong guest preference for privacy and space.
- However, a notable 35% share for Private Rooms suggests opportunities for budget-conscious travelers or hosts renting out spare rooms.
- Looking at the property type distribution in Tivissa, House properties are the most common (50%), reflecting the local real estate landscape.
- Houses represent a significant 50% portion, catering likely to families or larger groups.
- The presence of 25% Hotel/Boutique listings indicates integration with traditional hospitality.
Tivissa Airbnb Room Capacity Analysis (2025): Bedroom Distribution
Distribution of Listings by Number of Bedrooms
Room Capacity Insights for Tivissa
- The dominant room capacity in Tivissa is 1 bedroom listings, making up 30% of the market. This suggests a strong demand for properties suitable for couples or solo travelers.
- Together, 1 bedroom and 2 bedrooms properties represent 45.0% of the active Airbnb listings in Tivissa, indicating a high concentration in these sizes.
- A significant 30.0% of listings offer 3+ bedrooms, catering to larger groups and families seeking more space in Tivissa.
Tivissa Vacation Rental Guest Capacity Trends (2025)
Distribution of Listings by Guest Capacity
Guest Capacity Insights for Tivissa
- The most common guest capacity trend in Tivissa vacation rentals is listings accommodating 8+ guests (15%). This suggests the primary traveler segment is likely larger groups.
- Properties designed for 8+ guests and 3 guests dominate the Tivissa STR market, accounting for 30.0% of listings.
- 25.0% of properties accommodate 6+ guests, serving the market segment for larger families or group travel in Tivissa.
- On average, properties in Tivissa are equipped to host 3.7 guests.
Tivissa Airbnb Booking Patterns (2025): Available vs. Booked Days
Available Days Distribution
Booked Days Distribution
Booking Pattern Insights for Tivissa
- The most common availability pattern in Tivissa falls within the 271-366 days range, representing 55% of listings. This suggests many properties have significant open periods on their calendars.
- Approximately 80.0% of listings show high availability (181+ days open annually), indicating potential for increased bookings or specific owner usage patterns.
- For booked days, the 91-180 days range is most frequent in Tivissa (30%), reflecting common guest stay durations or potential owner blocking patterns.
- A notable 20.0% of properties secure long booking periods (181+ days booked per year), highlighting successful long-term rental strategies or significant owner usage.
Tivissa Airbnb Minimum Stay Requirements Analysis
Distribution of Listings by Minimum Night Requirement
1 Night
8 listings
44.4% of total
2 Nights
7 listings
38.9% of total
4-6 Nights
1 listings
5.6% of total
30+ Nights
2 listings
11.1% of total
Key Insights
- The most prevalent minimum stay requirement in Tivissa is 1 Night, adopted by 44.4% of listings. This highlights the market's preference for shorter, flexible bookings.
- A strong majority (83.3%) of the Tivissa Airbnb data shows acceptance of very short stays (1-2 nights), indicating a dynamic, high-turnover market.
- A significant segment (11.1%) caters to monthly stays (30+ nights) in Tivissa, pointing to opportunities in the extended-stay market.
Recommendations
- Align with the market by considering a 1 Night minimum stay, as 44.4% of Tivissa hosts use this setting.
- Explore offering discounts for stays of 30+ nights to attract the 11.1% of the market seeking extended stays.
- Adjust minimum nights based on seasonality – potentially shorter during low season and longer during peak demand periods in Tivissa.
Tivissa Airbnb Cancellation Policy Trends Analysis (2025)
Flexible
7 listings
38.9% of total
Moderate
3 listings
16.7% of total
Firm
2 listings
11.1% of total
Strict
6 listings
33.3% of total
Cancellation Policy Insights for Tivissa
- The prevailing Airbnb cancellation policy trend in Tivissa is Flexible, used by 38.9% of listings.
- There's a relatively balanced mix between guest-friendly (55.6%) and stricter (44.4%) policies, offering choices for different guest needs.
Recommendations for Hosts
- Consider adopting a Flexible policy to align with the 38.9% market standard in Tivissa.
- With 33.3% using Strict terms, this is a viable option in Tivissa, particularly for high-value properties or during peak demand periods.
- Regularly review your cancellation policy against competitors and market demand shifts in Tivissa.
Tivissa STR Booking Lead Time Analysis (2025)
Average Booking Lead Time by Month
Booking Lead Time Insights for Tivissa
- The overall average booking lead time for vacation rentals in Tivissa is 52 days.
- Guests book furthest in advance for stays during June (average 81 days), likely coinciding with peak travel demand or local events.
- The shortest booking windows occur for stays in March (average 29 days), indicating more last-minute travel plans during this time.
- Seasonally, Summer (65 days avg.) sees the longest lead times, while Spring (39 days avg.) has the shortest, reflecting typical travel planning cycles.
Recommendations for Hosts
- Use the overall average lead time (52 days) as a baseline for your pricing and availability strategy in Tivissa.
- For June stays, consider implementing length-of-stay discounts or slightly higher rates for bookings made less than 81 days out to capitalize on advance planning.
- Target marketing efforts for the Summer season well in advance (at least 65 days) to capture early planners.
- Monitor your own booking lead times against these Tivissa averages to identify opportunities for dynamic pricing adjustments.
Popular & Essential Airbnb Amenities in Tivissa (2025)
Amenity Prevalence
Amenity Insights for Tivissa
- Popular amenities like Essentials, Hangers, Hot water are common but not universal. Offering these can provide a competitive edge.
- Warning: Wifi is not universally provided but is considered essential globally. Ensure reliable Wifi is offered.
Recommendations for Hosts
- Consider adding popular differentiators like Essentials or Hangers to increase appeal.
- Highlight unique or less common amenities you offer (e.g., hot tub, dedicated workspace, EV charger) in your listing description and photos.
- Regularly check competitor amenities in Tivissa to stay competitive.
Tivissa Airbnb Guest Demographics & Profile Analysis (2025)
Guest Profile Summary for Tivissa
- The typical guest profile for Airbnb in Tivissa consists of a mix of domestic (45%) and international guests, with top international origins including France, typically belonging to the Post-2000s (Gen Z/Alpha) group (50%), primarily speaking English or Spanish.
- Domestic travelers account for 45.1% of guests.
- Key international markets include Spain (45.1%) and France (19.6%).
- Top languages spoken are English (29%) followed by Spanish (24.4%).
- A significant demographic segment is the Post-2000s (Gen Z/Alpha) group, representing 50% of guests.
Recommendations for Hosts
- Balance marketing efforts between domestic and international channels based on the guest mix.
- Tailor amenities and listing descriptions to appeal to the dominant Post-2000s (Gen Z/Alpha) demographic (e.g., highlight fast WiFi, smart home features, local guides).
- Highlight unique local experiences or amenities relevant to the primary guest profile.
- Consider seasonal promotions aligned with peak travel times for key origin markets.
Nearby Short-Term Rental Market Comparison
How does the Tivissa Airbnb market stack up against its neighbors? Compare key performance metrics like average monthly revenue, ADR, and occupancy rates in surrounding areas to understand the broader regional STR landscape.
| Market | Active Properties | Monthly Revenue | Daily Rate | Avg. Occupancy |
|---|---|---|---|---|
| Canyelles | 49 | $5,958 | $1023.94 | 37% |
| la Baronia de Rialb | 14 | $4,296 | $393.88 | 43% |
| Sant Martí Sarroca | 10 | $3,855 | $337.60 | 43% |
| Banyeres del Penedès | 12 | $3,474 | $373.99 | 37% |
| Mediona | 11 | $3,355 | $550.99 | 37% |
| Corbera de Llobregat | 14 | $3,275 | $304.33 | 52% |
| Riudoms | 10 | $3,270 | $363.84 | 36% |
| Olivella | 94 | $3,211 | $420.71 | 41% |
| Castellet i la Gornal | 15 | $3,167 | $465.42 | 39% |
| Aiguamúrcia | 11 | $3,008 | $223.61 | 47% |