Tarragona Airbnb Market Analysis 2025: Short Term Rental Data & Vacation Rental Statistics in Catalonia, Spain
Is Airbnb profitable in Tarragona in 2025? Explore comprehensive Airbnb analytics for Tarragona, Catalonia, Spain to uncover income potential. This 2025 STR market report for Tarragona, based on AirROI data from April 2024 to March 2025, reveals key trends in the market of 598 active listings.
Whether you're considering an Airbnb investment in Tarragona, optimizing your existing vacation rental, or exploring rental arbitrage opportunities, understanding the Tarragona Airbnb data is crucial. Navigating the high regulation landscape is key to maximizing your short term rental income potential. Let's dive into the specifics.
Key Tarragona Airbnb Performance Metrics Overview
Monthly Airbnb Revenue Variations & Income Potential in Tarragona (2025)
Understanding the monthly revenue variations for Airbnb listings in Tarragona is key to maximizing your short term rental income potential. Seasonality significantly impacts earnings. Our analysis, based on data from the past 12 months, shows that the peak revenue month for STRs in Tarragona is typically August, while February often presents the lowest earnings, highlighting opportunities for strategic pricing adjustments during shoulder and low seasons. Explore the typical Airbnb income in Tarragona across different performance tiers:
- Best-in-class properties (Top 10%) achieve $3,761+ monthly, often utilizing dynamic pricing and superior guest experiences.
- Strong performing properties (Top 25%) earn $2,580 or more, indicating effective management and desirable locations/amenities.
- Typical properties (Median) generate around $1,563 per month, representing the average market performance.
- Entry-level properties (Bottom 25%) see earnings around $775, often with potential for optimization.
Average Monthly Airbnb Earnings Trend in Tarragona
Tarragona Airbnb Occupancy Rate Trends (2025)
Maximize your bookings by understanding the Tarragona STR occupancy trends. Seasonal demand shifts significantly influence how often properties are booked. Typically, Augustsees the highest demand (peak season occupancy), while January experiences the lowest (low season). Effective strategies, like adjusting minimum stays or offering promotions, can boost occupancy during slower periods. Here's how different property tiers perform in Tarragona:
- Best-in-class properties (Top 10%) achieve 83%+ occupancy, indicating high desirability and potentially optimized availability.
- Strong performing properties (Top 25%) maintain 66% or higher occupancy, suggesting good market fit and guest satisfaction.
- Typical properties (Median) have an occupancy rate around 43%.
- Entry-level properties (Bottom 25%) average 23% occupancy, potentially facing higher vacancy.
Average Monthly Occupancy Rate Trend in Tarragona
Average Daily Rate (ADR) Airbnb Trends in Tarragona (2025)
Effective short term rental pricing strategy in Tarragona involves understanding monthly ADR fluctuations. The Average Daily Rate (ADR) for Airbnb in Tarragona typically peaks in August and dips lowest during February. Leveraging Airbnb dynamic pricing tools or strategies based on this seasonality can significantly boost revenue. Here's a look at the typical nightly rates achieved:
- Best-in-class properties (Top 10%) command rates of $244+ per night, often due to premium features or locations.
- Strong performing properties (Top 25%) achieve nightly rates of $158 or more.
- Typical properties (Median) charge around $111 per night.
- Entry-level properties (Bottom 25%) earn around $74 per night.
Average Daily Rate (ADR) Trend by Month in Tarragona
Get Live Tarragona Market Intelligence 👇

Explore Real-time Analytics
Airbnb Seasonality Analysis & Trends in Tarragona (2025)
Peak Season (August, July, June)
- Revenue averages $3,068 per month
- Occupancy rates average 60.0%
- Daily rates average $154
Shoulder Season
- Revenue averages $1,809 per month
- Occupancy maintains around 44.1%
- Daily rates hold near $139
Low Season (January, February, March)
- Revenue drops to average $972 per month
- Occupancy decreases to average 33.0%
- Daily rates adjust to average $132
Seasonality Insights for Tarragona
- The Airbnb seasonality in Tarragona shows highly seasonal trends requiring careful strategy. While the sections above show seasonal averages, it's also insightful to look at the extremes:
- During the high season, the absolute peak month showcases Tarragona's highest earning potential, with monthly revenues capable of climbing to $3,491, occupancy reaching a high of 70.0%, and ADRs peaking at $157.
- Conversely, the slowest single month of the year, typically falling within the low season, marks the market's lowest point. In this month, revenue might dip to $937, occupancy could drop to 30.6%, and ADRs may adjust down to $130.
- Understanding both the seasonal averages and these monthly peaks and troughs in revenue, occupancy, and ADR is crucial for maximizing your Airbnb profit potential in Tarragona.
Seasonal Strategies for Maximizing Profit
- Peak Season: Maximize revenue through premium pricing and potentially longer minimum stays. Ensure high availability.
- Low Season: Offer competitive pricing, special promotions (e.g., extended stay discounts), and flexible cancellation policies. Target off-season travelers like remote workers or budget-conscious guests.
- Shoulder Seasons: Implement dynamic pricing that balances peak and low rates. Target weekend travelers or specific events. Offer slightly more flexible terms than peak season.
- Regularly analyze your own performance against these Tarragona seasonality benchmarks and adjust your pricing and availability strategy accordingly.
Best Areas for Airbnb Investment in Tarragona (2025)
Exploring the top neighborhoods for short-term rentals in Tarragona? This section highlights key areas, outlining why they are attractive for hosts and guests, along with notable local attractions. Consider these locations based on your target guest profile and investment strategy.
| Neighborhood / Area | Why Host Here? (Target Guests & Appeal) | Key Attractions & Landmarks |
|---|---|---|
| Tarragona City Center | The historic heart of Tarragona, offering ancient Roman ruins, a vibrant shopping scene, and local cafes. Ideal for tourists wanting to explore history and culture. | Tarragona Cathedral, Roman Amphitheatre, Plaza de la Font, National Archaeological Museum of Tarragona, Balcony of the Mediterranean |
| Mediterranean Beach | Beautiful coastline with sandy beaches and clear waters, perfect for summer vacations. Attracts families and beach lovers looking for sun and sea activities. | Platja del Miracle, Platja de la Arrabassada, Aquarium of Tarragona, Paseo Marítimo, Beach clubs and bars |
| Port Aventura World | A major theme park and resort, attracting families and thrill-seekers. Ideal for short stays and holiday rentals, particularly during peak seasons. | Port Aventura Park, Ferrari Land, Caribe Aquatic Park, Hotel Gold River, Themed restaurants |
| Altafulla | Charming coastal village close to Tarragona, known for its beautiful beaches and historical sites. Offers a quieter atmosphere for vacationers. | Platja d'Altafulla, Castle of Altafulla, Tamarit Beach, Tamarit Castle, Local seafood restaurants |
| Salou | Popular tourist destination known for its beaches and nightlife, particularly among younger crowds and families. | Salou Beach, PortAventura, Llevant Beach, Capellans Beach, Promenade with bars and restaurants |
| Reus | Birthplace of Gaudi, rich in modernist architecture and known for shopping. A great spot for short-term rentals catering to cultural tourists. | Gaudi Centre Reus, Plaça del Mercadal, Modernist buildings, Cultural events, Local foods and wines |
| Cambrils | Fishing village known for its gastronomy and stunning marina. Attracts tourists looking for a more relaxed coastal experience. | Cambrils Beach, Cambrils Marina, Culinary festivals, Water sports, Promenade with shops and restaurants |
| La Pineda | Family-friendly beach resort with a relaxed atmosphere, ideal for those visiting the nearby theme parks. | Aquapolis Water Park, La Pineda Beach, Shops and cafes, Family-friendly hotels, Nearby nature trails |
Understanding Airbnb License Requirements & STR Laws in Tarragona (2025)
Yes, Tarragona, Catalonia, Spain enforces high STR regulations. Obtaining a license and ensuring compliance is almost certainly required according to current 2025 STR laws. Always verify the latest short term rental regulations and Airbnb license requirements directly with local government authorities for Tarragona to ensure full compliance before hosting.
(Source: AirROI data, 2025, based on 78% licensed listings)
Top Performing Airbnb Properties in Tarragona (2025)
Benchmark your potential! Explore examples of top-performing Airbnb properties in Tarragonabased on Trailing Twelve Month (TTM) revenue. Analyze their characteristics, revenue, occupancy rate, and ADR to understand what drives success in this market.
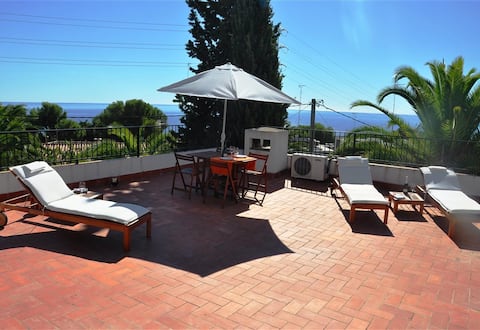
Villa besides the sea - 3 bedrooms
Entire Place • 3 bedrooms

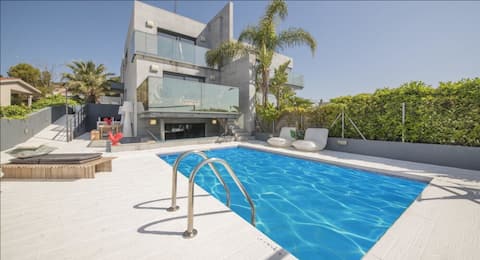
Villa Mora II Pool Oasis
Entire Place • 4 bedrooms
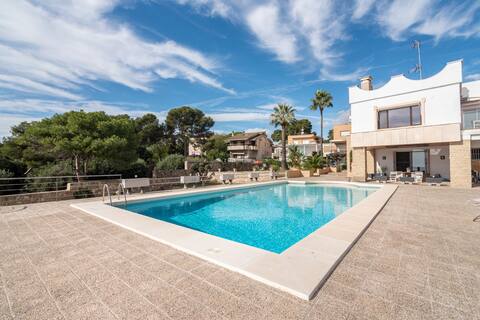
Clauhomes Villa Al Mar Deluxe
Entire Place • 3 bedrooms

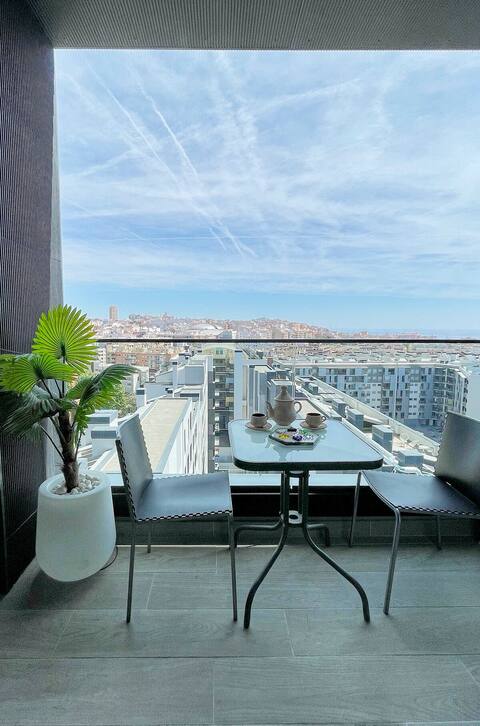
Villa La Mora & Pool Oasis
Entire Place • 4 bedrooms
Oceanfront house in Tarragona city
Entire Place • 3 bedrooms
Unik Vacation The Tower
Entire Place • 2 bedrooms
Note: Performance varies based on location, size, amenities, seasonality, and management quality. Data reflects the past 12 months.
Top Performing Airbnb Hosts in Tarragona (2025)
Learn from the best! This table showcases top-performing Airbnb hosts in Tarragona based on the number of properties managed and estimated total revenue over the past year. Analyze their scale and performance metrics.
| Host Name | Properties | Grossing Revenue | Stay Reviews | Avg Rating |
|---|---|---|---|---|
| Unik Vacation | 35 | $879,247 | 1170 | 3.90/5.0 |
| Toni | 7 | $376,920 | 329 | 4.79/5.0 |
| Mediterranean Way | 20 | $329,334 | 126 | 2.77/5.0 |
| Tarraco Homes | 22 | $214,515 | 126 | 2.59/5.0 |
| Augusto | 25 | $179,014 | 241 | 2.74/5.0 |
| Noemi | 12 | $161,775 | 443 | 4.72/5.0 |
| Claudia | 6 | $154,721 | 23 | 3.01/5.0 |
| Mediterrani Natura Spa Resort | 12 | $143,901 | 228 | 4.22/5.0 |
| Lika | 4 | $140,925 | 81 | 4.59/5.0 |
| Holidu | 1 | $136,545 | 7 | 4.29/5.0 |
Analyzing the strategies of top hosts, such as their property selection, pricing, and guest communication, can offer valuable lessons for optimizing your own Airbnb operations in Tarragona.
Dive Deeper: Advanced Tarragona STR Market Data (2025)
Ready to unlock more insights? AirROI provides access to advanced metrics and comprehensive Airbnb data for Tarragona. Explore detailed analytics beyond this report to refine your investment strategy, optimize pricing, and maximize your vacation rental profits.
Explore Advanced MetricsTarragona Short-Term Rental Market Composition (2025): Property & Room Types
Room Type Distribution
Property Type Distribution
Market Composition Insights for Tarragona
- The Tarragona Airbnb market composition is heavily skewed towards Entire Home/Apt listings, which make up 86.5% of the 598 active rentals. This indicates strong guest preference for privacy and space.
- Looking at the property type distribution in Tarragona, Apartment/Condo properties are the most common (82.4%), reflecting the local real estate landscape.
- Smaller segments like outdoor/unique, hotel/boutique, others (combined 4.4%) offer potential for unique stay experiences.
Tarragona Airbnb Room Capacity Analysis (2025): Bedroom Distribution
Distribution of Listings by Number of Bedrooms
Room Capacity Insights for Tarragona
- The dominant room capacity in Tarragona is 1 bedroom listings, making up 31.9% of the market. This suggests a strong demand for properties suitable for couples or solo travelers.
- Together, 1 bedroom and 2 bedrooms properties represent 59.7% of the active Airbnb listings in Tarragona, indicating a high concentration in these sizes.
- A significant 29.1% of listings offer 3+ bedrooms, catering to larger groups and families seeking more space in Tarragona.
Tarragona Vacation Rental Guest Capacity Trends (2025)
Distribution of Listings by Guest Capacity
Guest Capacity Insights for Tarragona
- The most common guest capacity trend in Tarragona vacation rentals is listings accommodating 4 guests (29.9%). This suggests the primary traveler segment is likely small families or groups.
- Properties designed for 4 guests and 2 guests dominate the Tarragona STR market, accounting for 48.6% of listings.
- 23.6% of properties accommodate 6+ guests, serving the market segment for larger families or group travel in Tarragona.
- On average, properties in Tarragona are equipped to host 4.0 guests.
Tarragona Airbnb Booking Patterns (2025): Available vs. Booked Days
Available Days Distribution
Booked Days Distribution
Booking Pattern Insights for Tarragona
- The most common availability pattern in Tarragona falls within the 271-366 days range, representing 43.6% of listings. This suggests many properties have significant open periods on their calendars.
- Approximately 74.7% of listings show high availability (181+ days open annually), indicating potential for increased bookings or specific owner usage patterns.
- For booked days, the 91-180 days range is most frequent in Tarragona (31.4%), reflecting common guest stay durations or potential owner blocking patterns.
- A notable 26.5% of properties secure long booking periods (181+ days booked per year), highlighting successful long-term rental strategies or significant owner usage.
Tarragona Airbnb Minimum Stay Requirements Analysis
Distribution of Listings by Minimum Night Requirement
1 Night
95 listings
16.9% of total
2 Nights
158 listings
28.1% of total
3 Nights
61 listings
10.8% of total
4-6 Nights
81 listings
14.4% of total
7-29 Nights
46 listings
8.2% of total
30+ Nights
122 listings
21.7% of total
Key Insights
- The most prevalent minimum stay requirement in Tarragona is 2 Nights, adopted by 28.1% of listings. This highlights the market's preference for shorter, flexible bookings.
- A significant segment (21.7%) caters to monthly stays (30+ nights) in Tarragona, pointing to opportunities in the extended-stay market.
Recommendations
- Align with the market by considering a 2 Nights minimum stay, as 28.1% of Tarragona hosts use this setting.
- If feasible, allowing 1-night stays, especially midweek or during low season, could capture last-minute bookings, as only 16.9% currently do.
- Explore offering discounts for stays of 30+ nights to attract the 21.7% of the market seeking extended stays.
- Adjust minimum nights based on seasonality – potentially shorter during low season and longer during peak demand periods in Tarragona.
Tarragona Airbnb Cancellation Policy Trends Analysis (2025)
Super Strict 30 Days
5 listings
1% of total
Super Strict 60 Days
1 listings
0.2% of total
Flexible
104 listings
20.6% of total
Moderate
196 listings
38.9% of total
Firm
88 listings
17.5% of total
Strict
110 listings
21.8% of total
Cancellation Policy Insights for Tarragona
- The prevailing Airbnb cancellation policy trend in Tarragona is Moderate, used by 38.9% of listings.
- There's a relatively balanced mix between guest-friendly (59.5%) and stricter (39.3%) policies, offering choices for different guest needs.
Recommendations for Hosts
- Consider adopting a Moderate policy to align with the 38.9% market standard in Tarragona.
- Regularly review your cancellation policy against competitors and market demand shifts in Tarragona.
Tarragona STR Booking Lead Time Analysis (2025)
Average Booking Lead Time by Month
Booking Lead Time Insights for Tarragona
- The overall average booking lead time for vacation rentals in Tarragona is 50 days.
- Guests book furthest in advance for stays during July (average 83 days), likely coinciding with peak travel demand or local events.
- The shortest booking windows occur for stays in March (average 34 days), indicating more last-minute travel plans during this time.
- Seasonally, Summer (79 days avg.) sees the longest lead times, while Winter (40 days avg.) has the shortest, reflecting typical travel planning cycles.
Recommendations for Hosts
- Use the overall average lead time (50 days) as a baseline for your pricing and availability strategy in Tarragona.
- For July stays, consider implementing length-of-stay discounts or slightly higher rates for bookings made less than 83 days out to capitalize on advance planning.
- Target marketing efforts for the Summer season well in advance (at least 79 days) to capture early planners.
- Monitor your own booking lead times against these Tarragona averages to identify opportunities for dynamic pricing adjustments.
Popular & Essential Airbnb Amenities in Tarragona (2025)
Amenity Prevalence
Amenity Insights for Tarragona
- Essential amenities in Tarragona that guests expect include: Wifi, Kitchen. Lacking these (any) could significantly impact bookings.
- Popular amenities like TV, Washer, Hot water are common but not universal. Offering these can provide a competitive edge.
Recommendations for Hosts
- Ensure your listing includes all essential amenities for Tarragona: Wifi, Kitchen.
- Prioritize adding missing essentials: Wifi, Kitchen.
- Consider adding popular differentiators like TV or Washer to increase appeal.
- Highlight unique or less common amenities you offer (e.g., hot tub, dedicated workspace, EV charger) in your listing description and photos.
- Regularly check competitor amenities in Tarragona to stay competitive.
Tarragona Airbnb Guest Demographics & Profile Analysis (2025)
Guest Profile Summary for Tarragona
- The typical guest profile for Airbnb in Tarragona consists of predominantly international visitors (80%), with top international origins including Spain, typically belonging to the Post-2000s (Gen Z/Alpha) group (50%), primarily speaking English or Spanish.
- Domestic travelers account for 19.6% of guests.
- Key international markets include France (21.1%) and Spain (19.6%).
- Top languages spoken are English (37.5%) followed by Spanish (20.7%).
- A significant demographic segment is the Post-2000s (Gen Z/Alpha) group, representing 50% of guests.
Recommendations for Hosts
- Focus marketing internationally, particularly towards travelers from Spain.
- Tailor amenities and listing descriptions to appeal to the dominant Post-2000s (Gen Z/Alpha) demographic (e.g., highlight fast WiFi, smart home features, local guides).
- Highlight unique local experiences or amenities relevant to the primary guest profile.
- Consider seasonal promotions aligned with peak travel times for key origin markets.
Nearby Short-Term Rental Market Comparison
How does the Tarragona Airbnb market stack up against its neighbors? Compare key performance metrics like average monthly revenue, ADR, and occupancy rates in surrounding areas to understand the broader regional STR landscape.
| Market | Active Properties | Monthly Revenue | Daily Rate | Avg. Occupancy |
|---|---|---|---|---|
| Canyelles | 49 | $5,958 | $1023.94 | 37% |
| Arenys de Munt | 28 | $5,100 | $514.27 | 41% |
| Teià | 25 | $5,027 | $348.45 | 45% |
| Cornellà del Terri | 17 | $4,960 | $460.96 | 41% |
| Tiana | 12 | $4,955 | $299.97 | 48% |
| Amer | 10 | $4,848 | $397.58 | 40% |
| Bescanó | 11 | $4,761 | $445.38 | 41% |
| Porqueres | 12 | $4,714 | $469.05 | 36% |
| Premià de Dalt | 28 | $4,630 | $345.43 | 49% |
| Cabrils | 53 | $4,474 | $436.58 | 48% |