Santa Susanna Airbnb Market Analysis 2025: Short Term Rental Data & Vacation Rental Statistics in Catalonia, Spain
Is Airbnb profitable in Santa Susanna in 2025? Explore comprehensive Airbnb analytics for Santa Susanna, Catalonia, Spain to uncover income potential. This 2025 STR market report for Santa Susanna, based on AirROI data from April 2024 to March 2025, reveals key trends in the niche market of 65 active listings.
Whether you're considering an Airbnb investment in Santa Susanna, optimizing your existing vacation rental, or exploring rental arbitrage opportunities, understanding the Santa Susanna Airbnb data is crucial. Navigating the high regulation landscape is key to maximizing your short term rental income potential. Let's dive into the specifics.
Key Santa Susanna Airbnb Performance Metrics Overview
Monthly Airbnb Revenue Variations & Income Potential in Santa Susanna (2025)
Understanding the monthly revenue variations for Airbnb listings in Santa Susanna is key to maximizing your short term rental income potential. Seasonality significantly impacts earnings. Our analysis, based on data from the past 12 months, shows that the peak revenue month for STRs in Santa Susanna is typically August, while February often presents the lowest earnings, highlighting opportunities for strategic pricing adjustments during shoulder and low seasons. Explore the typical Airbnb income in Santa Susanna across different performance tiers:
- Best-in-class properties (Top 10%) achieve $8,272+ monthly, often utilizing dynamic pricing and superior guest experiences.
- Strong performing properties (Top 25%) earn $5,146 or more, indicating effective management and desirable locations/amenities.
- Typical properties (Median) generate around $2,523 per month, representing the average market performance.
- Entry-level properties (Bottom 25%) see earnings around $1,102, often with potential for optimization.
Average Monthly Airbnb Earnings Trend in Santa Susanna
Santa Susanna Airbnb Occupancy Rate Trends (2025)
Maximize your bookings by understanding the Santa Susanna STR occupancy trends. Seasonal demand shifts significantly influence how often properties are booked. Typically, Augustsees the highest demand (peak season occupancy), while March experiences the lowest (low season). Effective strategies, like adjusting minimum stays or offering promotions, can boost occupancy during slower periods. Here's how different property tiers perform in Santa Susanna:
- Best-in-class properties (Top 10%) achieve 68%+ occupancy, indicating high desirability and potentially optimized availability.
- Strong performing properties (Top 25%) maintain 54% or higher occupancy, suggesting good market fit and guest satisfaction.
- Typical properties (Median) have an occupancy rate around 35%.
- Entry-level properties (Bottom 25%) average 17% occupancy, potentially facing higher vacancy.
Average Monthly Occupancy Rate Trend in Santa Susanna
Average Daily Rate (ADR) Airbnb Trends in Santa Susanna (2025)
Effective short term rental pricing strategy in Santa Susanna involves understanding monthly ADR fluctuations. The Average Daily Rate (ADR) for Airbnb in Santa Susanna typically peaks in December and dips lowest during October. Leveraging Airbnb dynamic pricing tools or strategies based on this seasonality can significantly boost revenue. Here's a look at the typical nightly rates achieved:
- Best-in-class properties (Top 10%) command rates of $683+ per night, often due to premium features or locations.
- Strong performing properties (Top 25%) achieve nightly rates of $387 or more.
- Typical properties (Median) charge around $219 per night.
- Entry-level properties (Bottom 25%) earn around $144 per night.
Average Daily Rate (ADR) Trend by Month in Santa Susanna
Get Live Santa Susanna Market Intelligence 👇

Explore Real-time Analytics
Airbnb Seasonality Analysis & Trends in Santa Susanna (2025)
Peak Season (August, July, May)
- Revenue averages $6,150 per month
- Occupancy rates average 55.4%
- Daily rates average $333
Shoulder Season
- Revenue averages $3,765 per month
- Occupancy maintains around 34.3%
- Daily rates hold near $327
Low Season (February, March, November)
- Revenue drops to average $1,932 per month
- Occupancy decreases to average 23.5%
- Daily rates adjust to average $343
Seasonality Insights for Santa Susanna
- The Airbnb seasonality in Santa Susanna shows highly seasonal trends requiring careful strategy. While the sections above show seasonal averages, it's also insightful to look at the extremes:
- During the high season, the absolute peak month showcases Santa Susanna's highest earning potential, with monthly revenues capable of climbing to $6,982, occupancy reaching a high of 67.1%, and ADRs peaking at $355.
- Conversely, the slowest single month of the year, typically falling within the low season, marks the market's lowest point. In this month, revenue might dip to $1,692, occupancy could drop to 17.5%, and ADRs may adjust down to $304.
- Understanding both the seasonal averages and these monthly peaks and troughs in revenue, occupancy, and ADR is crucial for maximizing your Airbnb profit potential in Santa Susanna.
Seasonal Strategies for Maximizing Profit
- Peak Season: Maximize revenue through premium pricing and potentially longer minimum stays. Ensure high availability.
- Low Season: Offer competitive pricing, special promotions (e.g., extended stay discounts), and flexible cancellation policies. Target off-season travelers like remote workers or budget-conscious guests.
- Shoulder Seasons: Implement dynamic pricing that balances peak and low rates. Target weekend travelers or specific events. Offer slightly more flexible terms than peak season.
- Regularly analyze your own performance against these Santa Susanna seasonality benchmarks and adjust your pricing and availability strategy accordingly.
Best Areas for Airbnb Investment in Santa Susanna (2025)
Exploring the top neighborhoods for short-term rentals in Santa Susanna? This section highlights key areas, outlining why they are attractive for hosts and guests, along with notable local attractions. Consider these locations based on your target guest profile and investment strategy.
| Neighborhood / Area | Why Host Here? (Target Guests & Appeal) | Key Attractions & Landmarks |
|---|---|---|
| Santa Susanna Beach | Stunning beach known for its golden sands and clear waters. A perfect destination for tourists looking to relax by the Mediterranean Sea, making it ideal for beach holiday rentals. | Santa Susanna Beach, Water Sports Activities, Local Restaurants and Bars, Promenade with Shops, Beach Parks |
| Cultural Center | The town's cultural hub, attracting visitors interested in local history and traditions. Great for hosting visitors looking to experience the essence of Catalonia. | Can Ratés Cultural Center, Local Festivals, Historical Walks, Art Exhibitions, Church of Santa Susanna |
| Natural Parks | Surrounded by beautiful natural parks, this area is perfect for nature enthusiasts. Ideal for Airbnb hosts who can cater to eco-tourists and hikers. | Montnegre i el Corredor Natural Park, Hiking Trails, Nature Observation, Picnic Areas, Wildlife Spotting |
| Downtown Santa Susanna | The bustling center featuring shops, restaurants, and entertainment options. A favorite among tourists who want to be in the middle of action and amenities. | Shopping Streets, Local Market, Restaurants and Cafes, Nightlife, Street Performers |
| Close to Barcelona | Located just a short train ride from Barcelona, attracting guests wanting to explore the city while enjoying the beach. Great option for those looking for a quieter stay. | Train to Barcelona, Day Trips to Barcelona, Cultural Events in Barcelona, Shopping in Barcelona, Barcelona Architecture |
| Water Park Area | Proximity to family-friendly water parks draws visitors with kids. Ideal for family-oriented Airbnb hosts. | Water World Lloret, Family-friendly Activities, Kids Entertainment, Amusement Attractions, Nearby Beaches |
| Local Gastronomy | Santa Susanna has an array of local restaurants and tapas bars, perfect for foodies. Visitors are often drawn to try Catalan cuisine. | Traditional Catalan Cuisine, Wine Tasting Tours, Local Markets, Cooking Classes, Food Tours |
| Nightlife | The vibrant nightlife scene attracts younger tourists looking for fun. Owners can capitalize on short stays during weekends and holidays. | Nightclubs, Live Music Venues, Bar Hopping, Local Festivals, Summer Concerts |
Understanding Airbnb License Requirements & STR Laws in Santa Susanna (2025)
Yes, Santa Susanna, Catalonia, Spain enforces high STR regulations. Obtaining a license and ensuring compliance is almost certainly required according to current 2025 STR laws. Always verify the latest short term rental regulations and Airbnb license requirements directly with local government authorities for Santa Susanna to ensure full compliance before hosting.
(Source: AirROI data, 2025, based on 77% licensed listings)
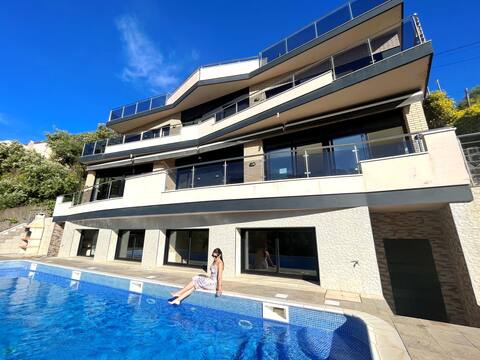
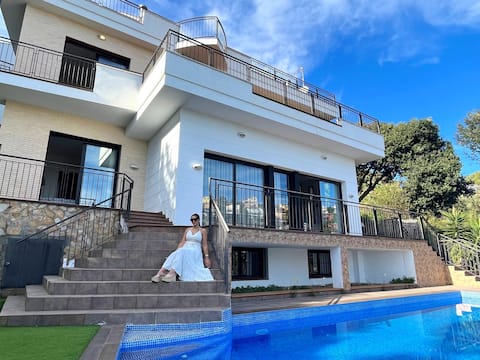
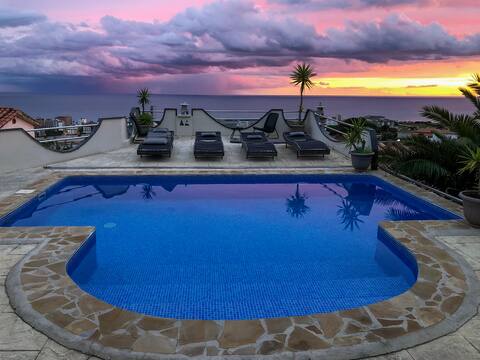
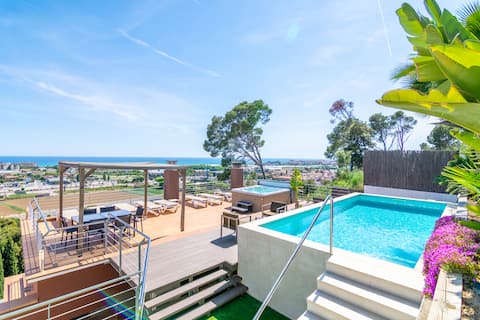
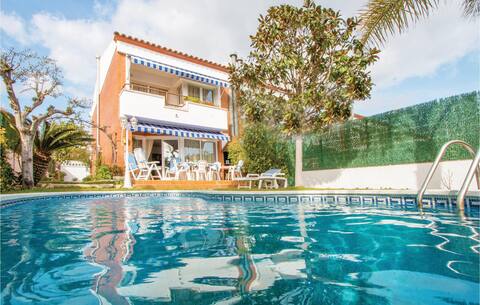
Top Performing Airbnb Properties in Santa Susanna (2025)
Benchmark your potential! Explore examples of top-performing Airbnb properties in Santa Susannabased on Trailing Twelve Month (TTM) revenue. Analyze their characteristics, revenue, occupancy rate, and ADR to understand what drives success in this market.

House with heated pool 29ºC
Entire Place • 4 bedrooms
Luxury villa with sea views and private pool
Entire Place • N/A
Deluxe ocean view house with private pool
Entire Place • 4 bedrooms
Villa Serenity Panoramic View
Entire Place • 5 bedrooms
★ CoastalVillas - Villa Horizon ★ cosy&stylish
Entire Place • 4 bedrooms
Awesome home in Santa Susanna with WiFi
Entire Place • 4 bedrooms
Note: Performance varies based on location, size, amenities, seasonality, and management quality. Data reflects the past 12 months.
Top Performing Airbnb Hosts in Santa Susanna (2025)
Learn from the best! This table showcases top-performing Airbnb hosts in Santa Susanna based on the number of properties managed and estimated total revenue over the past year. Analyze their scale and performance metrics.
| Host Name | Properties | Grossing Revenue | Stay Reviews | Avg Rating |
|---|---|---|---|---|
| Mónica | 3 | $394,020 | 40 | 4.97/5.0 |
| Novasol | 4 | $131,984 | 35 | 3.17/5.0 |
| Roger - Hauzify | 3 | $116,788 | 101 | 4.74/5.0 |
| Yourhouseinspain Sabine | 4 | $108,005 | 83 | 4.85/5.0 |
| Elizaveta | 1 | $87,187 | 17 | 4.82/5.0 |
| CoastalVillas | 1 | $77,222 | 45 | 4.69/5.0 |
| Novasol | 1 | $73,190 | 15 | 4.33/5.0 |
| Sònia | 2 | $73,006 | 10 | 4.92/5.0 |
| Jordi | 3 | $70,821 | 94 | 4.61/5.0 |
| Nick | 1 | $69,778 | 59 | 4.93/5.0 |
Analyzing the strategies of top hosts, such as their property selection, pricing, and guest communication, can offer valuable lessons for optimizing your own Airbnb operations in Santa Susanna.
Dive Deeper: Advanced Santa Susanna STR Market Data (2025)
Ready to unlock more insights? AirROI provides access to advanced metrics and comprehensive Airbnb data for Santa Susanna. Explore detailed analytics beyond this report to refine your investment strategy, optimize pricing, and maximize your vacation rental profits.
Explore Advanced MetricsSanta Susanna Short-Term Rental Market Composition (2025): Property & Room Types
Room Type Distribution
Property Type Distribution
Market Composition Insights for Santa Susanna
- The Santa Susanna Airbnb market composition is heavily skewed towards Entire Home/Apt listings, which make up 95.4% of the 65 active rentals. This indicates strong guest preference for privacy and space.
- Looking at the property type distribution in Santa Susanna, House properties are the most common (56.9%), reflecting the local real estate landscape.
- Houses represent a significant 56.9% portion, catering likely to families or larger groups.
- Smaller segments like hotel/boutique, unique stays (combined 3.0%) offer potential for unique stay experiences.
Santa Susanna Airbnb Room Capacity Analysis (2025): Bedroom Distribution
Distribution of Listings by Number of Bedrooms
Room Capacity Insights for Santa Susanna
- The dominant room capacity in Santa Susanna is 2 bedrooms listings, making up 27.7% of the market. This suggests a strong demand for properties suitable for couples or solo travelers.
- Together, 2 bedrooms and 4 bedrooms properties represent 49.2% of the active Airbnb listings in Santa Susanna, indicating a high concentration in these sizes.
- A significant 56.9% of listings offer 3+ bedrooms, catering to larger groups and families seeking more space in Santa Susanna.
Santa Susanna Vacation Rental Guest Capacity Trends (2025)
Distribution of Listings by Guest Capacity
Guest Capacity Insights for Santa Susanna
- The most common guest capacity trend in Santa Susanna vacation rentals is listings accommodating 8+ guests (41.5%). This suggests the primary traveler segment is likely larger groups.
- Properties designed for 8+ guests and 4 guests dominate the Santa Susanna STR market, accounting for 66.1% of listings.
- 63.0% of properties accommodate 6+ guests, serving the market segment for larger families or group travel in Santa Susanna.
- On average, properties in Santa Susanna are equipped to host 6.1 guests.
Santa Susanna Airbnb Booking Patterns (2025): Available vs. Booked Days
Available Days Distribution
Booked Days Distribution
Booking Pattern Insights for Santa Susanna
- The most common availability pattern in Santa Susanna falls within the 271-366 days range, representing 55.4% of listings. This suggests many properties have significant open periods on their calendars.
- Approximately 90.8% of listings show high availability (181+ days open annually), indicating potential for increased bookings or specific owner usage patterns.
- For booked days, the 31-90 days range is most frequent in Santa Susanna (41.5%), reflecting common guest stay durations or potential owner blocking patterns.
- A notable 10.7% of properties secure long booking periods (181+ days booked per year), highlighting successful long-term rental strategies or significant owner usage.
Santa Susanna Airbnb Minimum Stay Requirements Analysis
Distribution of Listings by Minimum Night Requirement
1 Night
15 listings
25% of total
2 Nights
9 listings
15% of total
3 Nights
6 listings
10% of total
4-6 Nights
17 listings
28.3% of total
7-29 Nights
3 listings
5% of total
30+ Nights
10 listings
16.7% of total
Key Insights
- The most prevalent minimum stay requirement in Santa Susanna is 4-6 Nights, adopted by 28.3% of listings. This highlights the market's preference for longer commitments.
- A significant segment (16.7%) caters to monthly stays (30+ nights) in Santa Susanna, pointing to opportunities in the extended-stay market.
Recommendations
- Align with the market by considering a 4-6 Nights minimum stay, as 28.3% of Santa Susanna hosts use this setting.
- If feasible, allowing 1-night stays, especially midweek or during low season, could capture last-minute bookings, as only 25% currently do.
- Explore offering discounts for stays of 30+ nights to attract the 16.7% of the market seeking extended stays.
- Adjust minimum nights based on seasonality – potentially shorter during low season and longer during peak demand periods in Santa Susanna.
Santa Susanna Airbnb Cancellation Policy Trends Analysis (2025)
Super Strict 60 Days
6 listings
11.3% of total
Super Strict 30 Days
4 listings
7.5% of total
Flexible
6 listings
11.3% of total
Moderate
6 listings
11.3% of total
Firm
15 listings
28.3% of total
Strict
16 listings
30.2% of total
Cancellation Policy Insights for Santa Susanna
- The prevailing Airbnb cancellation policy trend in Santa Susanna is Strict, used by 30.2% of listings.
- A majority (58.5%) of hosts in Santa Susanna utilize Firm or Strict policies, indicating a market where hosts prioritize booking security.
Recommendations for Hosts
- Consider adopting a Strict policy to align with the 30.2% market standard in Santa Susanna.
- With 30.2% using Strict terms, this is a viable option in Santa Susanna, particularly for high-value properties or during peak demand periods.
- Regularly review your cancellation policy against competitors and market demand shifts in Santa Susanna.
Santa Susanna STR Booking Lead Time Analysis (2025)
Average Booking Lead Time by Month
Booking Lead Time Insights for Santa Susanna
- The overall average booking lead time for vacation rentals in Santa Susanna is 71 days.
- Guests book furthest in advance for stays during July (average 123 days), likely coinciding with peak travel demand or local events.
- The shortest booking windows occur for stays in January (average 40 days), indicating more last-minute travel plans during this time.
- Seasonally, Summer (105 days avg.) sees the longest lead times, while Winter (45 days avg.) has the shortest, reflecting typical travel planning cycles.
Recommendations for Hosts
- Use the overall average lead time (71 days) as a baseline for your pricing and availability strategy in Santa Susanna.
- For July stays, consider implementing length-of-stay discounts or slightly higher rates for bookings made less than 123 days out to capitalize on advance planning.
- Target marketing efforts for the Summer season well in advance (at least 105 days) to capture early planners.
- Monitor your own booking lead times against these Santa Susanna averages to identify opportunities for dynamic pricing adjustments.
Popular & Essential Airbnb Amenities in Santa Susanna (2025)
Amenity Prevalence
Amenity Insights for Santa Susanna
- Essential amenities in Santa Susanna that guests expect include: Washer, Kitchen, TV. Lacking these (any) could significantly impact bookings.
- Popular amenities like Coffee maker, Wifi, Refrigerator are common but not universal. Offering these can provide a competitive edge.
- A pool is a highly desired but not standard amenity, making it a key feature for attracting guests seeking leisure in Santa Susanna.
- Warning: Wifi is not universally provided but is considered essential globally. Ensure reliable Wifi is offered.
Recommendations for Hosts
- Ensure your listing includes all essential amenities for Santa Susanna: Washer, Kitchen, TV.
- Prioritize adding missing essentials: Washer, Kitchen, TV.
- Consider adding popular differentiators like Coffee maker or Wifi to increase appeal.
- Highlight unique or less common amenities you offer (e.g., hot tub, dedicated workspace, EV charger) in your listing description and photos.
- Regularly check competitor amenities in Santa Susanna to stay competitive.
Santa Susanna Airbnb Guest Demographics & Profile Analysis (2025)
Guest Profile Summary for Santa Susanna
- The typical guest profile for Airbnb in Santa Susanna consists of predominantly international visitors (88%), with top international origins including Germany, typically belonging to the Post-2000s (Gen Z/Alpha) group (50%), primarily speaking English or French.
- Domestic travelers account for 11.7% of guests.
- Key international markets include France (34.2%) and Germany (12.9%).
- Top languages spoken are English (32.6%) followed by French (20.4%).
- A significant demographic segment is the Post-2000s (Gen Z/Alpha) group, representing 50% of guests.
Recommendations for Hosts
- Focus marketing internationally, particularly towards travelers from Germany.
- Tailor amenities and listing descriptions to appeal to the dominant Post-2000s (Gen Z/Alpha) demographic (e.g., highlight fast WiFi, smart home features, local guides).
- Highlight unique local experiences or amenities relevant to the primary guest profile.
- Consider seasonal promotions aligned with peak travel times for key origin markets.
Nearby Short-Term Rental Market Comparison
How does the Santa Susanna Airbnb market stack up against its neighbors? Compare key performance metrics like average monthly revenue, ADR, and occupancy rates in surrounding areas to understand the broader regional STR landscape.
| Market | Active Properties | Monthly Revenue | Daily Rate | Avg. Occupancy |
|---|---|---|---|---|
| Vall-llobrega | 15 | $10,261 | $798.88 | 44% |
| Canyelles | 49 | $5,958 | $1023.94 | 37% |
| Arenys de Munt | 28 | $5,100 | $514.27 | 41% |
| Teià | 25 | $5,027 | $348.45 | 45% |
| Cornellà del Terri | 17 | $4,960 | $460.96 | 41% |
| Tiana | 12 | $4,955 | $299.97 | 48% |
| Amer | 10 | $4,848 | $397.58 | 40% |
| Bescanó | 11 | $4,761 | $445.38 | 41% |
| Porqueres | 12 | $4,714 | $469.05 | 36% |
| Premià de Dalt | 28 | $4,630 | $345.43 | 49% |