Sant Cebrià de Vallalta Airbnb Market Analysis 2025: Short Term Rental Data & Vacation Rental Statistics in Catalonia, Spain
Is Airbnb profitable in Sant Cebrià de Vallalta in 2025? Explore comprehensive Airbnb analytics for Sant Cebrià de Vallalta, Catalonia, Spain to uncover income potential. This 2025 STR market report for Sant Cebrià de Vallalta, based on AirROI data from April 2024 to March 2025, reveals key trends in the niche market of 37 active listings.
Whether you're considering an Airbnb investment in Sant Cebrià de Vallalta, optimizing your existing vacation rental, or exploring rental arbitrage opportunities, understanding the Sant Cebrià de Vallalta Airbnb data is crucial. Navigating the high regulation landscape is key to maximizing your short term rental income potential. Let's dive into the specifics.
Key Sant Cebrià de Vallalta Airbnb Performance Metrics Overview
Monthly Airbnb Revenue Variations & Income Potential in Sant Cebrià de Vallalta (2025)
Understanding the monthly revenue variations for Airbnb listings in Sant Cebrià de Vallalta is key to maximizing your short term rental income potential. Seasonality significantly impacts earnings. Our analysis, based on data from the past 12 months, shows that the peak revenue month for STRs in Sant Cebrià de Vallalta is typically August, while February often presents the lowest earnings, highlighting opportunities for strategic pricing adjustments during shoulder and low seasons. Explore the typical Airbnb income in Sant Cebrià de Vallalta across different performance tiers:
- Best-in-class properties (Top 10%) achieve $8,790+ monthly, often utilizing dynamic pricing and superior guest experiences.
- Strong performing properties (Top 25%) earn $5,707 or more, indicating effective management and desirable locations/amenities.
- Typical properties (Median) generate around $3,070 per month, representing the average market performance.
- Entry-level properties (Bottom 25%) see earnings around $1,539, often with potential for optimization.
Average Monthly Airbnb Earnings Trend in Sant Cebrià de Vallalta
Sant Cebrià de Vallalta Airbnb Occupancy Rate Trends (2025)
Maximize your bookings by understanding the Sant Cebrià de Vallalta STR occupancy trends. Seasonal demand shifts significantly influence how often properties are booked. Typically, Augustsees the highest demand (peak season occupancy), while January experiences the lowest (low season). Effective strategies, like adjusting minimum stays or offering promotions, can boost occupancy during slower periods. Here's how different property tiers perform in Sant Cebrià de Vallalta:
- Best-in-class properties (Top 10%) achieve 75%+ occupancy, indicating high desirability and potentially optimized availability.
- Strong performing properties (Top 25%) maintain 55% or higher occupancy, suggesting good market fit and guest satisfaction.
- Typical properties (Median) have an occupancy rate around 36%.
- Entry-level properties (Bottom 25%) average 21% occupancy, potentially facing higher vacancy.
Average Monthly Occupancy Rate Trend in Sant Cebrià de Vallalta
Average Daily Rate (ADR) Airbnb Trends in Sant Cebrià de Vallalta (2025)
Effective short term rental pricing strategy in Sant Cebrià de Vallalta involves understanding monthly ADR fluctuations. The Average Daily Rate (ADR) for Airbnb in Sant Cebrià de Vallalta typically peaks in July and dips lowest during January. Leveraging Airbnb dynamic pricing tools or strategies based on this seasonality can significantly boost revenue. Here's a look at the typical nightly rates achieved:
- Best-in-class properties (Top 10%) command rates of $537+ per night, often due to premium features or locations.
- Strong performing properties (Top 25%) achieve nightly rates of $397 or more.
- Typical properties (Median) charge around $284 per night.
- Entry-level properties (Bottom 25%) earn around $192 per night.
Average Daily Rate (ADR) Trend by Month in Sant Cebrià de Vallalta
Get Live Sant Cebrià de Vallalta Market Intelligence 👇

Explore Real-time Analytics
Airbnb Seasonality Analysis & Trends in Sant Cebrià de Vallalta (2025)
Peak Season (August, July, June)
- Revenue averages $6,820 per month
- Occupancy rates average 57.4%
- Daily rates average $361
Shoulder Season
- Revenue averages $3,557 per month
- Occupancy maintains around 35.9%
- Daily rates hold near $329
Low Season (January, February, November)
- Revenue drops to average $2,327 per month
- Occupancy decreases to average 30.5%
- Daily rates adjust to average $286
Seasonality Insights for Sant Cebrià de Vallalta
- The Airbnb seasonality in Sant Cebrià de Vallalta shows highly seasonal trends requiring careful strategy. While the sections above show seasonal averages, it's also insightful to look at the extremes:
- During the high season, the absolute peak month showcases Sant Cebrià de Vallalta's highest earning potential, with monthly revenues capable of climbing to $8,545, occupancy reaching a high of 75.3%, and ADRs peaking at $366.
- Conversely, the slowest single month of the year, typically falling within the low season, marks the market's lowest point. In this month, revenue might dip to $2,302, occupancy could drop to 28.2%, and ADRs may adjust down to $281.
- Understanding both the seasonal averages and these monthly peaks and troughs in revenue, occupancy, and ADR is crucial for maximizing your Airbnb profit potential in Sant Cebrià de Vallalta.
Seasonal Strategies for Maximizing Profit
- Peak Season: Maximize revenue through premium pricing and potentially longer minimum stays. Ensure high availability.
- Low Season: Offer competitive pricing, special promotions (e.g., extended stay discounts), and flexible cancellation policies. Target off-season travelers like remote workers or budget-conscious guests.
- Shoulder Seasons: Implement dynamic pricing that balances peak and low rates. Target weekend travelers or specific events. Offer slightly more flexible terms than peak season.
- Regularly analyze your own performance against these Sant Cebrià de Vallalta seasonality benchmarks and adjust your pricing and availability strategy accordingly.
Best Areas for Airbnb Investment in Sant Cebrià de Vallalta (2025)
Exploring the top neighborhoods for short-term rentals in Sant Cebrià de Vallalta? This section highlights key areas, outlining why they are attractive for hosts and guests, along with notable local attractions. Consider these locations based on your target guest profile and investment strategy.
| Neighborhood / Area | Why Host Here? (Target Guests & Appeal) | Key Attractions & Landmarks |
|---|---|---|
| Sant Cebrià Beach | A picturesque beach area that attracts tourists looking for sun, sea, and relaxation. Ideal for vacation rentals with stunning coastal views. | Sant Cebrià de Vallalta Beach, La Roca Village, Pineda de Mar, Calella de la Costa, Parque de la Llacuna |
| Village Center | The charming village center offers a blend of local culture, shops, and restaurants. It appeals to visitors wanting an authentic Catalan experience. | Sant Cebrià Church, Local markets, Cafés and restaurants, Cultural festivals |
| Nearby Natural Parks | Surrounded by natural parks, the area is perfect for nature lovers and outdoor activities. Great for guests who enjoy hiking and exploring. | Montnegre i el Corredor Natural Park, Hiking trails, Picnic areas, Flora and fauna |
| Golf Courses | With several golf courses nearby, this area attracts golfing enthusiasts and families looking for leisure activities during their stay. | Golf Club, Driving range, Clubhouse amenities, Scenic views |
| Rural Retreats | Offers a peaceful countryside experience, ideal for those looking to escape the city and enjoy nature and tranquility. | Agrotourism farms, Wine tasting, Countryside walks, Local cuisine experiences |
| Cultural Excursions | Close to several historical and cultural sites, making it ideal for those interested in Spanish history and architecture. | Historic villages, Museums, Cultural events, Artisan workshops |
| Adventure Sports | This area is popular for adventure sports, appealing to active travelers seeking thrilling experiences. | Paragliding, Mountain biking, Rock climbing, Water sports |
| Local Cuisine | Known for its exceptional local cuisine and wine, attracting food lovers looking for gastronomic experiences. | Local restaurants, Wine tours, Cooking classes, Tapas experiences |
Understanding Airbnb License Requirements & STR Laws in Sant Cebrià de Vallalta (2025)
Yes, Sant Cebrià de Vallalta, Catalonia, Spain enforces high STR regulations. Obtaining a license and ensuring compliance is almost certainly required according to current 2025 STR laws. Always verify the latest short term rental regulations and Airbnb license requirements directly with local government authorities for Sant Cebrià de Vallalta to ensure full compliance before hosting.
(Source: AirROI data, 2025, based on 70% licensed listings)
Top Performing Airbnb Properties in Sant Cebrià de Vallalta (2025)
Benchmark your potential! Explore examples of top-performing Airbnb properties in Sant Cebrià de Vallaltabased on Trailing Twelve Month (TTM) revenue. Analyze their characteristics, revenue, occupancy rate, and ADR to understand what drives success in this market.
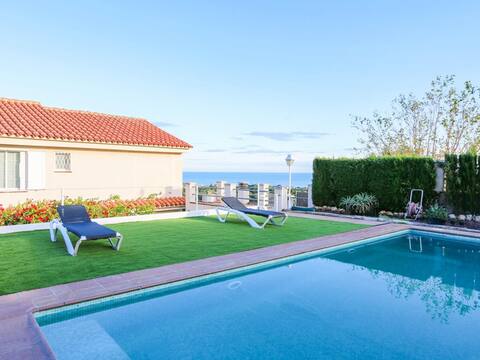
House with a private swimming pool
Entire Place • N/A

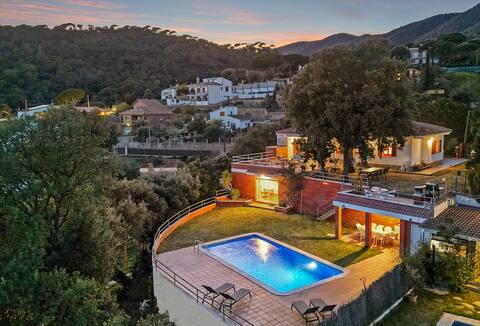
NEW! 16 bed villa with big pool and 3000m2 garden!
Entire Place • 7 bedrooms
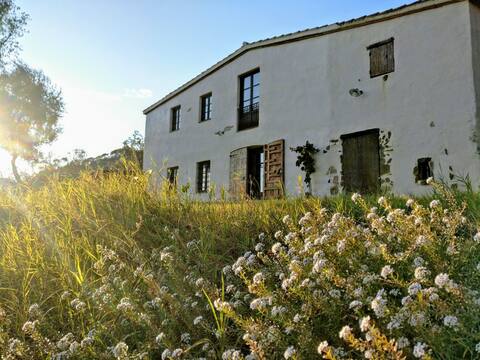
Experience the mountain just 15 minutes from the sea
Entire Place • 3 bedrooms
Casa Mayabel Superb villa: Pool, Garden & terrace
Entire Place • 9 bedrooms
House Roure/4BR/Pool/BBQ/Sea Views/Ping-Pong
Entire Place • 4 bedrooms
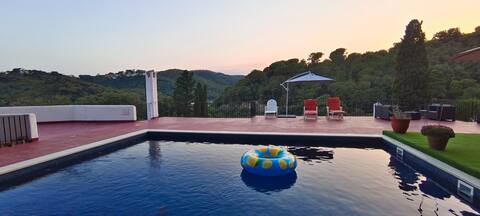
Chalet with magnificent views!
Entire Place • 3 bedrooms
Note: Performance varies based on location, size, amenities, seasonality, and management quality. Data reflects the past 12 months.
Top Performing Airbnb Hosts in Sant Cebrià de Vallalta (2025)
Learn from the best! This table showcases top-performing Airbnb hosts in Sant Cebrià de Vallalta based on the number of properties managed and estimated total revenue over the past year. Analyze their scale and performance metrics.
| Host Name | Properties | Grossing Revenue | Stay Reviews | Avg Rating |
|---|---|---|---|---|
| Mónica | 3 | $212,848 | 7 | 1.61/5.0 |
| Jeroen | 1 | $110,586 | 53 | 4.83/5.0 |
| CatalunyaCasas | 2 | $83,541 | 104 | 4.64/5.0 |
| Jordi | 1 | $71,859 | 59 | 5.00/5.0 |
| Antoine | 1 | $67,552 | 27 | 4.89/5.0 |
| Host #4713091 | 1 | $65,327 | 5 | 4.80/5.0 |
| Samy | 1 | $57,556 | 12 | 5.00/5.0 |
| Anna And Santi | 1 | $53,052 | 79 | 4.99/5.0 |
| Seb | 1 | $52,802 | 122 | 4.76/5.0 |
| Ursi | 1 | $52,294 | 9 | 4.89/5.0 |
Analyzing the strategies of top hosts, such as their property selection, pricing, and guest communication, can offer valuable lessons for optimizing your own Airbnb operations in Sant Cebrià de Vallalta.
Dive Deeper: Advanced Sant Cebrià de Vallalta STR Market Data (2025)
Ready to unlock more insights? AirROI provides access to advanced metrics and comprehensive Airbnb data for Sant Cebrià de Vallalta. Explore detailed analytics beyond this report to refine your investment strategy, optimize pricing, and maximize your vacation rental profits.
Explore Advanced MetricsSant Cebrià de Vallalta Short-Term Rental Market Composition (2025): Property & Room Types
Room Type Distribution
Property Type Distribution
Market Composition Insights for Sant Cebrià de Vallalta
- The Sant Cebrià de Vallalta Airbnb market composition is heavily skewed towards Entire Home/Apt listings, which make up 91.9% of the 37 active rentals. This indicates strong guest preference for privacy and space.
- Looking at the property type distribution in Sant Cebrià de Vallalta, House properties are the most common (94.6%), reflecting the local real estate landscape.
- Houses represent a significant 94.6% portion, catering likely to families or larger groups.
Sant Cebrià de Vallalta Airbnb Room Capacity Analysis (2025): Bedroom Distribution
Distribution of Listings by Number of Bedrooms
Room Capacity Insights for Sant Cebrià de Vallalta
- The dominant room capacity in Sant Cebrià de Vallalta is 3 bedrooms listings, making up 27% of the market. This suggests a strong demand for properties suitable for families or small groups.
- Together, 3 bedrooms and 4 bedrooms properties represent 51.3% of the active Airbnb listings in Sant Cebrià de Vallalta, indicating a high concentration in these sizes.
- A significant 75.6% of listings offer 3+ bedrooms, catering to larger groups and families seeking more space in Sant Cebrià de Vallalta.
Sant Cebrià de Vallalta Vacation Rental Guest Capacity Trends (2025)
Distribution of Listings by Guest Capacity
Guest Capacity Insights for Sant Cebrià de Vallalta
- The most common guest capacity trend in Sant Cebrià de Vallalta vacation rentals is listings accommodating 8+ guests (51.4%). This suggests the primary traveler segment is likely larger groups.
- Properties designed for 8+ guests and 7 guests dominate the Sant Cebrià de Vallalta STR market, accounting for 62.2% of listings.
- 73.0% of properties accommodate 6+ guests, serving the market segment for larger families or group travel in Sant Cebrià de Vallalta.
- On average, properties in Sant Cebrià de Vallalta are equipped to host 6.3 guests.
Sant Cebrià de Vallalta Airbnb Booking Patterns (2025): Available vs. Booked Days
Available Days Distribution
Booked Days Distribution
Booking Pattern Insights for Sant Cebrià de Vallalta
- The most common availability pattern in Sant Cebrià de Vallalta falls within the 271-366 days range, representing 51.4% of listings. This suggests many properties have significant open periods on their calendars.
- Approximately 78.4% of listings show high availability (181+ days open annually), indicating potential for increased bookings or specific owner usage patterns.
- For booked days, the 91-180 days range is most frequent in Sant Cebrià de Vallalta (32.4%), reflecting common guest stay durations or potential owner blocking patterns.
- A notable 21.6% of properties secure long booking periods (181+ days booked per year), highlighting successful long-term rental strategies or significant owner usage.
Sant Cebrià de Vallalta Airbnb Minimum Stay Requirements Analysis
Distribution of Listings by Minimum Night Requirement
1 Night
9 listings
28.1% of total
2 Nights
5 listings
15.6% of total
3 Nights
4 listings
12.5% of total
4-6 Nights
8 listings
25% of total
7-29 Nights
2 listings
6.3% of total
30+ Nights
4 listings
12.5% of total
Key Insights
- The most prevalent minimum stay requirement in Sant Cebrià de Vallalta is 1 Night, adopted by 28.1% of listings. This highlights the market's preference for shorter, flexible bookings.
- A significant segment (12.5%) caters to monthly stays (30+ nights) in Sant Cebrià de Vallalta, pointing to opportunities in the extended-stay market.
Recommendations
- Align with the market by considering a 1 Night minimum stay, as 28.1% of Sant Cebrià de Vallalta hosts use this setting.
- If feasible, allowing 1-night stays, especially midweek or during low season, could capture last-minute bookings, as only 28.1% currently do.
- Explore offering discounts for stays of 30+ nights to attract the 12.5% of the market seeking extended stays.
- Adjust minimum nights based on seasonality – potentially shorter during low season and longer during peak demand periods in Sant Cebrià de Vallalta.
Sant Cebrià de Vallalta Airbnb Cancellation Policy Trends Analysis (2025)
Super Strict 60 Days
3 listings
10% of total
Super Strict 30 Days
1 listings
3.3% of total
Flexible
3 listings
10% of total
Moderate
7 listings
23.3% of total
Firm
6 listings
20% of total
Strict
10 listings
33.3% of total
Cancellation Policy Insights for Sant Cebrià de Vallalta
- The prevailing Airbnb cancellation policy trend in Sant Cebrià de Vallalta is Strict, used by 33.3% of listings.
- A majority (53.3%) of hosts in Sant Cebrià de Vallalta utilize Firm or Strict policies, indicating a market where hosts prioritize booking security.
Recommendations for Hosts
- Consider adopting a Strict policy to align with the 33.3% market standard in Sant Cebrià de Vallalta.
- With 33.3% using Strict terms, this is a viable option in Sant Cebrià de Vallalta, particularly for high-value properties or during peak demand periods.
- Regularly review your cancellation policy against competitors and market demand shifts in Sant Cebrià de Vallalta.
Sant Cebrià de Vallalta STR Booking Lead Time Analysis (2025)
Average Booking Lead Time by Month
Booking Lead Time Insights for Sant Cebrià de Vallalta
- The overall average booking lead time for vacation rentals in Sant Cebrià de Vallalta is 57 days.
- Guests book furthest in advance for stays during July (average 109 days), likely coinciding with peak travel demand or local events.
- The shortest booking windows occur for stays in February (average 22 days), indicating more last-minute travel plans during this time.
- Seasonally, Summer (92 days avg.) sees the longest lead times, while Winter (31 days avg.) has the shortest, reflecting typical travel planning cycles.
Recommendations for Hosts
- Use the overall average lead time (57 days) as a baseline for your pricing and availability strategy in Sant Cebrià de Vallalta.
- For July stays, consider implementing length-of-stay discounts or slightly higher rates for bookings made less than 109 days out to capitalize on advance planning.
- Target marketing efforts for the Summer season well in advance (at least 92 days) to capture early planners.
- Monitor your own booking lead times against these Sant Cebrià de Vallalta averages to identify opportunities for dynamic pricing adjustments.
Popular & Essential Airbnb Amenities in Sant Cebrià de Vallalta (2025)
Amenity Prevalence
Amenity Insights for Sant Cebrià de Vallalta
- Essential amenities in Sant Cebrià de Vallalta that guests expect include: Wifi, Kitchen, Dishes and silverware, Refrigerator, Heating, Coffee maker. Lacking these (any) could significantly impact bookings.
- Popular amenities like Hangers, TV, Hot water are common but not universal. Offering these can provide a competitive edge.
Recommendations for Hosts
- Ensure your listing includes all essential amenities for Sant Cebrià de Vallalta: Wifi, Kitchen, Dishes and silverware, Refrigerator, Heating, Coffee maker.
- Prioritize adding missing essentials: Dishes and silverware, Refrigerator, Heating, Coffee maker.
- Consider adding popular differentiators like Hangers or TV to increase appeal.
- Highlight unique or less common amenities you offer (e.g., hot tub, dedicated workspace, EV charger) in your listing description and photos.
- Regularly check competitor amenities in Sant Cebrià de Vallalta to stay competitive.
Sant Cebrià de Vallalta Airbnb Guest Demographics & Profile Analysis (2025)
Guest Profile Summary for Sant Cebrià de Vallalta
- The typical guest profile for Airbnb in Sant Cebrià de Vallalta consists of predominantly international visitors (81%), with top international origins including Spain, typically belonging to the Post-2000s (Gen Z/Alpha) group (50%), primarily speaking English or Spanish.
- Domestic travelers account for 19.5% of guests.
- Key international markets include France (37.4%) and Spain (19.5%).
- Top languages spoken are English (34%) followed by Spanish (20.7%).
- A significant demographic segment is the Post-2000s (Gen Z/Alpha) group, representing 50% of guests.
Recommendations for Hosts
- Focus marketing internationally, particularly towards travelers from Spain.
- Tailor amenities and listing descriptions to appeal to the dominant Post-2000s (Gen Z/Alpha) demographic (e.g., highlight fast WiFi, smart home features, local guides).
- Highlight unique local experiences or amenities relevant to the primary guest profile.
- Consider seasonal promotions aligned with peak travel times for key origin markets.
Nearby Short-Term Rental Market Comparison
How does the Sant Cebrià de Vallalta Airbnb market stack up against its neighbors? Compare key performance metrics like average monthly revenue, ADR, and occupancy rates in surrounding areas to understand the broader regional STR landscape.
| Market | Active Properties | Monthly Revenue | Daily Rate | Avg. Occupancy |
|---|---|---|---|---|
| Vall-llobrega | 15 | $10,261 | $798.88 | 44% |
| Canyelles | 49 | $5,958 | $1023.94 | 37% |
| Arenys de Munt | 28 | $5,100 | $514.27 | 41% |
| Teià | 25 | $5,027 | $348.45 | 45% |
| Cornellà del Terri | 17 | $4,960 | $460.96 | 41% |
| Tiana | 12 | $4,955 | $299.97 | 48% |
| Amer | 10 | $4,848 | $397.58 | 40% |
| Bescanó | 11 | $4,761 | $445.38 | 41% |
| Porqueres | 12 | $4,714 | $469.05 | 36% |
| Premià de Dalt | 28 | $4,630 | $345.43 | 49% |