Rubí Airbnb Market Analysis 2025: Short Term Rental Data & Vacation Rental Statistics in Catalonia, Spain
Is Airbnb profitable in Rubí in 2025? Explore comprehensive Airbnb analytics for Rubí, Catalonia, Spain to uncover income potential. This 2025 STR market report for Rubí, based on AirROI data from April 2024 to March 2025, reveals key trends in the niche market of 50 active listings.
Whether you're considering an Airbnb investment in Rubí, optimizing your existing vacation rental, or exploring rental arbitrage opportunities, understanding the Rubí Airbnb data is crucial. Navigating the high regulation landscape is key to maximizing your short term rental income potential. Let's dive into the specifics.
Key Rubí Airbnb Performance Metrics Overview
Monthly Airbnb Revenue Variations & Income Potential in Rubí (2025)
Understanding the monthly revenue variations for Airbnb listings in Rubí is key to maximizing your short term rental income potential. Seasonality significantly impacts earnings. Our analysis, based on data from the past 12 months, shows that the peak revenue month for STRs in Rubí is typically April, while November often presents the lowest earnings, highlighting opportunities for strategic pricing adjustments during shoulder and low seasons. Explore the typical Airbnb income in Rubí across different performance tiers:
- Best-in-class properties (Top 10%) achieve $3,929+ monthly, often utilizing dynamic pricing and superior guest experiences.
- Strong performing properties (Top 25%) earn $1,826 or more, indicating effective management and desirable locations/amenities.
- Typical properties (Median) generate around $755 per month, representing the average market performance.
- Entry-level properties (Bottom 25%) see earnings around $470, often with potential for optimization.
Average Monthly Airbnb Earnings Trend in Rubí
Rubí Airbnb Occupancy Rate Trends (2025)
Maximize your bookings by understanding the Rubí STR occupancy trends. Seasonal demand shifts significantly influence how often properties are booked. Typically, Julysees the highest demand (peak season occupancy), while March experiences the lowest (low season). Effective strategies, like adjusting minimum stays or offering promotions, can boost occupancy during slower periods. Here's how different property tiers perform in Rubí:
- Best-in-class properties (Top 10%) achieve 87%+ occupancy, indicating high desirability and potentially optimized availability.
- Strong performing properties (Top 25%) maintain 78% or higher occupancy, suggesting good market fit and guest satisfaction.
- Typical properties (Median) have an occupancy rate around 56%.
- Entry-level properties (Bottom 25%) average 31% occupancy, potentially facing higher vacancy.
Average Monthly Occupancy Rate Trend in Rubí
Average Daily Rate (ADR) Airbnb Trends in Rubí (2025)
Effective short term rental pricing strategy in Rubí involves understanding monthly ADR fluctuations. The Average Daily Rate (ADR) for Airbnb in Rubí typically peaks in December and dips lowest during September. Leveraging Airbnb dynamic pricing tools or strategies based on this seasonality can significantly boost revenue. Here's a look at the typical nightly rates achieved:
- Best-in-class properties (Top 10%) command rates of $192+ per night, often due to premium features or locations.
- Strong performing properties (Top 25%) achieve nightly rates of $87 or more.
- Typical properties (Median) charge around $36 per night.
- Entry-level properties (Bottom 25%) earn around $28 per night.
Average Daily Rate (ADR) Trend by Month in Rubí
Get Live Rubí Market Intelligence 👇

Explore Real-time Analytics
Airbnb Seasonality Analysis & Trends in Rubí (2025)
Peak Season (April, June, May)
- Revenue averages $2,786 per month
- Occupancy rates average 62.3%
- Daily rates average $92
Shoulder Season
- Revenue averages $1,774 per month
- Occupancy maintains around 56.4%
- Daily rates hold near $97
Low Season (January, November, December)
- Revenue drops to average $1,022 per month
- Occupancy decreases to average 42.2%
- Daily rates adjust to average $117
Seasonality Insights for Rubí
- The Airbnb seasonality in Rubí shows highly seasonal trends requiring careful strategy. While the sections above show seasonal averages, it's also insightful to look at the extremes:
- During the high season, the absolute peak month showcases Rubí's highest earning potential, with monthly revenues capable of climbing to $2,843, occupancy reaching a high of 68.5%, and ADRs peaking at $126.
- Conversely, the slowest single month of the year, typically falling within the low season, marks the market's lowest point. In this month, revenue might dip to $829, occupancy could drop to 30.7%, and ADRs may adjust down to $88.
- Understanding both the seasonal averages and these monthly peaks and troughs in revenue, occupancy, and ADR is crucial for maximizing your Airbnb profit potential in Rubí.
Seasonal Strategies for Maximizing Profit
- Peak Season: Maximize revenue through premium pricing and potentially longer minimum stays. Ensure high availability.
- Low Season: Offer competitive pricing, special promotions (e.g., extended stay discounts), and flexible cancellation policies. Target off-season travelers like remote workers or budget-conscious guests.
- Shoulder Seasons: Implement dynamic pricing that balances peak and low rates. Target weekend travelers or specific events. Offer slightly more flexible terms than peak season.
- Regularly analyze your own performance against these Rubí seasonality benchmarks and adjust your pricing and availability strategy accordingly.
Best Areas for Airbnb Investment in Rubí (2025)
Exploring the top neighborhoods for short-term rentals in Rubí? This section highlights key areas, outlining why they are attractive for hosts and guests, along with notable local attractions. Consider these locations based on your target guest profile and investment strategy.
| Neighborhood / Area | Why Host Here? (Target Guests & Appeal) | Key Attractions & Landmarks |
|---|---|---|
| Centro de Rubí | El corazón de Rubí, donde los visitantes pueden disfrutar de tiendas, restaurantes y una rica historia local. Ideal para turistas que buscan comodidad y acceso a transporte público. | Parc de Ca n'Oriac, Teatro La Sala, Mercat Municipal, Museo Municipal de Rubí, Iglesia de Sant Pere |
| Carrer de la Llibertat | Una calle vibrante y animada llena de cafés, bares y tiendas, muy popular entre los jóvenes y los que buscan un ambiente dinámico. | Cafeterías y bares locales, Tiendas de moda, Eventos culturales, Ambiente relajado, Plaza de Rubí |
| Zona de Rubí - Sant Cugat | Áreas cercanas a la conexión entre Rubí y Sant Cugat, ideal para aquellos que trabajan en el área metropolitana de Barcelona, con fácil acceso al transporte público. | Parque Natural de Collserola, Centro comercial de Rubí, Estación de tren de Rubí, Vías verdes, Zonas de senderismo |
| Polígono Industrial Rubí 2000 | Área industrial en crecimiento que también atrae a viajeros de negocios, ideal para alojar a trabajadores temporales o visitantes a la industria. | Empresas tecnológicas, Centros logísticos, Cafés de negocios, Red de transporte |
| Cumbres de Rubí | Una zona residencial tranquila y pintoresca, perfecta para familias que buscan un lugar apacible y cómodo para permanecer. | Parques familiares, Actividades al aire libre, Caminos de montaña, Áreas recreativas |
| Cerca del Parque de la Maquinista | Área cercana al parque que es popular entre los residentes y turistas, ideal para disfrutar de la naturaleza en un entorno urbano. | Parque de la Maquinista, Caminos para bicicletas, Áreas de picnic, Eventos culturales en el parque |
| Centro de Ocio | Una zona que alberga opciones de entretenimiento como cines y boleras, atractiva para grupos de amigos y familias. | Cines, Bolera, Restaurantes, Espacios de entretenimiento |
| Ronda de Rubí | Una vía principal que rodea la ciudad, conectando varios vecindarios y brindando acceso a diferentes partes del municipio y sus alrededores. | Vistas panorámicas, Conexión con otras localidades, Paradas de transporte público |
Understanding Airbnb License Requirements & STR Laws in Rubí (2025)
Yes, Rubí, Catalonia, Spain enforces high STR regulations. Obtaining a license and ensuring compliance is almost certainly required according to current 2025 STR laws. Always verify the latest short term rental regulations and Airbnb license requirements directly with local government authorities for Rubí to ensure full compliance before hosting.
(Source: AirROI data, 2025, based on 74% licensed listings)
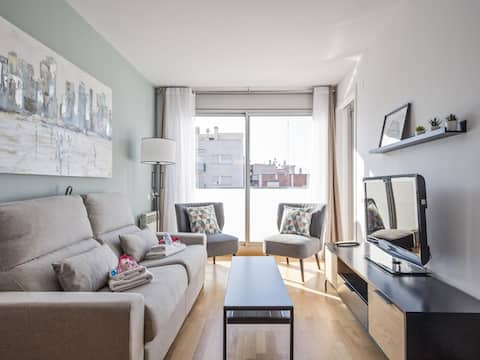
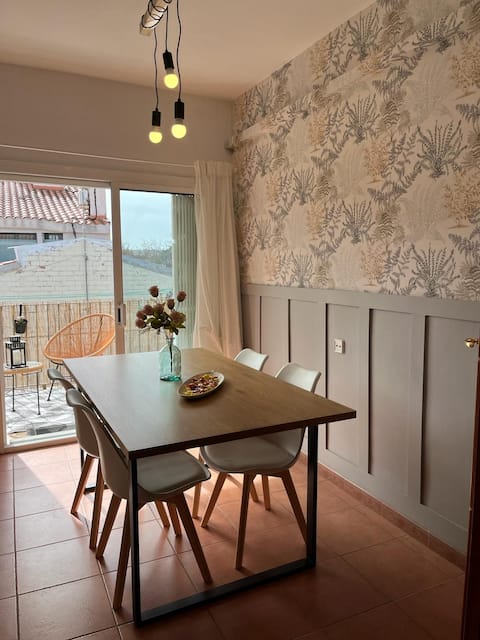
Top Performing Airbnb Properties in Rubí (2025)
Benchmark your potential! Explore examples of top-performing Airbnb properties in Rubíbased on Trailing Twelve Month (TTM) revenue. Analyze their characteristics, revenue, occupancy rate, and ADR to understand what drives success in this market.
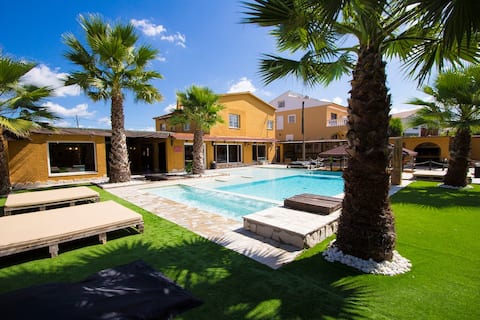
Relax and Recharge - only 34km from Barcelona!
Entire Place • 7 bedrooms

Villa Julia
Entire Place • 4 bedrooms
220. Alcam Rubí Apartment
Entire Place • 3 bedrooms
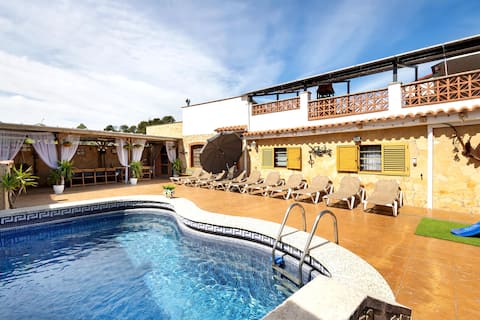
Cal Ramon with pool
Entire Place • 6 bedrooms

Cheerful house with pool and bbq 30min from BCN
Entire Place • 3 bedrooms
Nice downtown apartment. Close to station.
Entire Place • 2 bedrooms
Note: Performance varies based on location, size, amenities, seasonality, and management quality. Data reflects the past 12 months.
Top Performing Airbnb Hosts in Rubí (2025)
Learn from the best! This table showcases top-performing Airbnb hosts in Rubí based on the number of properties managed and estimated total revenue over the past year. Analyze their scale and performance metrics.
| Host Name | Properties | Grossing Revenue | Stay Reviews | Avg Rating |
|---|---|---|---|---|
| CatalunyaCasas | 1 | $195,272 | 38 | 4.45/5.0 |
| Holidu | 1 | $87,117 | 6 | 4.67/5.0 |
| Raul | 15 | $81,676 | 185 | 3.80/5.0 |
| Alcam Apartments | 1 | $59,731 | 20 | 4.40/5.0 |
| Holidu | 1 | $57,019 | 13 | 4.85/5.0 |
| Lourdes | 5 | $45,584 | 138 | 4.48/5.0 |
| Esther | 1 | $36,975 | 59 | 4.81/5.0 |
| Paqui Y Vevi | 1 | $35,042 | 48 | 4.90/5.0 |
| Thiago Navier | 2 | $26,336 | 160 | 4.55/5.0 |
| Jesus | 1 | $24,928 | 80 | 4.93/5.0 |
Analyzing the strategies of top hosts, such as their property selection, pricing, and guest communication, can offer valuable lessons for optimizing your own Airbnb operations in Rubí.
Dive Deeper: Advanced Rubí STR Market Data (2025)
Ready to unlock more insights? AirROI provides access to advanced metrics and comprehensive Airbnb data for Rubí. Explore detailed analytics beyond this report to refine your investment strategy, optimize pricing, and maximize your vacation rental profits.
Explore Advanced MetricsRubí Short-Term Rental Market Composition (2025): Property & Room Types
Room Type Distribution
Property Type Distribution
Market Composition Insights for Rubí
- The Rubí Airbnb market composition is heavily skewed towards Private Room listings, which make up 60% of the 50 active rentals. This indicates strong guest preference for privacy and space.
- Looking at the property type distribution in Rubí, Apartment/Condo properties are the most common (48%), reflecting the local real estate landscape.
- Houses represent a significant 44% portion, catering likely to families or larger groups.
- The presence of 8% Hotel/Boutique listings indicates integration with traditional hospitality.
Rubí Airbnb Room Capacity Analysis (2025): Bedroom Distribution
Distribution of Listings by Number of Bedrooms
Room Capacity Insights for Rubí
- The dominant room capacity in Rubí is 1 bedroom listings, making up 24% of the market. This suggests a strong demand for properties suitable for couples or solo travelers.
- Together, 1 bedroom and 2 bedrooms properties represent 44.0% of the active Airbnb listings in Rubí, indicating a high concentration in these sizes.
Rubí Vacation Rental Guest Capacity Trends (2025)
Distribution of Listings by Guest Capacity
Guest Capacity Insights for Rubí
- The most common guest capacity trend in Rubí vacation rentals is listings accommodating 4 guests (14%). This suggests the primary traveler segment is likely small families or groups.
- Properties designed for 4 guests and 6 guests dominate the Rubí STR market, accounting for 26.0% of listings.
- 20.0% of properties accommodate 6+ guests, serving the market segment for larger families or group travel in Rubí.
- On average, properties in Rubí are equipped to host 2.5 guests.
Rubí Airbnb Booking Patterns (2025): Available vs. Booked Days
Available Days Distribution
Booked Days Distribution
Booking Pattern Insights for Rubí
- The most common availability pattern in Rubí falls within the 181-270 days range, representing 38% of listings. This suggests many properties have significant open periods on their calendars.
- Approximately 56.0% of listings show high availability (181+ days open annually), indicating potential for increased bookings or specific owner usage patterns.
- For booked days, the 91-180 days range is most frequent in Rubí (38%), reflecting common guest stay durations or potential owner blocking patterns.
- A notable 44.0% of properties secure long booking periods (181+ days booked per year), highlighting successful long-term rental strategies or significant owner usage.
Rubí Airbnb Minimum Stay Requirements Analysis
Distribution of Listings by Minimum Night Requirement
1 Night
11 listings
26.2% of total
2 Nights
16 listings
38.1% of total
3 Nights
7 listings
16.7% of total
4-6 Nights
2 listings
4.8% of total
7-29 Nights
1 listings
2.4% of total
30+ Nights
5 listings
11.9% of total
Key Insights
- The most prevalent minimum stay requirement in Rubí is 2 Nights, adopted by 38.1% of listings. This highlights the market's preference for shorter, flexible bookings.
- A strong majority (64.3%) of the Rubí Airbnb data shows acceptance of very short stays (1-2 nights), indicating a dynamic, high-turnover market.
- A significant segment (11.9%) caters to monthly stays (30+ nights) in Rubí, pointing to opportunities in the extended-stay market.
Recommendations
- Align with the market by considering a 2 Nights minimum stay, as 38.1% of Rubí hosts use this setting.
- If feasible, allowing 1-night stays, especially midweek or during low season, could capture last-minute bookings, as only 26.2% currently do.
- Explore offering discounts for stays of 30+ nights to attract the 11.9% of the market seeking extended stays.
- Adjust minimum nights based on seasonality – potentially shorter during low season and longer during peak demand periods in Rubí.
Rubí Airbnb Cancellation Policy Trends Analysis (2025)
Flexible
10 listings
25.6% of total
Moderate
12 listings
30.8% of total
Firm
4 listings
10.3% of total
Strict
13 listings
33.3% of total
Cancellation Policy Insights for Rubí
- The prevailing Airbnb cancellation policy trend in Rubí is Strict, used by 33.3% of listings.
- There's a relatively balanced mix between guest-friendly (56.4%) and stricter (43.6%) policies, offering choices for different guest needs.
Recommendations for Hosts
- Consider adopting a Strict policy to align with the 33.3% market standard in Rubí.
- With 33.3% using Strict terms, this is a viable option in Rubí, particularly for high-value properties or during peak demand periods.
- Regularly review your cancellation policy against competitors and market demand shifts in Rubí.
Rubí STR Booking Lead Time Analysis (2025)
Average Booking Lead Time by Month
Booking Lead Time Insights for Rubí
- The overall average booking lead time for vacation rentals in Rubí is 42 days.
- Guests book furthest in advance for stays during July (average 84 days), likely coinciding with peak travel demand or local events.
- The shortest booking windows occur for stays in November (average 29 days), indicating more last-minute travel plans during this time.
- Seasonally, Summer (74 days avg.) sees the longest lead times, while Winter (38 days avg.) has the shortest, reflecting typical travel planning cycles.
Recommendations for Hosts
- Use the overall average lead time (42 days) as a baseline for your pricing and availability strategy in Rubí.
- For July stays, consider implementing length-of-stay discounts or slightly higher rates for bookings made less than 84 days out to capitalize on advance planning.
- Target marketing efforts for the Summer season well in advance (at least 74 days) to capture early planners.
- Monitor your own booking lead times against these Rubí averages to identify opportunities for dynamic pricing adjustments.
Popular & Essential Airbnb Amenities in Rubí (2025)
Amenity Prevalence
Amenity Insights for Rubí
- Essential amenities in Rubí that guests expect include: Wifi. Lacking these (this) could significantly impact bookings.
- Popular amenities like Kitchen, Washer, Heating are common but not universal. Offering these can provide a competitive edge.
Recommendations for Hosts
- Ensure your listing includes all essential amenities for Rubí: Wifi.
- Prioritize adding missing essentials: Wifi.
- Consider adding popular differentiators like Kitchen or Washer to increase appeal.
- Highlight unique or less common amenities you offer (e.g., hot tub, dedicated workspace, EV charger) in your listing description and photos.
- Regularly check competitor amenities in Rubí to stay competitive.
Rubí Airbnb Guest Demographics & Profile Analysis (2025)
Guest Profile Summary for Rubí
- The typical guest profile for Airbnb in Rubí consists of predominantly international visitors (82%), with top international origins including Spain, typically belonging to the Post-2000s (Gen Z/Alpha) group (50%), primarily speaking English or Spanish.
- Domestic travelers account for 18.5% of guests.
- Key international markets include France (25%) and Spain (18.5%).
- Top languages spoken are English (34%) followed by Spanish (21.4%).
- A significant demographic segment is the Post-2000s (Gen Z/Alpha) group, representing 50% of guests.
Recommendations for Hosts
- Focus marketing internationally, particularly towards travelers from Spain.
- Tailor amenities and listing descriptions to appeal to the dominant Post-2000s (Gen Z/Alpha) demographic (e.g., highlight fast WiFi, smart home features, local guides).
- Highlight unique local experiences or amenities relevant to the primary guest profile.
- Consider seasonal promotions aligned with peak travel times for key origin markets.
Nearby Short-Term Rental Market Comparison
How does the Rubí Airbnb market stack up against its neighbors? Compare key performance metrics like average monthly revenue, ADR, and occupancy rates in surrounding areas to understand the broader regional STR landscape.
| Market | Active Properties | Monthly Revenue | Daily Rate | Avg. Occupancy |
|---|---|---|---|---|
| Vall-llobrega | 15 | $10,261 | $798.88 | 44% |
| Canyelles | 49 | $5,958 | $1023.94 | 37% |
| Arenys de Munt | 28 | $5,100 | $514.27 | 41% |
| Teià | 25 | $5,027 | $348.45 | 45% |
| Cornellà del Terri | 17 | $4,960 | $460.96 | 41% |
| Tiana | 12 | $4,955 | $299.97 | 48% |
| Amer | 10 | $4,848 | $397.58 | 40% |
| Bescanó | 11 | $4,761 | $445.38 | 41% |
| Porqueres | 12 | $4,714 | $469.05 | 36% |
| Premià de Dalt | 28 | $4,630 | $345.43 | 49% |