Ribes de Freser Airbnb Market Analysis 2025: Short Term Rental Data & Vacation Rental Statistics in Catalonia, Spain
Is Airbnb profitable in Ribes de Freser in 2025? Explore comprehensive Airbnb analytics for Ribes de Freser, Catalonia, Spain to uncover income potential. This 2025 STR market report for Ribes de Freser, based on AirROI data from April 2024 to March 2025, reveals key trends in the niche market of 42 active listings.
Whether you're considering an Airbnb investment in Ribes de Freser, optimizing your existing vacation rental, or exploring rental arbitrage opportunities, understanding the Ribes de Freser Airbnb data is crucial. Navigating the high regulation landscape is key to maximizing your short term rental income potential. Let's dive into the specifics.
Key Ribes de Freser Airbnb Performance Metrics Overview
Monthly Airbnb Revenue Variations & Income Potential in Ribes de Freser (2025)
Understanding the monthly revenue variations for Airbnb listings in Ribes de Freser is key to maximizing your short term rental income potential. Seasonality significantly impacts earnings. Our analysis, based on data from the past 12 months, shows that the peak revenue month for STRs in Ribes de Freser is typically August, while March often presents the lowest earnings, highlighting opportunities for strategic pricing adjustments during shoulder and low seasons. Explore the typical Airbnb income in Ribes de Freser across different performance tiers:
- Best-in-class properties (Top 10%) achieve $2,504+ monthly, often utilizing dynamic pricing and superior guest experiences.
- Strong performing properties (Top 25%) earn $1,907 or more, indicating effective management and desirable locations/amenities.
- Typical properties (Median) generate around $1,198 per month, representing the average market performance.
- Entry-level properties (Bottom 25%) see earnings around $643, often with potential for optimization.
Average Monthly Airbnb Earnings Trend in Ribes de Freser
Ribes de Freser Airbnb Occupancy Rate Trends (2025)
Maximize your bookings by understanding the Ribes de Freser STR occupancy trends. Seasonal demand shifts significantly influence how often properties are booked. Typically, Augustsees the highest demand (peak season occupancy), while April experiences the lowest (low season). Effective strategies, like adjusting minimum stays or offering promotions, can boost occupancy during slower periods. Here's how different property tiers perform in Ribes de Freser:
- Best-in-class properties (Top 10%) achieve 58%+ occupancy, indicating high desirability and potentially optimized availability.
- Strong performing properties (Top 25%) maintain 47% or higher occupancy, suggesting good market fit and guest satisfaction.
- Typical properties (Median) have an occupancy rate around 29%.
- Entry-level properties (Bottom 25%) average 17% occupancy, potentially facing higher vacancy.
Average Monthly Occupancy Rate Trend in Ribes de Freser
Average Daily Rate (ADR) Airbnb Trends in Ribes de Freser (2025)
Effective short term rental pricing strategy in Ribes de Freser involves understanding monthly ADR fluctuations. The Average Daily Rate (ADR) for Airbnb in Ribes de Freser typically peaks in August and dips lowest during April. Leveraging Airbnb dynamic pricing tools or strategies based on this seasonality can significantly boost revenue. Here's a look at the typical nightly rates achieved:
- Best-in-class properties (Top 10%) command rates of $240+ per night, often due to premium features or locations.
- Strong performing properties (Top 25%) achieve nightly rates of $149 or more.
- Typical properties (Median) charge around $117 per night.
- Entry-level properties (Bottom 25%) earn around $100 per night.
Average Daily Rate (ADR) Trend by Month in Ribes de Freser
Get Live Ribes de Freser Market Intelligence 👇

Explore Real-time Analytics
Airbnb Seasonality Analysis & Trends in Ribes de Freser (2025)
Peak Season (August, December, July)
- Revenue averages $1,942 per month
- Occupancy rates average 45.6%
- Daily rates average $147
Shoulder Season
- Revenue averages $1,269 per month
- Occupancy maintains around 31.5%
- Daily rates hold near $141
Low Season (January, March, April)
- Revenue drops to average $1,024 per month
- Occupancy decreases to average 23.5%
- Daily rates adjust to average $140
Seasonality Insights for Ribes de Freser
- The Airbnb seasonality in Ribes de Freser shows highly seasonal trends requiring careful strategy. While the sections above show seasonal averages, it's also insightful to look at the extremes:
- During the high season, the absolute peak month showcases Ribes de Freser's highest earning potential, with monthly revenues capable of climbing to $2,637, occupancy reaching a high of 59.5%, and ADRs peaking at $149.
- Conversely, the slowest single month of the year, typically falling within the low season, marks the market's lowest point. In this month, revenue might dip to $956, occupancy could drop to 18.8%, and ADRs may adjust down to $138.
- Understanding both the seasonal averages and these monthly peaks and troughs in revenue, occupancy, and ADR is crucial for maximizing your Airbnb profit potential in Ribes de Freser.
Seasonal Strategies for Maximizing Profit
- Peak Season: Maximize revenue through premium pricing and potentially longer minimum stays. Ensure high availability.
- Low Season: Offer competitive pricing, special promotions (e.g., extended stay discounts), and flexible cancellation policies. Target off-season travelers like remote workers or budget-conscious guests.
- Shoulder Seasons: Implement dynamic pricing that balances peak and low rates. Target weekend travelers or specific events. Offer slightly more flexible terms than peak season.
- Regularly analyze your own performance against these Ribes de Freser seasonality benchmarks and adjust your pricing and availability strategy accordingly.
Best Areas for Airbnb Investment in Ribes de Freser (2025)
Exploring the top neighborhoods for short-term rentals in Ribes de Freser? This section highlights key areas, outlining why they are attractive for hosts and guests, along with notable local attractions. Consider these locations based on your target guest profile and investment strategy.
| Neighborhood / Area | Why Host Here? (Target Guests & Appeal) | Key Attractions & Landmarks |
|---|---|---|
| Ribes de Freser Center | The heart of Ribes de Freser featuring charming streets and easy access to local shops and restaurants. It's an ideal spot for visitors seeking a local cultural experience with convenient amenities. | Castell de Ribes, Plaça del Cerdanya, local restaurants, small boutiques, historical architecture |
| Vall de Ribes | A scenic valley surrounded by mountains, perfect for nature lovers and outdoor enthusiasts. Attracts tourists looking to hike, bike, or simply enjoy the stunning landscapes and fresh air. | Trekking routes, Skiing in winter, Montagne Exploration, Scenic views, Picnic spots |
| Ribes de Freser Railway Station | This area is important for travelers using the scenic train to the Catalan Pyrenees, making it a prime location for temporary stays. Captivates tourists looking for transport convenience to explore further. | Ferrocarrils de la Generalitat de Catalunya, historical train station, access to scenic mountain trips, tourist information center |
| Queralbs | A quaint village nearby famous for its natural surroundings and quaint charm. Ideal for visitors who want a peaceful retreat with access to hiking and cultural activities. | Sant Jaume Church, Historical architecture, Nature trails, Pico de la Fita, Cultural events |
| Berga | Larger town not far from Ribes that offers a range of cultural and recreational activities, making it a good option for travelers looking for more urban amenities in close proximity to nature. | Parc de la Serra de Picancel, Berga Cathedral, local museums, shopping areas, festivals |
| Skiing Resorts | Nearby ski resorts, like La Molina and Masella, attract winter sports enthusiasts looking for seasonal accommodations. Great for short-term rentals during ski season. | Skiing facilities, Winter sports shops, Mountain restaurants, Après-ski activities, Scenic mountain landscapes |
| Natural Park priorat | Located slightly away, this natural park offers amazing hiking trails and is popular among eco-tourism enthusiasts. Ideal for those looking for adventure in nature. | Hiking routes, Flora and fauna richness, Observation spots, Picnic areas, Local wildlife |
| Colonia Vidal | A historical site that tells the story of the industrial past of the area. Tourists interested in history and architecture look for unique stays in authentic locations. | Industrial heritage, Historical buildings, Guided tours available, Cultural experiences, Nature gardens |
Understanding Airbnb License Requirements & STR Laws in Ribes de Freser (2025)
Yes, Ribes de Freser, Catalonia, Spain enforces high STR regulations. Obtaining a license and ensuring compliance is almost certainly required according to current 2025 STR laws. Always verify the latest short term rental regulations and Airbnb license requirements directly with local government authorities for Ribes de Freser to ensure full compliance before hosting.
(Source: AirROI data, 2025, based on 79% licensed listings)
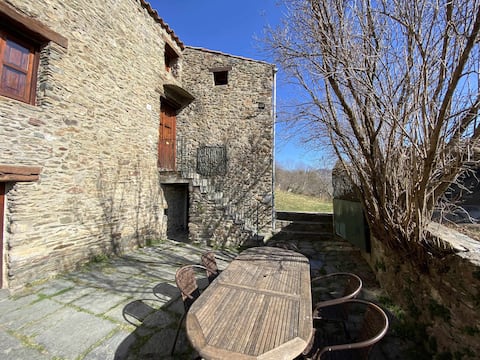
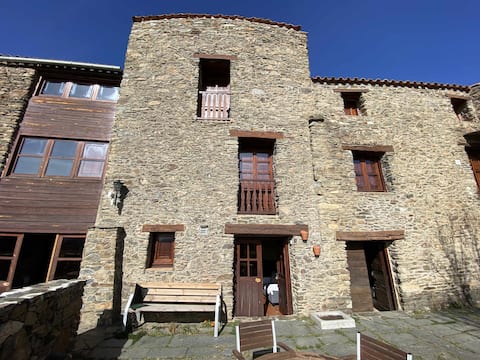
Top Performing Airbnb Properties in Ribes de Freser (2025)
Benchmark your potential! Explore examples of top-performing Airbnb properties in Ribes de Freserbased on Trailing Twelve Month (TTM) revenue. Analyze their characteristics, revenue, occupancy rate, and ADR to understand what drives success in this market.
El Jaç de Can Coderch
Entire Place • 3 bedrooms
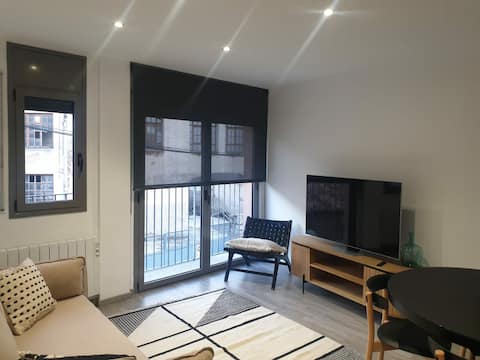
Central Apartment in Ribes de Freser
Entire Place • 2 bedrooms
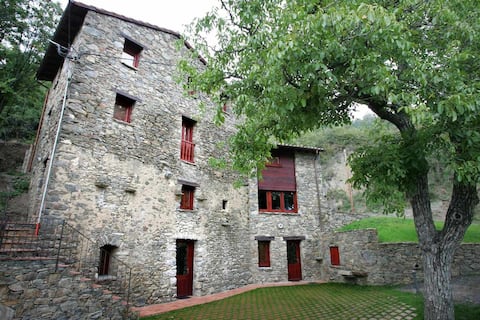
El Trull de El Trull de l 'Agolet
Entire Place • 7 bedrooms
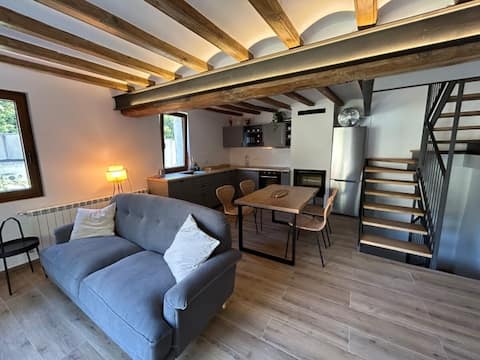
Masia restaurada vora el riu
Entire Place • 2 bedrooms
La Pastera de Can Coderch
Entire Place • 2 bedrooms
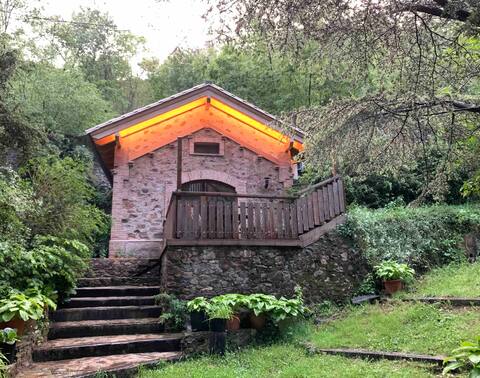
La Cabana del Bosc
Entire Place • 1 bedroom
Note: Performance varies based on location, size, amenities, seasonality, and management quality. Data reflects the past 12 months.
Top Performing Airbnb Hosts in Ribes de Freser (2025)
Learn from the best! This table showcases top-performing Airbnb hosts in Ribes de Freser based on the number of properties managed and estimated total revenue over the past year. Analyze their scale and performance metrics.
| Host Name | Properties | Grossing Revenue | Stay Reviews | Avg Rating |
|---|---|---|---|---|
| Nina | 5 | $114,821 | 223 | 4.63/5.0 |
| El Molí De Ribes S.L.U | 4 | $66,398 | 254 | 4.81/5.0 |
| Gemma | 4 | $60,560 | 65 | 4.73/5.0 |
| Albert | 3 | $35,641 | 99 | 4.85/5.0 |
| David | 3 | $28,697 | 51 | 4.88/5.0 |
| Carles | 1 | $24,581 | 30 | 4.93/5.0 |
| Gemma | 3 | $21,630 | 87 | 4.81/5.0 |
| Jordi | 1 | $21,084 | 29 | 5.00/5.0 |
| Ramon | 1 | $21,017 | 35 | 4.86/5.0 |
| Josep Maria | 2 | $20,992 | 3 | 2.50/5.0 |
Analyzing the strategies of top hosts, such as their property selection, pricing, and guest communication, can offer valuable lessons for optimizing your own Airbnb operations in Ribes de Freser.
Dive Deeper: Advanced Ribes de Freser STR Market Data (2025)
Ready to unlock more insights? AirROI provides access to advanced metrics and comprehensive Airbnb data for Ribes de Freser. Explore detailed analytics beyond this report to refine your investment strategy, optimize pricing, and maximize your vacation rental profits.
Explore Advanced MetricsRibes de Freser Short-Term Rental Market Composition (2025): Property & Room Types
Room Type Distribution
Property Type Distribution
Market Composition Insights for Ribes de Freser
- The Ribes de Freser Airbnb market composition is heavily skewed towards Entire Home/Apt listings, which make up 92.9% of the 42 active rentals. This indicates strong guest preference for privacy and space.
- Looking at the property type distribution in Ribes de Freser, Apartment/Condo properties are the most common (69%), reflecting the local real estate landscape.
- Houses represent a significant 26.2% portion, catering likely to families or larger groups.
- Smaller segments like outdoor/unique, others (combined 4.8%) offer potential for unique stay experiences.
Ribes de Freser Airbnb Room Capacity Analysis (2025): Bedroom Distribution
Distribution of Listings by Number of Bedrooms
Room Capacity Insights for Ribes de Freser
- The dominant room capacity in Ribes de Freser is 2 bedrooms listings, making up 35.7% of the market. This suggests a strong demand for properties suitable for couples or solo travelers.
- Together, 2 bedrooms and 3 bedrooms properties represent 64.3% of the active Airbnb listings in Ribes de Freser, indicating a high concentration in these sizes.
- A significant 35.8% of listings offer 3+ bedrooms, catering to larger groups and families seeking more space in Ribes de Freser.
Ribes de Freser Vacation Rental Guest Capacity Trends (2025)
Distribution of Listings by Guest Capacity
Guest Capacity Insights for Ribes de Freser
- The most common guest capacity trend in Ribes de Freser vacation rentals is listings accommodating 4 guests (23.8%). This suggests the primary traveler segment is likely small families or groups.
- Properties designed for 4 guests and 5 guests dominate the Ribes de Freser STR market, accounting for 45.2% of listings.
- 31.0% of properties accommodate 6+ guests, serving the market segment for larger families or group travel in Ribes de Freser.
- On average, properties in Ribes de Freser are equipped to host 4.6 guests.
Ribes de Freser Airbnb Booking Patterns (2025): Available vs. Booked Days
Available Days Distribution
Booked Days Distribution
Booking Pattern Insights for Ribes de Freser
- The most common availability pattern in Ribes de Freser falls within the 271-366 days range, representing 47.6% of listings. This suggests many properties have significant open periods on their calendars.
- Approximately 83.3% of listings show high availability (181+ days open annually), indicating potential for increased bookings or specific owner usage patterns.
- For booked days, the 91-180 days range is most frequent in Ribes de Freser (38.1%), reflecting common guest stay durations or potential owner blocking patterns.
- A notable 16.7% of properties secure long booking periods (181+ days booked per year), highlighting successful long-term rental strategies or significant owner usage.
Ribes de Freser Airbnb Minimum Stay Requirements Analysis
Distribution of Listings by Minimum Night Requirement
1 Night
6 listings
14.3% of total
2 Nights
25 listings
59.5% of total
7-29 Nights
1 listings
2.4% of total
30+ Nights
10 listings
23.8% of total
Key Insights
- The most prevalent minimum stay requirement in Ribes de Freser is 2 Nights, adopted by 59.5% of listings. This highlights the market's preference for shorter, flexible bookings.
- A strong majority (73.8%) of the Ribes de Freser Airbnb data shows acceptance of very short stays (1-2 nights), indicating a dynamic, high-turnover market.
- A significant segment (23.8%) caters to monthly stays (30+ nights) in Ribes de Freser, pointing to opportunities in the extended-stay market.
Recommendations
- Align with the market by considering a 2 Nights minimum stay, as 59.5% of Ribes de Freser hosts use this setting.
- If feasible, allowing 1-night stays, especially midweek or during low season, could capture last-minute bookings, as only 14.3% currently do.
- A 2-night minimum appears standard (59.5%). Consider this for weekends or peak periods.
- Explore offering discounts for stays of 30+ nights to attract the 23.8% of the market seeking extended stays.
- Adjust minimum nights based on seasonality – potentially shorter during low season and longer during peak demand periods in Ribes de Freser.
Ribes de Freser Airbnb Cancellation Policy Trends Analysis (2025)
Flexible
11 listings
28.9% of total
Moderate
14 listings
36.8% of total
Firm
4 listings
10.5% of total
Strict
9 listings
23.7% of total
Cancellation Policy Insights for Ribes de Freser
- The prevailing Airbnb cancellation policy trend in Ribes de Freser is Moderate, used by 36.8% of listings.
- There's a relatively balanced mix between guest-friendly (65.7%) and stricter (34.2%) policies, offering choices for different guest needs.
Recommendations for Hosts
- Consider adopting a Moderate policy to align with the 36.8% market standard in Ribes de Freser.
- Regularly review your cancellation policy against competitors and market demand shifts in Ribes de Freser.
Ribes de Freser STR Booking Lead Time Analysis (2025)
Average Booking Lead Time by Month
Booking Lead Time Insights for Ribes de Freser
- The overall average booking lead time for vacation rentals in Ribes de Freser is 40 days.
- Guests book furthest in advance for stays during August (average 72 days), likely coinciding with peak travel demand or local events.
- The shortest booking windows occur for stays in May (average 28 days), indicating more last-minute travel plans during this time.
- Seasonally, Summer (62 days avg.) sees the longest lead times, while Fall (36 days avg.) has the shortest, reflecting typical travel planning cycles.
Recommendations for Hosts
- Use the overall average lead time (40 days) as a baseline for your pricing and availability strategy in Ribes de Freser.
- For August stays, consider implementing length-of-stay discounts or slightly higher rates for bookings made less than 72 days out to capitalize on advance planning.
- Target marketing efforts for the Summer season well in advance (at least 62 days) to capture early planners.
- Monitor your own booking lead times against these Ribes de Freser averages to identify opportunities for dynamic pricing adjustments.
Popular & Essential Airbnb Amenities in Ribes de Freser (2025)
Amenity Prevalence
Amenity Insights for Ribes de Freser
- Essential amenities in Ribes de Freser that guests expect include: Heating, Essentials. Lacking these (any) could significantly impact bookings.
- Popular amenities like Kitchen, TV, Hot water are common but not universal. Offering these can provide a competitive edge.
- Warning: Wifi is not universally provided but is considered essential globally. Ensure reliable Wifi is offered.
Recommendations for Hosts
- Ensure your listing includes all essential amenities for Ribes de Freser: Heating, Essentials.
- Prioritize adding missing essentials: Essentials.
- Consider adding popular differentiators like Kitchen or TV to increase appeal.
- Highlight unique or less common amenities you offer (e.g., hot tub, dedicated workspace, EV charger) in your listing description and photos.
- Regularly check competitor amenities in Ribes de Freser to stay competitive.
Ribes de Freser Airbnb Guest Demographics & Profile Analysis (2025)
Guest Profile Summary for Ribes de Freser
- The typical guest profile for Airbnb in Ribes de Freser consists of primarily domestic travelers (73%), often arriving from nearby Barcelona, typically belonging to the Post-2000s (Gen Z/Alpha) group (50%), primarily speaking English or Spanish.
- Domestic travelers account for 72.6% of guests.
- Key international markets include Spain (72.6%) and United Kingdom (4.2%).
- Top languages spoken are English (31.4%) followed by Spanish (30.4%).
- A significant demographic segment is the Post-2000s (Gen Z/Alpha) group, representing 50% of guests.
Recommendations for Hosts
- Target domestic marketing efforts towards travelers from Barcelona and Terrassa.
- Tailor amenities and listing descriptions to appeal to the dominant Post-2000s (Gen Z/Alpha) demographic (e.g., highlight fast WiFi, smart home features, local guides).
- Highlight unique local experiences or amenities relevant to the primary guest profile.
- Consider seasonal promotions aligned with peak travel times for key origin markets.
Nearby Short-Term Rental Market Comparison
How does the Ribes de Freser Airbnb market stack up against its neighbors? Compare key performance metrics like average monthly revenue, ADR, and occupancy rates in surrounding areas to understand the broader regional STR landscape.
| Market | Active Properties | Monthly Revenue | Daily Rate | Avg. Occupancy |
|---|---|---|---|---|
| Vall-llobrega | 15 | $10,261 | $798.88 | 44% |
| Canyelles | 49 | $5,958 | $1023.94 | 37% |
| Arenys de Munt | 28 | $5,100 | $514.27 | 41% |
| Teià | 25 | $5,027 | $348.45 | 45% |
| Cornellà del Terri | 17 | $4,960 | $460.96 | 41% |
| Tiana | 12 | $4,955 | $299.97 | 48% |
| Amer | 10 | $4,848 | $397.58 | 40% |
| Bescanó | 11 | $4,761 | $445.38 | 41% |
| Porqueres | 12 | $4,714 | $469.05 | 36% |
| Premià de Dalt | 28 | $4,630 | $345.43 | 49% |