Peralada Airbnb Market Analysis 2025: Short Term Rental Data & Vacation Rental Statistics in Catalonia, Spain
Is Airbnb profitable in Peralada in 2025? Explore comprehensive Airbnb analytics for Peralada, Catalonia, Spain to uncover income potential. This 2025 STR market report for Peralada, based on AirROI data from April 2024 to March 2025, reveals key trends in the niche market of 20 active listings.
Whether you're considering an Airbnb investment in Peralada, optimizing your existing vacation rental, or exploring rental arbitrage opportunities, understanding the Peralada Airbnb data is crucial. Navigating the high regulation landscape is key to maximizing your short term rental income potential. Let's dive into the specifics.
Key Peralada Airbnb Performance Metrics Overview
Monthly Airbnb Revenue Variations & Income Potential in Peralada (2025)
Understanding the monthly revenue variations for Airbnb listings in Peralada is key to maximizing your short term rental income potential. Seasonality significantly impacts earnings. Our analysis, based on data from the past 12 months, shows that the peak revenue month for STRs in Peralada is typically August, while February often presents the lowest earnings, highlighting opportunities for strategic pricing adjustments during shoulder and low seasons. Explore the typical Airbnb income in Peralada across different performance tiers:
- Best-in-class properties (Top 10%) achieve $6,736+ monthly, often utilizing dynamic pricing and superior guest experiences.
- Strong performing properties (Top 25%) earn $3,330 or more, indicating effective management and desirable locations/amenities.
- Typical properties (Median) generate around $1,705 per month, representing the average market performance.
- Entry-level properties (Bottom 25%) see earnings around $1,000, often with potential for optimization.
Average Monthly Airbnb Earnings Trend in Peralada
Peralada Airbnb Occupancy Rate Trends (2025)
Maximize your bookings by understanding the Peralada STR occupancy trends. Seasonal demand shifts significantly influence how often properties are booked. Typically, Augustsees the highest demand (peak season occupancy), while February experiences the lowest (low season). Effective strategies, like adjusting minimum stays or offering promotions, can boost occupancy during slower periods. Here's how different property tiers perform in Peralada:
- Best-in-class properties (Top 10%) achieve 63%+ occupancy, indicating high desirability and potentially optimized availability.
- Strong performing properties (Top 25%) maintain 44% or higher occupancy, suggesting good market fit and guest satisfaction.
- Typical properties (Median) have an occupancy rate around 29%.
- Entry-level properties (Bottom 25%) average 14% occupancy, potentially facing higher vacancy.
Average Monthly Occupancy Rate Trend in Peralada
Average Daily Rate (ADR) Airbnb Trends in Peralada (2025)
Effective short term rental pricing strategy in Peralada involves understanding monthly ADR fluctuations. The Average Daily Rate (ADR) for Airbnb in Peralada typically peaks in July and dips lowest during March. Leveraging Airbnb dynamic pricing tools or strategies based on this seasonality can significantly boost revenue. Here's a look at the typical nightly rates achieved:
- Best-in-class properties (Top 10%) command rates of $523+ per night, often due to premium features or locations.
- Strong performing properties (Top 25%) achieve nightly rates of $391 or more.
- Typical properties (Median) charge around $234 per night.
- Entry-level properties (Bottom 25%) earn around $113 per night.
Average Daily Rate (ADR) Trend by Month in Peralada
Get Live Peralada Market Intelligence 👇

Explore Real-time Analytics
Airbnb Seasonality Analysis & Trends in Peralada (2025)
Peak Season (August, July, May)
- Revenue averages $4,225 per month
- Occupancy rates average 48.2%
- Daily rates average $339
Shoulder Season
- Revenue averages $2,179 per month
- Occupancy maintains around 28.5%
- Daily rates hold near $302
Low Season (February, March, December)
- Revenue drops to average $1,543 per month
- Occupancy decreases to average 22.8%
- Daily rates adjust to average $255
Seasonality Insights for Peralada
- The Airbnb seasonality in Peralada shows highly seasonal trends requiring careful strategy. While the sections above show seasonal averages, it's also insightful to look at the extremes:
- During the high season, the absolute peak month showcases Peralada's highest earning potential, with monthly revenues capable of climbing to $5,440, occupancy reaching a high of 65.2%, and ADRs peaking at $345.
- Conversely, the slowest single month of the year, typically falling within the low season, marks the market's lowest point. In this month, revenue might dip to $1,343, occupancy could drop to 21.0%, and ADRs may adjust down to $254.
- Understanding both the seasonal averages and these monthly peaks and troughs in revenue, occupancy, and ADR is crucial for maximizing your Airbnb profit potential in Peralada.
Seasonal Strategies for Maximizing Profit
- Peak Season: Maximize revenue through premium pricing and potentially longer minimum stays. Ensure high availability.
- Low Season: Offer competitive pricing, special promotions (e.g., extended stay discounts), and flexible cancellation policies. Target off-season travelers like remote workers or budget-conscious guests.
- Shoulder Seasons: Implement dynamic pricing that balances peak and low rates. Target weekend travelers or specific events. Offer slightly more flexible terms than peak season.
- Regularly analyze your own performance against these Peralada seasonality benchmarks and adjust your pricing and availability strategy accordingly.
Best Areas for Airbnb Investment in Peralada (2025)
Exploring the top neighborhoods for short-term rentals in Peralada? This section highlights key areas, outlining why they are attractive for hosts and guests, along with notable local attractions. Consider these locations based on your target guest profile and investment strategy.
| Neighborhood / Area | Why Host Here? (Target Guests & Appeal) | Key Attractions & Landmarks |
|---|---|---|
| Peralada Castle Area | Historic region surrounding the majestic Peralada Castle, attracting tourists interested in medieval history and architecture. High appeal during summer events and local festivals. | Peralada Castle, Peralada Wine Museum, Summer Festival, Golf Club Peralada, Cultural events in the castle |
| La Jonquera | A neighboring area known for shopping and border tourism, appealing to visitors looking for deals and diverse shopping experiences, especially on weekends. | Shopping centers, Restaurants, Local markets, Cultural events |
| Castelló d'Empúries | Nearby historical town with charming architecture and rich history. Ideal for tourists seeking a quieter, more authentic Catalan experience. | Historical buildings, Museum of Medieval History, Charming streets and squares |
| Empuriabrava | Famous for its canals and as a water sports destination, this area attracts families and water enthusiasts during the summer. | Canal tours, Jet skiing, Marina, Beaches |
| Roses | Coastal town known for its beaches and vibrant nightlife. A popular destination for sun-seekers and party-goers, especially in the summer. | Beaches, Nightclubs, Cultural events, Water activities |
| Figueres | Home to the Dalí Theatre-Museum, this town draws art and culture lovers, making it a strategic location for visitors to Peralada. | Dalí Theatre-Museum, Figueres Castle, Local shops and eateries |
| Cabo de Creus National Park | A stunning natural park that attracts nature lovers and hikers. Great for guests seeking outdoor activities and beautiful landscapes. | Hiking trails, Scenic views, Biodiversity, Beaches |
| Santa Margarita | A family-friendly beach area with a variety of amenities. Popular for vacationers seeking relaxation and family activities. | Beaches, Water sports, Family-friendly restaurants |
Understanding Airbnb License Requirements & STR Laws in Peralada (2025)
Yes, Peralada, Catalonia, Spain enforces high STR regulations. Obtaining a license and ensuring compliance is almost certainly required according to current 2025 STR laws. Always verify the latest short term rental regulations and Airbnb license requirements directly with local government authorities for Peralada to ensure full compliance before hosting.
(Source: AirROI data, 2025, based on 80% licensed listings)
Top Performing Airbnb Properties in Peralada (2025)
Benchmark your potential! Explore examples of top-performing Airbnb properties in Peraladabased on Trailing Twelve Month (TTM) revenue. Analyze their characteristics, revenue, occupancy rate, and ADR to understand what drives success in this market.
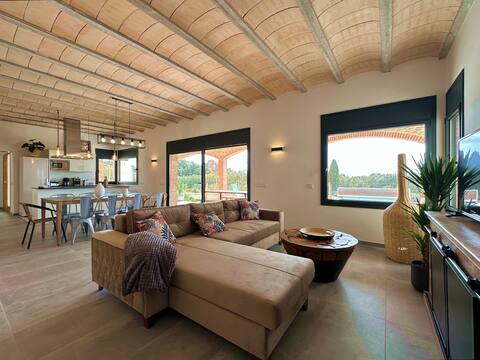
The Private Accommodation Villa
Entire Place • 4 bedrooms
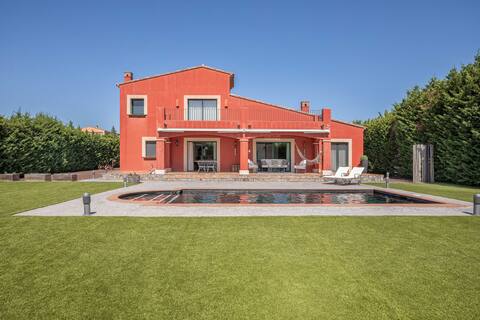
Wonderful villa with a pool near the Golf *G*
Entire Place • 4 bedrooms
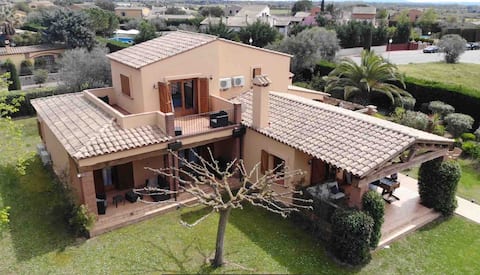
Villa standing avec piscine privée chauffée
Entire Place • 4 bedrooms
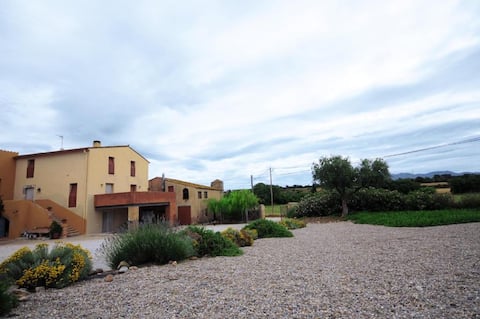
Can Gori, rural tourism
Entire Place • 5 bedrooms
Beautiful villa with swimming pool and Peralada Golf Spa
Entire Place • 4 bedrooms

Luxury Villa In Golf Course- 8 km from the beach
Entire Place • 4 bedrooms
Note: Performance varies based on location, size, amenities, seasonality, and management quality. Data reflects the past 12 months.
Top Performing Airbnb Hosts in Peralada (2025)
Learn from the best! This table showcases top-performing Airbnb hosts in Peralada based on the number of properties managed and estimated total revenue over the past year. Analyze their scale and performance metrics.
| Host Name | Properties | Grossing Revenue | Stay Reviews | Avg Rating |
|---|---|---|---|---|
| Host #97889805 | 1 | $58,336 | 0 | 0.00/5.0 |
| Casa Costat Muralla | 2 | $38,852 | 15 | 4.89/5.0 |
| Flateli | 1 | $36,460 | 3 | 3.67/5.0 |
| Host #318721774 | 1 | $33,897 | 18 | 4.78/5.0 |
| Can Gori | 1 | $33,148 | 23 | 4.91/5.0 |
| Chantal | 1 | $26,114 | 3 | 5.00/5.0 |
| Marta | 1 | $20,099 | 3 | 5.00/5.0 |
| Miguel | 1 | $18,337 | 16 | 5.00/5.0 |
| Carme | 1 | $17,377 | 55 | 4.80/5.0 |
| Celine | 1 | $16,446 | 45 | 4.93/5.0 |
Analyzing the strategies of top hosts, such as their property selection, pricing, and guest communication, can offer valuable lessons for optimizing your own Airbnb operations in Peralada.
Dive Deeper: Advanced Peralada STR Market Data (2025)
Ready to unlock more insights? AirROI provides access to advanced metrics and comprehensive Airbnb data for Peralada. Explore detailed analytics beyond this report to refine your investment strategy, optimize pricing, and maximize your vacation rental profits.
Explore Advanced MetricsPeralada Short-Term Rental Market Composition (2025): Property & Room Types
Room Type Distribution
Property Type Distribution
Market Composition Insights for Peralada
- The Peralada Airbnb market composition is heavily skewed towards Entire Home/Apt listings, which make up 80% of the 20 active rentals. This indicates strong guest preference for privacy and space.
- Looking at the property type distribution in Peralada, House properties are the most common (60%), reflecting the local real estate landscape.
- Houses represent a significant 60% portion, catering likely to families or larger groups.
- The presence of 20% Hotel/Boutique listings indicates integration with traditional hospitality.
Peralada Airbnb Room Capacity Analysis (2025): Bedroom Distribution
Distribution of Listings by Number of Bedrooms
Room Capacity Insights for Peralada
- The dominant room capacity in Peralada is 4 bedrooms listings, making up 45% of the market. This suggests a strong demand for properties suitable for families or small groups.
- Together, 4 bedrooms and 3 bedrooms properties represent 55.0% of the active Airbnb listings in Peralada, indicating a high concentration in these sizes.
- A significant 60.0% of listings offer 3+ bedrooms, catering to larger groups and families seeking more space in Peralada.
Peralada Vacation Rental Guest Capacity Trends (2025)
Distribution of Listings by Guest Capacity
Guest Capacity Insights for Peralada
- The most common guest capacity trend in Peralada vacation rentals is listings accommodating 8+ guests (40%). This suggests the primary traveler segment is likely larger groups.
- Properties designed for 8+ guests and 4 guests dominate the Peralada STR market, accounting for 60.0% of listings.
- 50.0% of properties accommodate 6+ guests, serving the market segment for larger families or group travel in Peralada.
- On average, properties in Peralada are equipped to host 5.0 guests.
Peralada Airbnb Booking Patterns (2025): Available vs. Booked Days
Available Days Distribution
Booked Days Distribution
Booking Pattern Insights for Peralada
- The most common availability pattern in Peralada falls within the 271-366 days range, representing 55% of listings. This suggests many properties have significant open periods on their calendars.
- Approximately 95.0% of listings show high availability (181+ days open annually), indicating potential for increased bookings or specific owner usage patterns.
- For booked days, the 91-180 days range is most frequent in Peralada (40%), reflecting common guest stay durations or potential owner blocking patterns.
- A notable 5.0% of properties secure long booking periods (181+ days booked per year), highlighting successful long-term rental strategies or significant owner usage.
Peralada Airbnb Minimum Stay Requirements Analysis
Distribution of Listings by Minimum Night Requirement
1 Night
6 listings
33.3% of total
2 Nights
5 listings
27.8% of total
3 Nights
1 listings
5.6% of total
4-6 Nights
1 listings
5.6% of total
7-29 Nights
3 listings
16.7% of total
30+ Nights
2 listings
11.1% of total
Key Insights
- The most prevalent minimum stay requirement in Peralada is 1 Night, adopted by 33.3% of listings. This highlights the market's preference for shorter, flexible bookings.
- A strong majority (61.1%) of the Peralada Airbnb data shows acceptance of very short stays (1-2 nights), indicating a dynamic, high-turnover market.
- A significant segment (11.1%) caters to monthly stays (30+ nights) in Peralada, pointing to opportunities in the extended-stay market.
Recommendations
- Align with the market by considering a 1 Night minimum stay, as 33.3% of Peralada hosts use this setting.
- Explore offering discounts for stays of 30+ nights to attract the 11.1% of the market seeking extended stays.
- Adjust minimum nights based on seasonality – potentially shorter during low season and longer during peak demand periods in Peralada.
Peralada Airbnb Cancellation Policy Trends Analysis (2025)
Flexible
3 listings
16.7% of total
Moderate
3 listings
16.7% of total
Firm
8 listings
44.4% of total
Strict
4 listings
22.2% of total
Cancellation Policy Insights for Peralada
- The prevailing Airbnb cancellation policy trend in Peralada is Firm, used by 44.4% of listings.
- A majority (66.6%) of hosts in Peralada utilize Firm or Strict policies, indicating a market where hosts prioritize booking security.
Recommendations for Hosts
- Consider adopting a Firm policy to align with the 44.4% market standard in Peralada.
- Regularly review your cancellation policy against competitors and market demand shifts in Peralada.
Peralada STR Booking Lead Time Analysis (2025)
Average Booking Lead Time by Month
Booking Lead Time Insights for Peralada
- The overall average booking lead time for vacation rentals in Peralada is 61 days.
- Guests book furthest in advance for stays during June (average 115 days), likely coinciding with peak travel demand or local events.
- The shortest booking windows occur for stays in March (average 15 days), indicating more last-minute travel plans during this time.
- Seasonally, Summer (105 days avg.) sees the longest lead times, while Spring (44 days avg.) has the shortest, reflecting typical travel planning cycles.
Recommendations for Hosts
- Use the overall average lead time (61 days) as a baseline for your pricing and availability strategy in Peralada.
- For June stays, consider implementing length-of-stay discounts or slightly higher rates for bookings made less than 115 days out to capitalize on advance planning.
- Target marketing efforts for the Summer season well in advance (at least 105 days) to capture early planners.
- Monitor your own booking lead times against these Peralada averages to identify opportunities for dynamic pricing adjustments.
Popular & Essential Airbnb Amenities in Peralada (2025)
Amenity Prevalence
Amenity Insights for Peralada
- Essential amenities in Peralada that guests expect include: Hot water. Lacking these (this) could significantly impact bookings.
- Popular amenities like Dishes and silverware, Air conditioning, Heating are common but not universal. Offering these can provide a competitive edge.
- Warning: Wifi is not universally provided but is considered essential globally. Ensure reliable Wifi is offered.
Recommendations for Hosts
- Ensure your listing includes all essential amenities for Peralada: Hot water.
- Consider adding popular differentiators like Dishes and silverware or Air conditioning to increase appeal.
- Highlight unique or less common amenities you offer (e.g., hot tub, dedicated workspace, EV charger) in your listing description and photos.
- Regularly check competitor amenities in Peralada to stay competitive.
Peralada Airbnb Guest Demographics & Profile Analysis (2025)
Guest Profile Summary for Peralada
- The typical guest profile for Airbnb in Peralada consists of predominantly international visitors (66%), with top international origins including France, typically belonging to the Post-2000s (Gen Z/Alpha) group (50%), primarily speaking English or Spanish.
- Domestic travelers account for 34.3% of guests.
- Key international markets include Spain (34.3%) and France (32.9%).
- Top languages spoken are English (32.9%) followed by Spanish (21.5%).
- A significant demographic segment is the Post-2000s (Gen Z/Alpha) group, representing 50% of guests.
Recommendations for Hosts
- Focus marketing internationally, particularly towards travelers from France.
- Tailor amenities and listing descriptions to appeal to the dominant Post-2000s (Gen Z/Alpha) demographic (e.g., highlight fast WiFi, smart home features, local guides).
- Highlight unique local experiences or amenities relevant to the primary guest profile.
- Consider seasonal promotions aligned with peak travel times for key origin markets.
Nearby Short-Term Rental Market Comparison
How does the Peralada Airbnb market stack up against its neighbors? Compare key performance metrics like average monthly revenue, ADR, and occupancy rates in surrounding areas to understand the broader regional STR landscape.
| Market | Active Properties | Monthly Revenue | Daily Rate | Avg. Occupancy |
|---|---|---|---|---|
| Vall-llobrega | 15 | $10,261 | $798.88 | 44% |
| Arenys de Munt | 28 | $5,100 | $514.27 | 41% |
| Teià | 25 | $5,027 | $348.45 | 45% |
| Cornellà del Terri | 17 | $4,960 | $460.96 | 41% |
| Tiana | 12 | $4,955 | $299.97 | 48% |
| Amer | 10 | $4,848 | $397.58 | 40% |
| Bescanó | 11 | $4,761 | $445.38 | 41% |
| Porqueres | 12 | $4,714 | $469.05 | 36% |
| Premià de Dalt | 28 | $4,630 | $345.43 | 49% |
| Cabrils | 53 | $4,474 | $436.58 | 48% |