Pau Airbnb Market Analysis 2025: Short Term Rental Data & Vacation Rental Statistics in Catalonia, Spain
Is Airbnb profitable in Pau in 2025? Explore comprehensive Airbnb analytics for Pau, Catalonia, Spain to uncover income potential. This 2025 STR market report for Pau, based on AirROI data from April 2024 to March 2025, reveals key trends in the niche market of 19 active listings.
Whether you're considering an Airbnb investment in Pau, optimizing your existing vacation rental, or exploring rental arbitrage opportunities, understanding the Pau Airbnb data is crucial. Navigating the high regulation landscape is key to maximizing your short term rental income potential. Let's dive into the specifics.
Key Pau Airbnb Performance Metrics Overview
Monthly Airbnb Revenue Variations & Income Potential in Pau (2025)
Understanding the monthly revenue variations for Airbnb listings in Pau is key to maximizing your short term rental income potential. Seasonality significantly impacts earnings. Our analysis, based on data from the past 12 months, shows that the peak revenue month for STRs in Pau is typically August, while February often presents the lowest earnings, highlighting opportunities for strategic pricing adjustments during shoulder and low seasons. Explore the typical Airbnb income in Pau across different performance tiers:
- Best-in-class properties (Top 10%) achieve $2,838+ monthly, often utilizing dynamic pricing and superior guest experiences.
- Strong performing properties (Top 25%) earn $1,407 or more, indicating effective management and desirable locations/amenities.
- Typical properties (Median) generate around $896 per month, representing the average market performance.
- Entry-level properties (Bottom 25%) see earnings around $530, often with potential for optimization.
Average Monthly Airbnb Earnings Trend in Pau
Pau Airbnb Occupancy Rate Trends (2025)
Maximize your bookings by understanding the Pau STR occupancy trends. Seasonal demand shifts significantly influence how often properties are booked. Typically, Augustsees the highest demand (peak season occupancy), while February experiences the lowest (low season). Effective strategies, like adjusting minimum stays or offering promotions, can boost occupancy during slower periods. Here's how different property tiers perform in Pau:
- Best-in-class properties (Top 10%) achieve 61%+ occupancy, indicating high desirability and potentially optimized availability.
- Strong performing properties (Top 25%) maintain 46% or higher occupancy, suggesting good market fit and guest satisfaction.
- Typical properties (Median) have an occupancy rate around 25%.
- Entry-level properties (Bottom 25%) average 16% occupancy, potentially facing higher vacancy.
Average Monthly Occupancy Rate Trend in Pau
Average Daily Rate (ADR) Airbnb Trends in Pau (2025)
Effective short term rental pricing strategy in Pau involves understanding monthly ADR fluctuations. The Average Daily Rate (ADR) for Airbnb in Pau typically peaks in July and dips lowest during November. Leveraging Airbnb dynamic pricing tools or strategies based on this seasonality can significantly boost revenue. Here's a look at the typical nightly rates achieved:
- Best-in-class properties (Top 10%) command rates of $338+ per night, often due to premium features or locations.
- Strong performing properties (Top 25%) achieve nightly rates of $216 or more.
- Typical properties (Median) charge around $110 per night.
- Entry-level properties (Bottom 25%) earn around $80 per night.
Average Daily Rate (ADR) Trend by Month in Pau
Get Live Pau Market Intelligence 👇

Explore Real-time Analytics
Airbnb Seasonality Analysis & Trends in Pau (2025)
Peak Season (August, July, September)
- Revenue averages $2,681 per month
- Occupancy rates average 54.0%
- Daily rates average $184
Shoulder Season
- Revenue averages $840 per month
- Occupancy maintains around 24.5%
- Daily rates hold near $164
Low Season (January, February, December)
- Revenue drops to average $463 per month
- Occupancy decreases to average 20.2%
- Daily rates adjust to average $142
Seasonality Insights for Pau
- The Airbnb seasonality in Pau shows highly seasonal trends requiring careful strategy. While the sections above show seasonal averages, it's also insightful to look at the extremes:
- During the high season, the absolute peak month showcases Pau's highest earning potential, with monthly revenues capable of climbing to $3,979, occupancy reaching a high of 75.8%, and ADRs peaking at $192.
- Conversely, the slowest single month of the year, typically falling within the low season, marks the market's lowest point. In this month, revenue might dip to $308, occupancy could drop to 14.8%, and ADRs may adjust down to $139.
- Understanding both the seasonal averages and these monthly peaks and troughs in revenue, occupancy, and ADR is crucial for maximizing your Airbnb profit potential in Pau.
Seasonal Strategies for Maximizing Profit
- Peak Season: Maximize revenue through premium pricing and potentially longer minimum stays. Ensure high availability.
- Low Season: Offer competitive pricing, special promotions (e.g., extended stay discounts), and flexible cancellation policies. Target off-season travelers like remote workers or budget-conscious guests.
- Shoulder Seasons: Implement dynamic pricing that balances peak and low rates. Target weekend travelers or specific events. Offer slightly more flexible terms than peak season.
- Regularly analyze your own performance against these Pau seasonality benchmarks and adjust your pricing and availability strategy accordingly.
Best Areas for Airbnb Investment in Pau (2025)
Exploring the top neighborhoods for short-term rentals in Pau? This section highlights key areas, outlining why they are attractive for hosts and guests, along with notable local attractions. Consider these locations based on your target guest profile and investment strategy.
| Neighborhood / Area | Why Host Here? (Target Guests & Appeal) | Key Attractions & Landmarks |
|---|---|---|
| Pau de les Sorpreses | A charming neighborhood known for its quiet streets and close proximity to local cafes and shops. Ideal for visitors who prefer a more residential experience with easy access to nature. | Parc de la Ciutadella, Museu de la Vida Rural, Local cafés, Hiking trails, Cultural events |
| Centre de Pau | The heart of Pau, densely packed with attractions, restaurants, and shops. Great for tourists who want to explore the city’s historical and cultural essence. | Pau Castle, Boulevard des Pyrénées, Palais Beaumont, The Green Lake, Pau's local markets |
| Pau Nord | A developing area with new restaurants and a youthful vibe. Perfect for those looking to experience Pau's emerging culinary scene and nightlife. | Local restaurants, Bars and clubs, Park de la Prax |
| Pau Sud | A scenic area featuring beautiful views of the Pyrenees, offering easy access to outdoor activities. Ideal for adventure seekers and nature lovers. | Hiking routes, Scenic viewpoints, Natural parks, Cycling paths |
| Quartier des Halles | Known for its vibrant market scene and local culture. Perfect for tourists looking for authentic local experiences and gastronomy. | Les Halles market, Local cheese shops, Cooking classes, Pastry shops |
| La Plaza de la Libertad | A bustling square in the center of Pau, surrounded by bars and restaurants. An ideal spot for nightlife and entertainment. | Bars and nightlife, Weekly markets, Street performances |
| Les Arènes | A historical area with rich cultural heritage, close to museums and traditional architecture. Great for tourists interested in history. | Pau Museum, Les Arènes de Pau, Historical buildings, Local art galleries |
| Bordes de la Mer | A coastal district perfect for beach lovers and water sports enthusiasts, offering beautiful beach access and seaside activities. | Beaches, Water sports venues, Coastal restaurants, Beach bars |
Understanding Airbnb License Requirements & STR Laws in Pau (2025)
Yes, Pau, Catalonia, Spain enforces high STR regulations. Obtaining a license and ensuring compliance is almost certainly required according to current 2025 STR laws. Always verify the latest short term rental regulations and Airbnb license requirements directly with local government authorities for Pau to ensure full compliance before hosting.
(Source: AirROI data, 2025, based on 84% licensed listings)
Top Performing Airbnb Properties in Pau (2025)
Benchmark your potential! Explore examples of top-performing Airbnb properties in Paubased on Trailing Twelve Month (TTM) revenue. Analyze their characteristics, revenue, occupancy rate, and ADR to understand what drives success in this market.
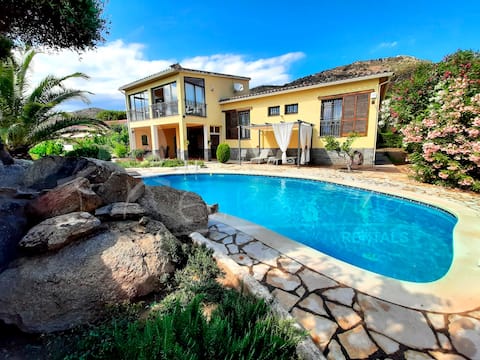
Casa Mestral- cerca de Roses y Empuriabrava
Entire Place • 3 bedrooms
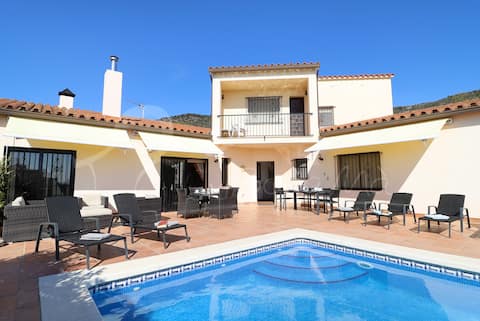
Casa María ideal for families,Costa Brava,Spain
Entire Place • 4 bedrooms
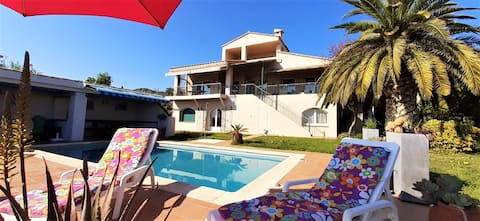
Apartment and Spa - Panoramic Olivars
Entire Place • 3 bedrooms
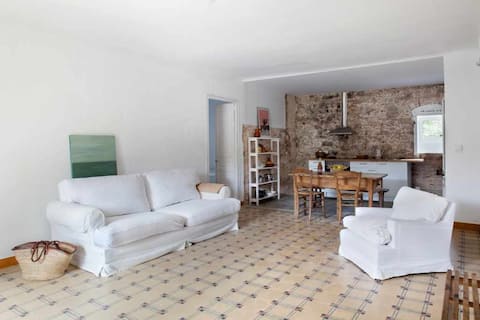
La Casa de Pau. Beautiful house in a rural setting
Entire Place • 3 bedrooms

Mestral by Interhome
Entire Place • 3 bedrooms
Suite Room
Private Room • N/A
Note: Performance varies based on location, size, amenities, seasonality, and management quality. Data reflects the past 12 months.
Top Performing Airbnb Hosts in Pau (2025)
Learn from the best! This table showcases top-performing Airbnb hosts in Pau based on the number of properties managed and estimated total revenue over the past year. Analyze their scale and performance metrics.
| Host Name | Properties | Grossing Revenue | Stay Reviews | Avg Rating |
|---|---|---|---|---|
| Petra | 2 | $45,473 | 30 | 4.69/5.0 |
| Marie-Laure | 2 | $28,543 | 97 | 4.89/5.0 |
| Cati | 2 | $25,063 | 28 | 4.62/5.0 |
| Nils-Olof | 4 | $23,615 | 61 | 4.79/5.0 |
| Sabrina | 2 | $23,261 | 460 | 4.89/5.0 |
| Rafa | 1 | $18,161 | 48 | 4.79/5.0 |
| Host #107252451 | 1 | $18,155 | 0 | 0.00/5.0 |
| Jaume | 1 | $12,413 | 345 | 4.86/5.0 |
| Cris | 1 | $7,097 | 31 | 4.84/5.0 |
| Rusó | 1 | $6,671 | 41 | 4.76/5.0 |
Analyzing the strategies of top hosts, such as their property selection, pricing, and guest communication, can offer valuable lessons for optimizing your own Airbnb operations in Pau.
Dive Deeper: Advanced Pau STR Market Data (2025)
Ready to unlock more insights? AirROI provides access to advanced metrics and comprehensive Airbnb data for Pau. Explore detailed analytics beyond this report to refine your investment strategy, optimize pricing, and maximize your vacation rental profits.
Explore Advanced MetricsPau Short-Term Rental Market Composition (2025): Property & Room Types
Room Type Distribution
Property Type Distribution
Market Composition Insights for Pau
- The Pau Airbnb market composition is heavily skewed towards Entire Home/Apt listings, which make up 57.9% of the 19 active rentals. This indicates strong guest preference for privacy and space.
- However, a notable 42.1% share for Private Rooms suggests opportunities for budget-conscious travelers or hosts renting out spare rooms.
- Looking at the property type distribution in Pau, House properties are the most common (52.6%), reflecting the local real estate landscape.
- Houses represent a significant 52.6% portion, catering likely to families or larger groups.
- The presence of 26.3% Hotel/Boutique listings indicates integration with traditional hospitality.
Pau Airbnb Room Capacity Analysis (2025): Bedroom Distribution
Distribution of Listings by Number of Bedrooms
Room Capacity Insights for Pau
- The dominant room capacity in Pau is 1 bedroom listings, making up 31.6% of the market. This suggests a strong demand for properties suitable for couples or solo travelers.
- Together, 1 bedroom and 3 bedrooms properties represent 52.7% of the active Airbnb listings in Pau, indicating a high concentration in these sizes.
- A significant 31.7% of listings offer 3+ bedrooms, catering to larger groups and families seeking more space in Pau.
Pau Vacation Rental Guest Capacity Trends (2025)
Distribution of Listings by Guest Capacity
Guest Capacity Insights for Pau
- The most common guest capacity trend in Pau vacation rentals is listings accommodating 6 guests (21.1%). This suggests the primary traveler segment is likely larger groups.
- Properties designed for 6 guests and 4 guests dominate the Pau STR market, accounting for 36.9% of listings.
- 31.6% of properties accommodate 6+ guests, serving the market segment for larger families or group travel in Pau.
- On average, properties in Pau are equipped to host 3.2 guests.
Pau Airbnb Booking Patterns (2025): Available vs. Booked Days
Available Days Distribution
Booked Days Distribution
Booking Pattern Insights for Pau
- The most common availability pattern in Pau falls within the 271-366 days range, representing 57.9% of listings. This suggests many properties have significant open periods on their calendars.
- Approximately 94.7% of listings show high availability (181+ days open annually), indicating potential for increased bookings or specific owner usage patterns.
- For booked days, the 31-90 days range is most frequent in Pau (52.6%), reflecting common guest stay durations or potential owner blocking patterns.
- A notable 5.3% of properties secure long booking periods (181+ days booked per year), highlighting successful long-term rental strategies or significant owner usage.
Pau Airbnb Minimum Stay Requirements Analysis
Distribution of Listings by Minimum Night Requirement
1 Night
6 listings
31.6% of total
2 Nights
5 listings
26.3% of total
3 Nights
1 listings
5.3% of total
7-29 Nights
3 listings
15.8% of total
30+ Nights
4 listings
21.1% of total
Key Insights
- The most prevalent minimum stay requirement in Pau is 1 Night, adopted by 31.6% of listings. This highlights the market's preference for shorter, flexible bookings.
- A significant segment (21.1%) caters to monthly stays (30+ nights) in Pau, pointing to opportunities in the extended-stay market.
Recommendations
- Align with the market by considering a 1 Night minimum stay, as 31.6% of Pau hosts use this setting.
- Explore offering discounts for stays of 30+ nights to attract the 21.1% of the market seeking extended stays.
- Adjust minimum nights based on seasonality – potentially shorter during low season and longer during peak demand periods in Pau.
Pau Airbnb Cancellation Policy Trends Analysis (2025)
Flexible
3 listings
16.7% of total
Moderate
10 listings
55.6% of total
Firm
4 listings
22.2% of total
Strict
1 listings
5.6% of total
Cancellation Policy Insights for Pau
- The prevailing Airbnb cancellation policy trend in Pau is Moderate, used by 55.6% of listings.
- The market strongly favors guest-friendly terms, with 72.3% of listings offering Flexible or Moderate policies. This suggests guests in Pau may expect booking flexibility.
- Strict cancellation policies are quite rare (5.6%), potentially making listings with this policy less competitive unless justified by high demand or property type.
Recommendations for Hosts
- Consider adopting a Moderate policy to align with the 55.6% market standard in Pau.
- Using a Strict policy might deter some guests, as only 5.6% of listings use it. Evaluate if potential revenue protection outweighs possible lower booking rates.
- Regularly review your cancellation policy against competitors and market demand shifts in Pau.
Pau STR Booking Lead Time Analysis (2025)
Average Booking Lead Time by Month
Booking Lead Time Insights for Pau
- The overall average booking lead time for vacation rentals in Pau is 71 days.
- Guests book furthest in advance for stays during August (average 108 days), likely coinciding with peak travel demand or local events.
- The shortest booking windows occur for stays in February (average 17 days), indicating more last-minute travel plans during this time.
- Seasonally, Summer (99 days avg.) sees the longest lead times, while Winter (24 days avg.) has the shortest, reflecting typical travel planning cycles.
Recommendations for Hosts
- Use the overall average lead time (71 days) as a baseline for your pricing and availability strategy in Pau.
- For August stays, consider implementing length-of-stay discounts or slightly higher rates for bookings made less than 108 days out to capitalize on advance planning.
- Target marketing efforts for the Summer season well in advance (at least 99 days) to capture early planners.
- Monitor your own booking lead times against these Pau averages to identify opportunities for dynamic pricing adjustments.
Popular & Essential Airbnb Amenities in Pau (2025)
Amenity Prevalence
Amenity Insights for Pau
- Essential amenities in Pau that guests expect include: Wifi. Lacking these (this) could significantly impact bookings.
- Popular amenities like Hangers, Hot water, Heating are common but not universal. Offering these can provide a competitive edge.
Recommendations for Hosts
- Ensure your listing includes all essential amenities for Pau: Wifi.
- Consider adding popular differentiators like Hangers or Hot water to increase appeal.
- Highlight unique or less common amenities you offer (e.g., hot tub, dedicated workspace, EV charger) in your listing description and photos.
- Regularly check competitor amenities in Pau to stay competitive.
Pau Airbnb Guest Demographics & Profile Analysis (2025)
Guest Profile Summary for Pau
- The typical guest profile for Airbnb in Pau consists of predominantly international visitors (72%), with top international origins including Spain, typically belonging to the Post-2000s (Gen Z/Alpha) group (50%), primarily speaking English or French.
- Domestic travelers account for 27.6% of guests.
- Key international markets include France (42.5%) and Spain (27.6%).
- Top languages spoken are English (33.3%) followed by French (20.4%).
- A significant demographic segment is the Post-2000s (Gen Z/Alpha) group, representing 50% of guests.
Recommendations for Hosts
- Focus marketing internationally, particularly towards travelers from Spain.
- Tailor amenities and listing descriptions to appeal to the dominant Post-2000s (Gen Z/Alpha) demographic (e.g., highlight fast WiFi, smart home features, local guides).
- Highlight unique local experiences or amenities relevant to the primary guest profile.
- Consider seasonal promotions aligned with peak travel times for key origin markets.
Nearby Short-Term Rental Market Comparison
How does the Pau Airbnb market stack up against its neighbors? Compare key performance metrics like average monthly revenue, ADR, and occupancy rates in surrounding areas to understand the broader regional STR landscape.
| Market | Active Properties | Monthly Revenue | Daily Rate | Avg. Occupancy |
|---|---|---|---|---|
| Vall-llobrega | 15 | $10,261 | $798.88 | 44% |
| Arenys de Munt | 28 | $5,100 | $514.27 | 41% |
| Teià | 25 | $5,027 | $348.45 | 45% |
| Cornellà del Terri | 17 | $4,960 | $460.96 | 41% |
| Tiana | 12 | $4,955 | $299.97 | 48% |
| Amer | 10 | $4,848 | $397.58 | 40% |
| Bescanó | 11 | $4,761 | $445.38 | 41% |
| Porqueres | 12 | $4,714 | $469.05 | 36% |
| Premià de Dalt | 28 | $4,630 | $345.43 | 49% |
| Cabrils | 53 | $4,474 | $436.58 | 48% |