Olot Airbnb Market Analysis 2025: Short Term Rental Data & Vacation Rental Statistics in Catalonia, Spain
Is Airbnb profitable in Olot in 2025? Explore comprehensive Airbnb analytics for Olot, Catalonia, Spain to uncover income potential. This 2025 STR market report for Olot, based on AirROI data from April 2024 to March 2025, reveals key trends in the niche market of 77 active listings.
Whether you're considering an Airbnb investment in Olot, optimizing your existing vacation rental, or exploring rental arbitrage opportunities, understanding the Olot Airbnb data is crucial. Navigating the high regulation landscape is key to maximizing your short term rental income potential. Let's dive into the specifics.
Key Olot Airbnb Performance Metrics Overview
Monthly Airbnb Revenue Variations & Income Potential in Olot (2025)
Understanding the monthly revenue variations for Airbnb listings in Olot is key to maximizing your short term rental income potential. Seasonality significantly impacts earnings. Our analysis, based on data from the past 12 months, shows that the peak revenue month for STRs in Olot is typically August, while February often presents the lowest earnings, highlighting opportunities for strategic pricing adjustments during shoulder and low seasons. Explore the typical Airbnb income in Olot across different performance tiers:
- Best-in-class properties (Top 10%) achieve $3,752+ monthly, often utilizing dynamic pricing and superior guest experiences.
- Strong performing properties (Top 25%) earn $2,205 or more, indicating effective management and desirable locations/amenities.
- Typical properties (Median) generate around $1,258 per month, representing the average market performance.
- Entry-level properties (Bottom 25%) see earnings around $758, often with potential for optimization.
Average Monthly Airbnb Earnings Trend in Olot
Olot Airbnb Occupancy Rate Trends (2025)
Maximize your bookings by understanding the Olot STR occupancy trends. Seasonal demand shifts significantly influence how often properties are booked. Typically, Augustsees the highest demand (peak season occupancy), while January experiences the lowest (low season). Effective strategies, like adjusting minimum stays or offering promotions, can boost occupancy during slower periods. Here's how different property tiers perform in Olot:
- Best-in-class properties (Top 10%) achieve 67%+ occupancy, indicating high desirability and potentially optimized availability.
- Strong performing properties (Top 25%) maintain 51% or higher occupancy, suggesting good market fit and guest satisfaction.
- Typical properties (Median) have an occupancy rate around 32%.
- Entry-level properties (Bottom 25%) average 16% occupancy, potentially facing higher vacancy.
Average Monthly Occupancy Rate Trend in Olot
Average Daily Rate (ADR) Airbnb Trends in Olot (2025)
Effective short term rental pricing strategy in Olot involves understanding monthly ADR fluctuations. The Average Daily Rate (ADR) for Airbnb in Olot typically peaks in December and dips lowest during April. Leveraging Airbnb dynamic pricing tools or strategies based on this seasonality can significantly boost revenue. Here's a look at the typical nightly rates achieved:
- Best-in-class properties (Top 10%) command rates of $262+ per night, often due to premium features or locations.
- Strong performing properties (Top 25%) achieve nightly rates of $187 or more.
- Typical properties (Median) charge around $140 per night.
- Entry-level properties (Bottom 25%) earn around $100 per night.
Average Daily Rate (ADR) Trend by Month in Olot
Get Live Olot Market Intelligence 👇

Explore Real-time Analytics
Airbnb Seasonality Analysis & Trends in Olot (2025)
Peak Season (August, July, December)
- Revenue averages $2,641 per month
- Occupancy rates average 48.2%
- Daily rates average $171
Shoulder Season
- Revenue averages $1,702 per month
- Occupancy maintains around 33.7%
- Daily rates hold near $167
Low Season (January, February, March)
- Revenue drops to average $1,184 per month
- Occupancy decreases to average 25.4%
- Daily rates adjust to average $168
Seasonality Insights for Olot
- The Airbnb seasonality in Olot shows highly seasonal trends requiring careful strategy. While the sections above show seasonal averages, it's also insightful to look at the extremes:
- During the high season, the absolute peak month showcases Olot's highest earning potential, with monthly revenues capable of climbing to $3,211, occupancy reaching a high of 56.9%, and ADRs peaking at $175.
- Conversely, the slowest single month of the year, typically falling within the low season, marks the market's lowest point. In this month, revenue might dip to $1,066, occupancy could drop to 24.1%, and ADRs may adjust down to $165.
- Understanding both the seasonal averages and these monthly peaks and troughs in revenue, occupancy, and ADR is crucial for maximizing your Airbnb profit potential in Olot.
Seasonal Strategies for Maximizing Profit
- Peak Season: Maximize revenue through premium pricing and potentially longer minimum stays. Ensure high availability.
- Low Season: Offer competitive pricing, special promotions (e.g., extended stay discounts), and flexible cancellation policies. Target off-season travelers like remote workers or budget-conscious guests.
- Shoulder Seasons: Implement dynamic pricing that balances peak and low rates. Target weekend travelers or specific events. Offer slightly more flexible terms than peak season.
- Regularly analyze your own performance against these Olot seasonality benchmarks and adjust your pricing and availability strategy accordingly.
Best Areas for Airbnb Investment in Olot (2025)
Exploring the top neighborhoods for short-term rentals in Olot? This section highlights key areas, outlining why they are attractive for hosts and guests, along with notable local attractions. Consider these locations based on your target guest profile and investment strategy.
| Neighborhood / Area | Why Host Here? (Target Guests & Appeal) | Key Attractions & Landmarks |
|---|---|---|
| Historic Center of Olot | Charming area characterized by its preserved medieval architecture and rich history. Ideal for tourists who wish to explore the cultural heritage of the region. | St. Stephen's Church, Olot Museum, La Garrotxa Volcanic Zone Natural Park, Sant Francesc Temple, The Municipal Theater |
| La Garrotxa Volcanic Zone | Famous for its scenic volcanic landscapes and unique natural beauty. A popular destination for nature lovers and outdoor enthusiasts. | Croscat Volcano, Santa Margarida Volcano, The Volcano Museum, Natural Park hiking trails, Salt del Molí de les Nou |
| Sant Joan les Fonts | Picturesque village close to Olot, known for its natural surroundings and hiking trails. Attractive for visitors looking for tranquility and nature. | Font de les Tries, Calçotada Festival, Local hiking paths, Historic bridges, Natural springs |
| Fageda d'en Jordà | A stunning beech forest known for its unique beauty and tranquility. Popular for walking, cycling and immersing in nature. | Fageda d'en Jordà trails, Local flora and fauna, Photography opportunities, The ancient oak trees, Observation points |
| Montsacopa Volcano | An iconic landmark with a panoramic view of Olot and the surrounding valleys. Great for tourists who appreciate beautiful landscapes and hiking. | Montsacopa Church, Interpretive trails, Scenic viewpoints, Flora and fauna, Historical significance |
| Olot's Farmer's Market Area | Vibrant market area known for local produce and artisanal goods. Attracts both locals and tourists interested in gastronomy. | Weekly farmer's market, Local food stalls, Artisan crafts, Culinary workshops, Cultural events |
| Ctra. de la Vilanova | A lively avenue offering a mix of shops, cafes, and restaurants. Perfect for guests looking for convenience and local experiences. | Boutique shops, Cafés and local eateries, Public parks, Cultural exhibitions, Local art scene |
| Parc Nou | A peaceful park featuring gardens and playgrounds, providing a perfect escape for families and nature enthusiasts. | Walking paths, Picnic areas, Playgrounds, Gardens, Nature observation spots |
Understanding Airbnb License Requirements & STR Laws in Olot (2025)
Yes, Olot, Catalonia, Spain enforces high STR regulations. Obtaining a license and ensuring compliance is almost certainly required according to current 2025 STR laws. Always verify the latest short term rental regulations and Airbnb license requirements directly with local government authorities for Olot to ensure full compliance before hosting.
(Source: AirROI data, 2025, based on 86% licensed listings)
Top Performing Airbnb Properties in Olot (2025)
Benchmark your potential! Explore examples of top-performing Airbnb properties in Olotbased on Trailing Twelve Month (TTM) revenue. Analyze their characteristics, revenue, occupancy rate, and ADR to understand what drives success in this market.
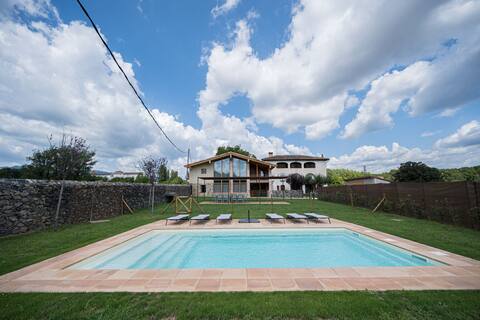
Charm and elegance in the volcanic area Garrotxa
Entire Place • 5 bedrooms

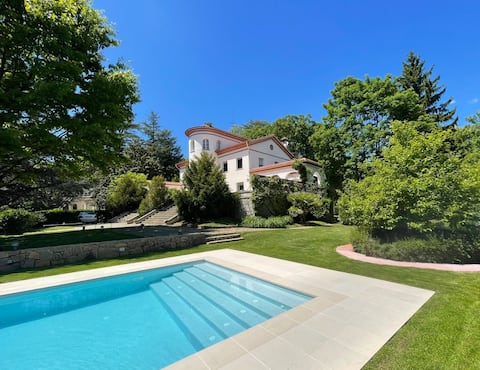
Former Descals and Pavilion factory, the entire estate.
Entire Place • 4 bedrooms
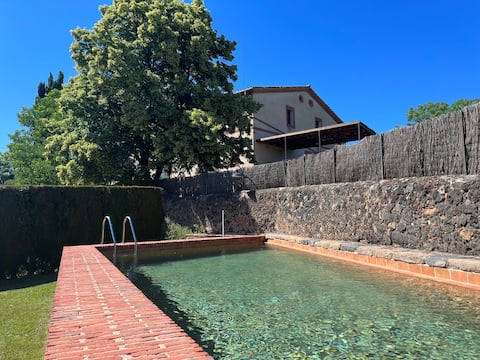
Spectacular country house in the centre of Olot.
Entire Place • 6 bedrooms
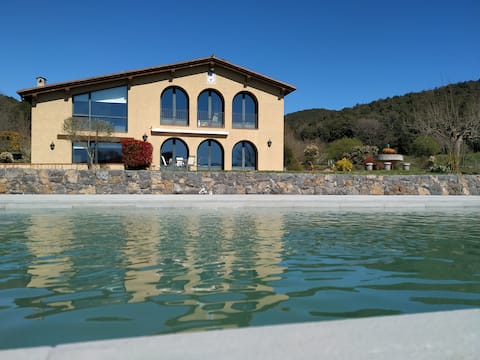
Gran masía catalana restaurada con piscina.
Entire Place • 9 bedrooms
HOUSE IN FRONT OF CROSCAT VOLCANO
Entire Place • 4 bedrooms
Fàbrica Descals, historic building
Entire Place • 3 bedrooms
Note: Performance varies based on location, size, amenities, seasonality, and management quality. Data reflects the past 12 months.
Top Performing Airbnb Hosts in Olot (2025)
Learn from the best! This table showcases top-performing Airbnb hosts in Olot based on the number of properties managed and estimated total revenue over the past year. Analyze their scale and performance metrics.
| Host Name | Properties | Grossing Revenue | Stay Reviews | Avg Rating |
|---|---|---|---|---|
| Narcís | 3 | $119,722 | 49 | 4.84/5.0 |
| Jordi | 1 | $116,533 | 10 | 5.00/5.0 |
| Greenlike | 9 | $103,983 | 155 | 4.94/5.0 |
| Familia Casamitjana | 3 | $82,288 | 161 | 4.98/5.0 |
| Fina | 11 | $75,437 | 142 | 4.84/5.0 |
| Teresa | 3 | $63,409 | 87 | 4.97/5.0 |
| Ester | 1 | $59,386 | 27 | 5.00/5.0 |
| Host #100195385 | 1 | $54,213 | 0 | 0.00/5.0 |
| Joan | 2 | $38,527 | 27 | 4.91/5.0 |
| Mariona | 1 | $37,756 | 112 | 4.98/5.0 |
Analyzing the strategies of top hosts, such as their property selection, pricing, and guest communication, can offer valuable lessons for optimizing your own Airbnb operations in Olot.
Dive Deeper: Advanced Olot STR Market Data (2025)
Ready to unlock more insights? AirROI provides access to advanced metrics and comprehensive Airbnb data for Olot. Explore detailed analytics beyond this report to refine your investment strategy, optimize pricing, and maximize your vacation rental profits.
Explore Advanced MetricsOlot Short-Term Rental Market Composition (2025): Property & Room Types
Room Type Distribution
Property Type Distribution
Market Composition Insights for Olot
- The Olot Airbnb market composition is heavily skewed towards Entire Home/Apt listings, which make up 96.1% of the 77 active rentals. This indicates strong guest preference for privacy and space.
- Looking at the property type distribution in Olot, Apartment/Condo properties are the most common (64.9%), reflecting the local real estate landscape.
- Houses represent a significant 23.4% portion, catering likely to families or larger groups.
- The presence of 6.5% Hotel/Boutique listings indicates integration with traditional hospitality.
Olot Airbnb Room Capacity Analysis (2025): Bedroom Distribution
Distribution of Listings by Number of Bedrooms
Room Capacity Insights for Olot
- The dominant room capacity in Olot is 2 bedrooms listings, making up 37.7% of the market. This suggests a strong demand for properties suitable for couples or solo travelers.
- Together, 2 bedrooms and 1 bedroom properties represent 67.6% of the active Airbnb listings in Olot, indicating a high concentration in these sizes.
- A significant 28.6% of listings offer 3+ bedrooms, catering to larger groups and families seeking more space in Olot.
Olot Vacation Rental Guest Capacity Trends (2025)
Distribution of Listings by Guest Capacity
Guest Capacity Insights for Olot
- The most common guest capacity trend in Olot vacation rentals is listings accommodating 4 guests (46.8%). This suggests the primary traveler segment is likely small families or groups.
- Properties designed for 4 guests and 5 guests dominate the Olot STR market, accounting for 59.8% of listings.
- 26.0% of properties accommodate 6+ guests, serving the market segment for larger families or group travel in Olot.
- On average, properties in Olot are equipped to host 4.6 guests.
Olot Airbnb Booking Patterns (2025): Available vs. Booked Days
Available Days Distribution
Booked Days Distribution
Booking Pattern Insights for Olot
- The most common availability pattern in Olot falls within the 271-366 days range, representing 49.4% of listings. This suggests many properties have significant open periods on their calendars.
- Approximately 83.2% of listings show high availability (181+ days open annually), indicating potential for increased bookings or specific owner usage patterns.
- For booked days, the 91-180 days range is most frequent in Olot (36.4%), reflecting common guest stay durations or potential owner blocking patterns.
- A notable 18.2% of properties secure long booking periods (181+ days booked per year), highlighting successful long-term rental strategies or significant owner usage.
Olot Airbnb Minimum Stay Requirements Analysis
Distribution of Listings by Minimum Night Requirement
1 Night
27 listings
35.5% of total
2 Nights
42 listings
55.3% of total
3 Nights
1 listings
1.3% of total
4-6 Nights
1 listings
1.3% of total
30+ Nights
5 listings
6.6% of total
Key Insights
- The most prevalent minimum stay requirement in Olot is 2 Nights, adopted by 55.3% of listings. This highlights the market's preference for shorter, flexible bookings.
- A strong majority (90.8%) of the Olot Airbnb data shows acceptance of very short stays (1-2 nights), indicating a dynamic, high-turnover market.
Recommendations
- Align with the market by considering a 2 Nights minimum stay, as 55.3% of Olot hosts use this setting.
- Explore offering discounts for stays of 30+ nights to attract the 6.6% of the market seeking extended stays.
- Adjust minimum nights based on seasonality – potentially shorter during low season and longer during peak demand periods in Olot.
Olot Airbnb Cancellation Policy Trends Analysis (2025)
Flexible
8 listings
11.1% of total
Moderate
25 listings
34.7% of total
Firm
9 listings
12.5% of total
Strict
30 listings
41.7% of total
Cancellation Policy Insights for Olot
- The prevailing Airbnb cancellation policy trend in Olot is Strict, used by 41.7% of listings.
- A majority (54.2%) of hosts in Olot utilize Firm or Strict policies, indicating a market where hosts prioritize booking security.
Recommendations for Hosts
- Consider adopting a Strict policy to align with the 41.7% market standard in Olot.
- With 41.7% using Strict terms, this is a viable option in Olot, particularly for high-value properties or during peak demand periods.
- Regularly review your cancellation policy against competitors and market demand shifts in Olot.
Olot STR Booking Lead Time Analysis (2025)
Average Booking Lead Time by Month
Booking Lead Time Insights for Olot
- The overall average booking lead time for vacation rentals in Olot is 62 days.
- Guests book furthest in advance for stays during August (average 84 days), likely coinciding with peak travel demand or local events.
- The shortest booking windows occur for stays in February (average 32 days), indicating more last-minute travel plans during this time.
- Seasonally, Summer (81 days avg.) sees the longest lead times, while Winter (38 days avg.) has the shortest, reflecting typical travel planning cycles.
Recommendations for Hosts
- Use the overall average lead time (62 days) as a baseline for your pricing and availability strategy in Olot.
- For August stays, consider implementing length-of-stay discounts or slightly higher rates for bookings made less than 84 days out to capitalize on advance planning.
- Target marketing efforts for the Summer season well in advance (at least 81 days) to capture early planners.
- Monitor your own booking lead times against these Olot averages to identify opportunities for dynamic pricing adjustments.
Popular & Essential Airbnb Amenities in Olot (2025)
Amenity Prevalence
Amenity Insights for Olot
- Essential amenities in Olot that guests expect include: Kitchen, Wifi, TV. Lacking these (any) could significantly impact bookings.
- Popular amenities like Heating, Dishes and silverware, Hair dryer are common but not universal. Offering these can provide a competitive edge.
Recommendations for Hosts
- Ensure your listing includes all essential amenities for Olot: Kitchen, Wifi, TV.
- Prioritize adding missing essentials: Wifi, TV.
- Consider adding popular differentiators like Heating or Dishes and silverware to increase appeal.
- Highlight unique or less common amenities you offer (e.g., hot tub, dedicated workspace, EV charger) in your listing description and photos.
- Regularly check competitor amenities in Olot to stay competitive.
Olot Airbnb Guest Demographics & Profile Analysis (2025)
Guest Profile Summary for Olot
- The typical guest profile for Airbnb in Olot consists of a mix of domestic (53%) and international guests, often arriving from nearby Barcelona, typically belonging to the Post-2000s (Gen Z/Alpha) group (50%), primarily speaking English or Spanish.
- Domestic travelers account for 52.7% of guests.
- Key international markets include Spain (52.7%) and France (17.1%).
- Top languages spoken are English (32.7%) followed by Spanish (29.4%).
- A significant demographic segment is the Post-2000s (Gen Z/Alpha) group, representing 50% of guests.
Recommendations for Hosts
- Balance marketing efforts between domestic and international channels based on the guest mix.
- Tailor amenities and listing descriptions to appeal to the dominant Post-2000s (Gen Z/Alpha) demographic (e.g., highlight fast WiFi, smart home features, local guides).
- Highlight unique local experiences or amenities relevant to the primary guest profile.
- Consider seasonal promotions aligned with peak travel times for key origin markets.
Nearby Short-Term Rental Market Comparison
How does the Olot Airbnb market stack up against its neighbors? Compare key performance metrics like average monthly revenue, ADR, and occupancy rates in surrounding areas to understand the broader regional STR landscape.
| Market | Active Properties | Monthly Revenue | Daily Rate | Avg. Occupancy |
|---|---|---|---|---|
| Vall-llobrega | 15 | $10,261 | $798.88 | 44% |
| Canyelles | 49 | $5,958 | $1023.94 | 37% |
| Arenys de Munt | 28 | $5,100 | $514.27 | 41% |
| Teià | 25 | $5,027 | $348.45 | 45% |
| Cornellà del Terri | 17 | $4,960 | $460.96 | 41% |
| Tiana | 12 | $4,955 | $299.97 | 48% |
| Amer | 10 | $4,848 | $397.58 | 40% |
| Bescanó | 11 | $4,761 | $445.38 | 41% |
| Porqueres | 12 | $4,714 | $469.05 | 36% |
| Premià de Dalt | 28 | $4,630 | $345.43 | 49% |