Navata Airbnb Market Analysis 2025: Short Term Rental Data & Vacation Rental Statistics in Catalonia, Spain
Is Airbnb profitable in Navata in 2025? Explore comprehensive Airbnb analytics for Navata, Catalonia, Spain to uncover income potential. This 2025 STR market report for Navata, based on AirROI data from April 2024 to March 2025, reveals key trends in the niche market of 21 active listings.
Whether you're considering an Airbnb investment in Navata, optimizing your existing vacation rental, or exploring rental arbitrage opportunities, understanding the Navata Airbnb data is crucial. Navigating the high regulation landscape is key to maximizing your short term rental income potential. Let's dive into the specifics.
Key Navata Airbnb Performance Metrics Overview
Monthly Airbnb Revenue Variations & Income Potential in Navata (2025)
Understanding the monthly revenue variations for Airbnb listings in Navata is key to maximizing your short term rental income potential. Seasonality significantly impacts earnings. Our analysis, based on data from the past 12 months, shows that the peak revenue month for STRs in Navata is typically August, while January often presents the lowest earnings, highlighting opportunities for strategic pricing adjustments during shoulder and low seasons. Explore the typical Airbnb income in Navata across different performance tiers:
- Best-in-class properties (Top 10%) achieve $7,310+ monthly, often utilizing dynamic pricing and superior guest experiences.
- Strong performing properties (Top 25%) earn $3,616 or more, indicating effective management and desirable locations/amenities.
- Typical properties (Median) generate around $1,723 per month, representing the average market performance.
- Entry-level properties (Bottom 25%) see earnings around $919, often with potential for optimization.
Average Monthly Airbnb Earnings Trend in Navata
Navata Airbnb Occupancy Rate Trends (2025)
Maximize your bookings by understanding the Navata STR occupancy trends. Seasonal demand shifts significantly influence how often properties are booked. Typically, Augustsees the highest demand (peak season occupancy), while January experiences the lowest (low season). Effective strategies, like adjusting minimum stays or offering promotions, can boost occupancy during slower periods. Here's how different property tiers perform in Navata:
- Best-in-class properties (Top 10%) achieve 60%+ occupancy, indicating high desirability and potentially optimized availability.
- Strong performing properties (Top 25%) maintain 40% or higher occupancy, suggesting good market fit and guest satisfaction.
- Typical properties (Median) have an occupancy rate around 25%.
- Entry-level properties (Bottom 25%) average 13% occupancy, potentially facing higher vacancy.
Average Monthly Occupancy Rate Trend in Navata
Average Daily Rate (ADR) Airbnb Trends in Navata (2025)
Effective short term rental pricing strategy in Navata involves understanding monthly ADR fluctuations. The Average Daily Rate (ADR) for Airbnb in Navata typically peaks in July and dips lowest during April. Leveraging Airbnb dynamic pricing tools or strategies based on this seasonality can significantly boost revenue. Here's a look at the typical nightly rates achieved:
- Best-in-class properties (Top 10%) command rates of $444+ per night, often due to premium features or locations.
- Strong performing properties (Top 25%) achieve nightly rates of $327 or more.
- Typical properties (Median) charge around $225 per night.
- Entry-level properties (Bottom 25%) earn around $162 per night.
Average Daily Rate (ADR) Trend by Month in Navata
Get Live Navata Market Intelligence 👇

Explore Real-time Analytics
Airbnb Seasonality Analysis & Trends in Navata (2025)
Peak Season (August, July, September)
- Revenue averages $4,962 per month
- Occupancy rates average 44.0%
- Daily rates average $283
Shoulder Season
- Revenue averages $2,594 per month
- Occupancy maintains around 26.1%
- Daily rates hold near $272
Low Season (January, February, April)
- Revenue drops to average $1,468 per month
- Occupancy decreases to average 17.4%
- Daily rates adjust to average $270
Seasonality Insights for Navata
- The Airbnb seasonality in Navata shows highly seasonal trends requiring careful strategy. While the sections above show seasonal averages, it's also insightful to look at the extremes:
- During the high season, the absolute peak month showcases Navata's highest earning potential, with monthly revenues capable of climbing to $6,071, occupancy reaching a high of 54.0%, and ADRs peaking at $290.
- Conversely, the slowest single month of the year, typically falling within the low season, marks the market's lowest point. In this month, revenue might dip to $1,122, occupancy could drop to 11.8%, and ADRs may adjust down to $261.
- Understanding both the seasonal averages and these monthly peaks and troughs in revenue, occupancy, and ADR is crucial for maximizing your Airbnb profit potential in Navata.
Seasonal Strategies for Maximizing Profit
- Peak Season: Maximize revenue through premium pricing and potentially longer minimum stays. Ensure high availability.
- Low Season: Offer competitive pricing, special promotions (e.g., extended stay discounts), and flexible cancellation policies. Target off-season travelers like remote workers or budget-conscious guests.
- Shoulder Seasons: Implement dynamic pricing that balances peak and low rates. Target weekend travelers or specific events. Offer slightly more flexible terms than peak season.
- Regularly analyze your own performance against these Navata seasonality benchmarks and adjust your pricing and availability strategy accordingly.
Best Areas for Airbnb Investment in Navata (2025)
Exploring the top neighborhoods for short-term rentals in Navata? This section highlights key areas, outlining why they are attractive for hosts and guests, along with notable local attractions. Consider these locations based on your target guest profile and investment strategy.
| Neighborhood / Area | Why Host Here? (Target Guests & Appeal) | Key Attractions & Landmarks |
|---|---|---|
| Navata Village Center | Charming village atmosphere with historic architecture, quiet streets, and a close-knit community feel. Perfect for guests looking to experience authentic Catalan culture. | Church of Saint Peter, Navata's Castle, Local restaurants and cafes, Nature trails around the village |
| Golf Club Peralada | A beautiful golf destination attracting golf enthusiasts and tourists who appreciate luxury. Ideal for those looking for a peaceful getaway with access to high-quality golfing. | Golf Club Peralada, Wine tasting tours, Spas and wellness centers |
| Castelló d'Empúries | Nearby medieval town with rich history, narrow streets, and ancient buildings. Attractive for guests interested in history and culture, just a short drive from Navata. | Basilica de Santa Maria, Museu d'Historia Medieval, Cerca de la ciudad |
| Figueres | Home to the Dalí Theatre-Museum, this town is a major tourist draw. Perfect for Airbnb investors looking to attract cultural tourists exploring the genius of Salvador Dalí. | Dalí Theatre-Museum, Castell de Figueres, Local boutiques and eateries |
| Roses Beach | Popular beach destination along the Costa Brava with stunning views and a vibrant seaside ambiance. Attracts families and beach lovers, making it ideal for vacation rentals. | Roses Beach, Ciutadella de Roses, Water sports activities |
| Empuriabrava | Known as the 'Venice of Spain' for its canals, this neighborhood offers unique waterway access. Attracts tourists who enjoy sailing and water activities. | Canals and marinas, Water sports, Restaurants with canal views |
| La Jonquera | Border town known for its shopping and proximity to France. Potential for attracting shoppers and those looking for cross-border experiences. | Shopping centers, Cross-border restaurants |
| Parc Natural dels Aiguamolls de l'Empordà | Rich in biodiversity and scenic landscapes, this natural park attracts nature lovers, bird watchers, and tourists looking for outdoor activities. | Bird watching, Hiking trails, Scenic picnic areas |
Understanding Airbnb License Requirements & STR Laws in Navata (2025)
Yes, Navata, Catalonia, Spain enforces high STR regulations. Obtaining a license and ensuring compliance is almost certainly required according to current 2025 STR laws. Always verify the latest short term rental regulations and Airbnb license requirements directly with local government authorities for Navata to ensure full compliance before hosting.
(Source: AirROI data, 2025, based on 57% licensed listings)
Top Performing Airbnb Properties in Navata (2025)
Benchmark your potential! Explore examples of top-performing Airbnb properties in Navatabased on Trailing Twelve Month (TTM) revenue. Analyze their characteristics, revenue, occupancy rate, and ADR to understand what drives success in this market.

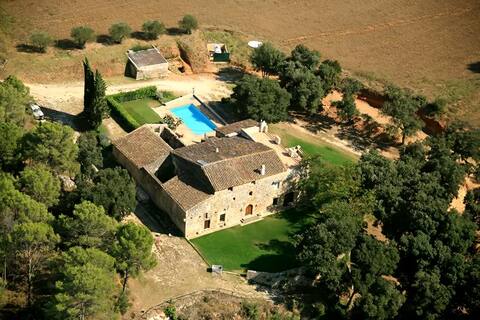
Mas Creus
Entire Place • 7 bedrooms
Can Borras_Luxury Villa _(weekly/summer) 14+2 pax
Entire Place • 6 bedrooms
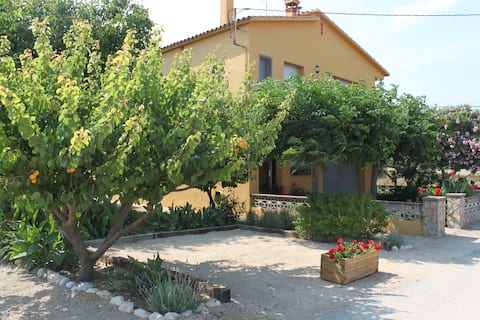
Cozy and quiet cottage
Entire Place • 5 bedrooms
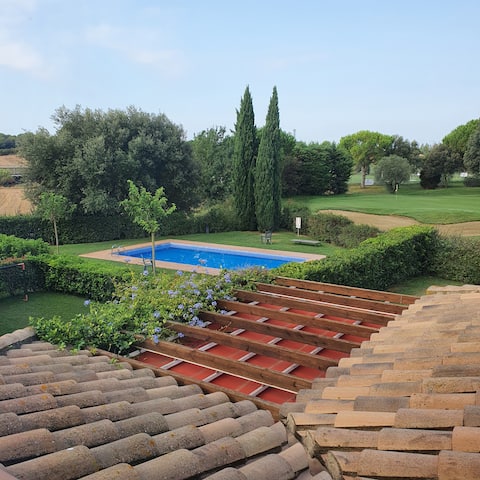
Beautiful Finca on golf course in Catalonia
Entire Place • 3 bedrooms
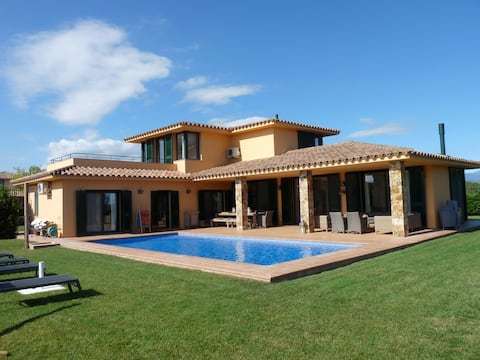
Acogedora Villa Marta en golf
Entire Place • 3 bedrooms
Masia en el Alt Empordà
Entire Place • 5 bedrooms
Note: Performance varies based on location, size, amenities, seasonality, and management quality. Data reflects the past 12 months.
Top Performing Airbnb Hosts in Navata (2025)
Learn from the best! This table showcases top-performing Airbnb hosts in Navata based on the number of properties managed and estimated total revenue over the past year. Analyze their scale and performance metrics.
| Host Name | Properties | Grossing Revenue | Stay Reviews | Avg Rating |
|---|---|---|---|---|
| Zack | 1 | $113,734 | 130 | 4.94/5.0 |
| Laura | 1 | $77,004 | 41 | 4.85/5.0 |
| Empordà Villas | 5 | $52,610 | 11 | 2.85/5.0 |
| Mireia | 1 | $39,620 | 33 | 4.91/5.0 |
| Ellen | 1 | $27,657 | 8 | 4.88/5.0 |
| Host #163414806 | 1 | $27,463 | 0 | 0.00/5.0 |
| Eugénie | 2 | $25,985 | 81 | 4.86/5.0 |
| Carlos | 1 | $25,940 | 11 | 4.64/5.0 |
| Host #168692752 | 1 | $19,654 | 0 | 0.00/5.0 |
| Carme | 1 | $18,600 | 17 | 5.00/5.0 |
Analyzing the strategies of top hosts, such as their property selection, pricing, and guest communication, can offer valuable lessons for optimizing your own Airbnb operations in Navata.
Dive Deeper: Advanced Navata STR Market Data (2025)
Ready to unlock more insights? AirROI provides access to advanced metrics and comprehensive Airbnb data for Navata. Explore detailed analytics beyond this report to refine your investment strategy, optimize pricing, and maximize your vacation rental profits.
Explore Advanced MetricsNavata Short-Term Rental Market Composition (2025): Property & Room Types
Room Type Distribution
Property Type Distribution
Market Composition Insights for Navata
- The Navata Airbnb market composition is heavily skewed towards Entire Home/Apt listings, which make up 95.2% of the 21 active rentals. This indicates strong guest preference for privacy and space.
- Looking at the property type distribution in Navata, House properties are the most common (95.2%), reflecting the local real estate landscape.
- Houses represent a significant 95.2% portion, catering likely to families or larger groups.
- Smaller segments like apartment/condo (combined 4.8%) offer potential for unique stay experiences.
Navata Airbnb Room Capacity Analysis (2025): Bedroom Distribution
Distribution of Listings by Number of Bedrooms
Room Capacity Insights for Navata
- The dominant room capacity in Navata is 3 bedrooms listings, making up 42.9% of the market. This suggests a strong demand for properties suitable for families or small groups.
- Together, 3 bedrooms and 5+ bedrooms properties represent 61.9% of the active Airbnb listings in Navata, indicating a high concentration in these sizes.
- A significant 76.2% of listings offer 3+ bedrooms, catering to larger groups and families seeking more space in Navata.
Navata Vacation Rental Guest Capacity Trends (2025)
Distribution of Listings by Guest Capacity
Guest Capacity Insights for Navata
- The most common guest capacity trend in Navata vacation rentals is listings accommodating 8+ guests (33.3%). This suggests the primary traveler segment is likely larger groups.
- Properties designed for 8+ guests and 6 guests dominate the Navata STR market, accounting for 61.9% of listings.
- 66.7% of properties accommodate 6+ guests, serving the market segment for larger families or group travel in Navata.
- On average, properties in Navata are equipped to host 6.0 guests.
Navata Airbnb Booking Patterns (2025): Available vs. Booked Days
Available Days Distribution
Booked Days Distribution
Booking Pattern Insights for Navata
- The most common availability pattern in Navata falls within the 271-366 days range, representing 66.7% of listings. This suggests many properties have significant open periods on their calendars.
- Approximately 95.3% of listings show high availability (181+ days open annually), indicating potential for increased bookings or specific owner usage patterns.
- For booked days, the 31-90 days range is most frequent in Navata (42.9%), reflecting common guest stay durations or potential owner blocking patterns.
- A notable 4.8% of properties secure long booking periods (181+ days booked per year), highlighting successful long-term rental strategies or significant owner usage.
Navata Airbnb Minimum Stay Requirements Analysis
Distribution of Listings by Minimum Night Requirement
1 Night
3 listings
15.8% of total
2 Nights
5 listings
26.3% of total
3 Nights
4 listings
21.1% of total
4-6 Nights
3 listings
15.8% of total
7-29 Nights
3 listings
15.8% of total
30+ Nights
1 listings
5.3% of total
Key Insights
- The most prevalent minimum stay requirement in Navata is 2 Nights, adopted by 26.3% of listings. This highlights the market's preference for shorter, flexible bookings.
Recommendations
- Align with the market by considering a 2 Nights minimum stay, as 26.3% of Navata hosts use this setting.
- If feasible, allowing 1-night stays, especially midweek or during low season, could capture last-minute bookings, as only 15.8% currently do.
- Explore offering discounts for stays of 30+ nights to attract the 5.3% of the market seeking extended stays.
- Adjust minimum nights based on seasonality – potentially shorter during low season and longer during peak demand periods in Navata.
Navata Airbnb Cancellation Policy Trends Analysis (2025)
Flexible
3 listings
21.4% of total
Moderate
1 listings
7.1% of total
Firm
2 listings
14.3% of total
Strict
8 listings
57.1% of total
Cancellation Policy Insights for Navata
- The prevailing Airbnb cancellation policy trend in Navata is Strict, used by 57.1% of listings.
- A majority (71.4%) of hosts in Navata utilize Firm or Strict policies, indicating a market where hosts prioritize booking security.
Recommendations for Hosts
- Consider adopting a Strict policy to align with the 57.1% market standard in Navata.
- With 57.1% using Strict terms, this is a viable option in Navata, particularly for high-value properties or during peak demand periods.
- Regularly review your cancellation policy against competitors and market demand shifts in Navata.
Navata STR Booking Lead Time Analysis (2025)
Average Booking Lead Time by Month
Booking Lead Time Insights for Navata
- The overall average booking lead time for vacation rentals in Navata is 56 days.
- Guests book furthest in advance for stays during July (average 99 days), likely coinciding with peak travel demand or local events.
- The shortest booking windows occur for stays in March (average 17 days), indicating more last-minute travel plans during this time.
- Seasonally, Summer (84 days avg.) sees the longest lead times, while Winter (50 days avg.) has the shortest, reflecting typical travel planning cycles.
Recommendations for Hosts
- Use the overall average lead time (56 days) as a baseline for your pricing and availability strategy in Navata.
- For July stays, consider implementing length-of-stay discounts or slightly higher rates for bookings made less than 99 days out to capitalize on advance planning.
- Target marketing efforts for the Summer season well in advance (at least 84 days) to capture early planners.
- Monitor your own booking lead times against these Navata averages to identify opportunities for dynamic pricing adjustments.
Popular & Essential Airbnb Amenities in Navata (2025)
Amenity Prevalence
Amenity Insights for Navata
- Essential amenities in Navata that guests expect include: Heating, TV, Essentials, Wifi, Kitchen. Lacking these (any) could significantly impact bookings.
- Popular amenities like Washer, Free parking on premises, Hot water are common but not universal. Offering these can provide a competitive edge.
Recommendations for Hosts
- Ensure your listing includes all essential amenities for Navata: Heating, TV, Essentials, Wifi, Kitchen.
- Prioritize adding missing essentials: TV, Essentials, Wifi, Kitchen.
- Consider adding popular differentiators like Washer or Free parking on premises to increase appeal.
- Highlight unique or less common amenities you offer (e.g., hot tub, dedicated workspace, EV charger) in your listing description and photos.
- Regularly check competitor amenities in Navata to stay competitive.
Navata Airbnb Guest Demographics & Profile Analysis (2025)
Guest Profile Summary for Navata
- The typical guest profile for Airbnb in Navata consists of predominantly international visitors (74%), with top international origins including Spain, typically belonging to the Post-2000s (Gen Z/Alpha) group (50%), primarily speaking English or Spanish.
- Domestic travelers account for 26.1% of guests.
- Key international markets include France (32.6%) and Spain (26.1%).
- Top languages spoken are English (31.7%) followed by Spanish (22%).
- A significant demographic segment is the Post-2000s (Gen Z/Alpha) group, representing 50% of guests.
Recommendations for Hosts
- Focus marketing internationally, particularly towards travelers from Spain.
- Tailor amenities and listing descriptions to appeal to the dominant Post-2000s (Gen Z/Alpha) demographic (e.g., highlight fast WiFi, smart home features, local guides).
- Highlight unique local experiences or amenities relevant to the primary guest profile.
- Consider seasonal promotions aligned with peak travel times for key origin markets.
Nearby Short-Term Rental Market Comparison
How does the Navata Airbnb market stack up against its neighbors? Compare key performance metrics like average monthly revenue, ADR, and occupancy rates in surrounding areas to understand the broader regional STR landscape.
| Market | Active Properties | Monthly Revenue | Daily Rate | Avg. Occupancy |
|---|---|---|---|---|
| Vall-llobrega | 15 | $10,261 | $798.88 | 44% |
| Canyelles | 49 | $5,958 | $1023.94 | 37% |
| Arenys de Munt | 28 | $5,100 | $514.27 | 41% |
| Teià | 25 | $5,027 | $348.45 | 45% |
| Cornellà del Terri | 17 | $4,960 | $460.96 | 41% |
| Tiana | 12 | $4,955 | $299.97 | 48% |
| Amer | 10 | $4,848 | $397.58 | 40% |
| Bescanó | 11 | $4,761 | $445.38 | 41% |
| Porqueres | 12 | $4,714 | $469.05 | 36% |
| Premià de Dalt | 28 | $4,630 | $345.43 | 49% |