Lloret de Mar Airbnb Market Analysis 2025: Short Term Rental Data & Vacation Rental Statistics in Catalonia, Spain
Is Airbnb profitable in Lloret de Mar in 2025? Explore comprehensive Airbnb analytics for Lloret de Mar, Catalonia, Spain to uncover income potential. This 2025 STR market report for Lloret de Mar, based on AirROI data from April 2024 to March 2025, reveals key trends in the bustling market of 1,137 active listings.
Whether you're considering an Airbnb investment in Lloret de Mar, optimizing your existing vacation rental, or exploring rental arbitrage opportunities, understanding the Lloret de Mar Airbnb data is crucial. Navigating the high regulation landscape is key to maximizing your short term rental income potential. Let's dive into the specifics.
Key Lloret de Mar Airbnb Performance Metrics Overview
Monthly Airbnb Revenue Variations & Income Potential in Lloret de Mar (2025)
Understanding the monthly revenue variations for Airbnb listings in Lloret de Mar is key to maximizing your short term rental income potential. Seasonality significantly impacts earnings. Our analysis, based on data from the past 12 months, shows that the peak revenue month for STRs in Lloret de Mar is typically August, while January often presents the lowest earnings, highlighting opportunities for strategic pricing adjustments during shoulder and low seasons. Explore the typical Airbnb income in Lloret de Mar across different performance tiers:
- Best-in-class properties (Top 10%) achieve $5,366+ monthly, often utilizing dynamic pricing and superior guest experiences.
- Strong performing properties (Top 25%) earn $3,043 or more, indicating effective management and desirable locations/amenities.
- Typical properties (Median) generate around $1,659 per month, representing the average market performance.
- Entry-level properties (Bottom 25%) see earnings around $875, often with potential for optimization.
Average Monthly Airbnb Earnings Trend in Lloret de Mar
Lloret de Mar Airbnb Occupancy Rate Trends (2025)
Maximize your bookings by understanding the Lloret de Mar STR occupancy trends. Seasonal demand shifts significantly influence how often properties are booked. Typically, Augustsees the highest demand (peak season occupancy), while January experiences the lowest (low season). Effective strategies, like adjusting minimum stays or offering promotions, can boost occupancy during slower periods. Here's how different property tiers perform in Lloret de Mar:
- Best-in-class properties (Top 10%) achieve 74%+ occupancy, indicating high desirability and potentially optimized availability.
- Strong performing properties (Top 25%) maintain 55% or higher occupancy, suggesting good market fit and guest satisfaction.
- Typical properties (Median) have an occupancy rate around 34%.
- Entry-level properties (Bottom 25%) average 17% occupancy, potentially facing higher vacancy.
Average Monthly Occupancy Rate Trend in Lloret de Mar
Average Daily Rate (ADR) Airbnb Trends in Lloret de Mar (2025)
Effective short term rental pricing strategy in Lloret de Mar involves understanding monthly ADR fluctuations. The Average Daily Rate (ADR) for Airbnb in Lloret de Mar typically peaks in August and dips lowest during March. Leveraging Airbnb dynamic pricing tools or strategies based on this seasonality can significantly boost revenue. Here's a look at the typical nightly rates achieved:
- Best-in-class properties (Top 10%) command rates of $454+ per night, often due to premium features or locations.
- Strong performing properties (Top 25%) achieve nightly rates of $264 or more.
- Typical properties (Median) charge around $149 per night.
- Entry-level properties (Bottom 25%) earn around $97 per night.
Average Daily Rate (ADR) Trend by Month in Lloret de Mar
Get Live Lloret de Mar Market Intelligence 👇

Explore Real-time Analytics
Airbnb Seasonality Analysis & Trends in Lloret de Mar (2025)
Peak Season (August, July, June)
- Revenue averages $4,677 per month
- Occupancy rates average 55.9%
- Daily rates average $266
Shoulder Season
- Revenue averages $2,135 per month
- Occupancy maintains around 34.7%
- Daily rates hold near $223
Low Season (January, February, March)
- Revenue drops to average $952 per month
- Occupancy decreases to average 24.9%
- Daily rates adjust to average $197
Seasonality Insights for Lloret de Mar
- The Airbnb seasonality in Lloret de Mar shows highly seasonal trends requiring careful strategy. While the sections above show seasonal averages, it's also insightful to look at the extremes:
- During the high season, the absolute peak month showcases Lloret de Mar's highest earning potential, with monthly revenues capable of climbing to $5,515, occupancy reaching a high of 66.6%, and ADRs peaking at $273.
- Conversely, the slowest single month of the year, typically falling within the low season, marks the market's lowest point. In this month, revenue might dip to $920, occupancy could drop to 22.7%, and ADRs may adjust down to $193.
- Understanding both the seasonal averages and these monthly peaks and troughs in revenue, occupancy, and ADR is crucial for maximizing your Airbnb profit potential in Lloret de Mar.
Seasonal Strategies for Maximizing Profit
- Peak Season: Maximize revenue through premium pricing and potentially longer minimum stays. Ensure high availability.
- Low Season: Offer competitive pricing, special promotions (e.g., extended stay discounts), and flexible cancellation policies. Target off-season travelers like remote workers or budget-conscious guests.
- Shoulder Seasons: Implement dynamic pricing that balances peak and low rates. Target weekend travelers or specific events. Offer slightly more flexible terms than peak season.
- Regularly analyze your own performance against these Lloret de Mar seasonality benchmarks and adjust your pricing and availability strategy accordingly.
Best Areas for Airbnb Investment in Lloret de Mar (2025)
Exploring the top neighborhoods for short-term rentals in Lloret de Mar? This section highlights key areas, outlining why they are attractive for hosts and guests, along with notable local attractions. Consider these locations based on your target guest profile and investment strategy.
| Neighborhood / Area | Why Host Here? (Target Guests & Appeal) | Key Attractions & Landmarks |
|---|---|---|
| Fenals Beach | A beautiful, family-friendly beach area with a relaxed atmosphere, making it ideal for vacation rentals. Close to bars, restaurants, and the water park. | Fenals Beach, Water World, Santa Clotilde Gardens, Lloret de Mar Water Park, Cala Boadella |
| Lloret de Mar Town Center | The heart of Lloret de Mar filled with shops, restaurants, and nightlife. Attracts a diverse crowd looking to enjoy the local culture and entertainment. | Lloret de Mar Beach, Parish Church of Sant Romà, Carrer de Joana de Vall, Nightclubs and bars, Shopping streets |
| Sa Caleta | A picturesque cove known for its charming beach and proximity to the castle. Great for visitors seeking a quieter beach experience away from the crowds. | Sa Caleta Beach, Castle of Sant Joan, Walks along the coastal paths, Scenic views, Local seafood restaurants |
| Cala Canyelles | A stunning beach location that offers a more exclusive vibe with beautiful views and upscale properties, attracting visitors looking for luxury accommodations. | Cala Canyelles Beach, Yacht harbor, Walking trails, Scenic lookout points, Restaurants with ocean views |
| Blanes | Nearby coastal town with beautiful beaches and gardens. Lloret de Mar visitors often explore Blanes as well, making it a great area for short-term rentals. | Blanes Beach, Marimurtra Botanical Garden, Santa Cristina Beach, Blanes Castle, Local markets |
| Montbatllar | A quieter residential area offering stunning views over the sea and nature. Attractive to families and groups looking for a peaceful getaway. | Scenic viewpoints, Hiking trails, Natural parks, Local cuisine, Proximity to Lloret de Mar |
| Carrer de la Costa | Located near beaches and the local nightlife, this area is buzzing with energy and ideal for young travelers seeking an exciting vacation experience. | Lloret de Mar Beach, Bars and clubs, Shops and cafes, Water sports, Central parks |
| Santa Clotilde Gardens | A beautifully landscaped area featuring historic gardens, perfect for visitors who appreciate nature and aesthetics. A unique nearby attraction for those staying in Lloret. | Santa Clotilde Gardens, Natural viewpoints, Coastal walks, Picnic areas, Historic architecture |
Understanding Airbnb License Requirements & STR Laws in Lloret de Mar (2025)
Yes, Lloret de Mar, Catalonia, Spain enforces high STR regulations. Obtaining a license and ensuring compliance is almost certainly required according to current 2025 STR laws. Always verify the latest short term rental regulations and Airbnb license requirements directly with local government authorities for Lloret de Mar to ensure full compliance before hosting.
(Source: AirROI data, 2025, based on 82% licensed listings)
Top Performing Airbnb Properties in Lloret de Mar (2025)
Benchmark your potential! Explore examples of top-performing Airbnb properties in Lloret de Marbased on Trailing Twelve Month (TTM) revenue. Analyze their characteristics, revenue, occupancy rate, and ADR to understand what drives success in this market.
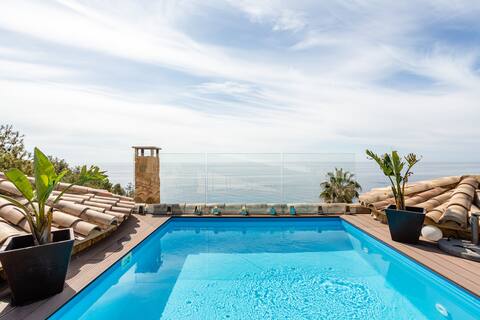
Villa with Infinity pool
Entire Place • 4 bedrooms
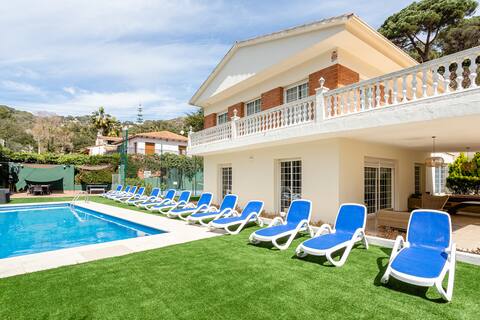
Ainara Luxury
Entire Place • 7 bedrooms
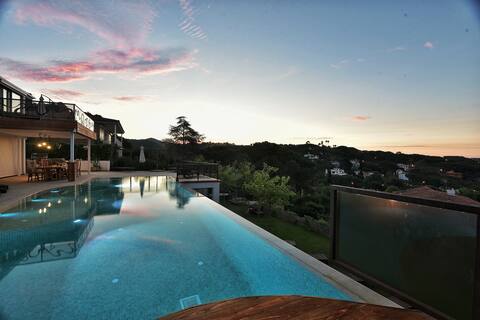
Villa Tuzko , sea view Vila with pool and cinema
Entire Place • 7 bedrooms
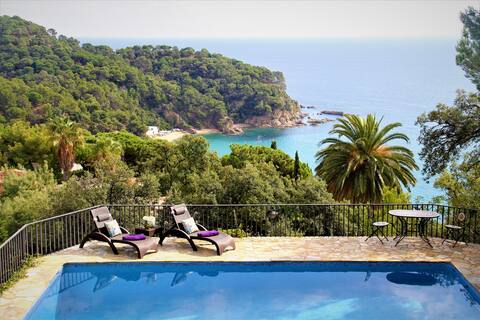
Villa Can Toni - Luxury By The Sea
Entire Place • 7 bedrooms

Villa Fluvia: 1200m city, swimming pool, sea view
Entire Place • 9 bedrooms
Villa Ainara luxury,with sports area Lloret de mar
Entire Place • 7 bedrooms
Note: Performance varies based on location, size, amenities, seasonality, and management quality. Data reflects the past 12 months.
Top Performing Airbnb Hosts in Lloret de Mar (2025)
Learn from the best! This table showcases top-performing Airbnb hosts in Lloret de Mar based on the number of properties managed and estimated total revenue over the past year. Analyze their scale and performance metrics.
| Host Name | Properties | Grossing Revenue | Stay Reviews | Avg Rating |
|---|---|---|---|---|
| Marie | 22 | $883,532 | 211 | 4.08/5.0 |
| Lloret Holiday | 52 | $873,807 | 790 | 3.70/5.0 |
| Sebastien - Interhome Group | 32 | $674,818 | 189 | 3.30/5.0 |
| Anna Margarita | 9 | $670,568 | 113 | 4.14/5.0 |
| Drs | 24 | $602,731 | 329 | 4.28/5.0 |
| Apartaments | 39 | $459,696 | 398 | 4.03/5.0 |
| Carolina | 16 | $413,665 | 135 | 3.90/5.0 |
| Verónica | 22 | $372,898 | 387 | 4.42/5.0 |
| Esther | 16 | $348,613 | 157 | 3.85/5.0 |
| RentStanLloret | 17 | $341,981 | 276 | 4.07/5.0 |
Analyzing the strategies of top hosts, such as their property selection, pricing, and guest communication, can offer valuable lessons for optimizing your own Airbnb operations in Lloret de Mar.
Dive Deeper: Advanced Lloret de Mar STR Market Data (2025)
Ready to unlock more insights? AirROI provides access to advanced metrics and comprehensive Airbnb data for Lloret de Mar. Explore detailed analytics beyond this report to refine your investment strategy, optimize pricing, and maximize your vacation rental profits.
Explore Advanced MetricsLloret de Mar Short-Term Rental Market Composition (2025): Property & Room Types
Room Type Distribution
Property Type Distribution
Market Composition Insights for Lloret de Mar
- The Lloret de Mar Airbnb market composition is heavily skewed towards Entire Home/Apt listings, which make up 92.6% of the 1,137 active rentals. This indicates strong guest preference for privacy and space.
- Looking at the property type distribution in Lloret de Mar, Apartment/Condo properties are the most common (63.9%), reflecting the local real estate landscape.
- Houses represent a significant 31% portion, catering likely to families or larger groups.
- Smaller segments like hotel/boutique, others (combined 5.2%) offer potential for unique stay experiences.
Lloret de Mar Airbnb Room Capacity Analysis (2025): Bedroom Distribution
Distribution of Listings by Number of Bedrooms
Room Capacity Insights for Lloret de Mar
- The dominant room capacity in Lloret de Mar is 1 bedroom listings, making up 38.1% of the market. This suggests a strong demand for properties suitable for couples or solo travelers.
- Together, 1 bedroom and 2 bedrooms properties represent 61.4% of the active Airbnb listings in Lloret de Mar, indicating a high concentration in these sizes.
- A significant 34.3% of listings offer 3+ bedrooms, catering to larger groups and families seeking more space in Lloret de Mar.
Lloret de Mar Vacation Rental Guest Capacity Trends (2025)
Distribution of Listings by Guest Capacity
Guest Capacity Insights for Lloret de Mar
- The most common guest capacity trend in Lloret de Mar vacation rentals is listings accommodating 4 guests (31.4%). This suggests the primary traveler segment is likely small families or groups.
- Properties designed for 4 guests and 8+ guests dominate the Lloret de Mar STR market, accounting for 55.5% of listings.
- 43.0% of properties accommodate 6+ guests, serving the market segment for larger families or group travel in Lloret de Mar.
- On average, properties in Lloret de Mar are equipped to host 5.1 guests.
Lloret de Mar Airbnb Booking Patterns (2025): Available vs. Booked Days
Available Days Distribution
Booked Days Distribution
Booking Pattern Insights for Lloret de Mar
- The most common availability pattern in Lloret de Mar falls within the 271-366 days range, representing 56.9% of listings. This suggests many properties have significant open periods on their calendars.
- Approximately 90.8% of listings show high availability (181+ days open annually), indicating potential for increased bookings or specific owner usage patterns.
- For booked days, the 31-90 days range is most frequent in Lloret de Mar (38.3%), reflecting common guest stay durations or potential owner blocking patterns.
- A notable 10.2% of properties secure long booking periods (181+ days booked per year), highlighting successful long-term rental strategies or significant owner usage.
Lloret de Mar Airbnb Minimum Stay Requirements Analysis
Distribution of Listings by Minimum Night Requirement
1 Night
166 listings
15.6% of total
2 Nights
259 listings
24.4% of total
3 Nights
176 listings
16.6% of total
4-6 Nights
198 listings
18.6% of total
7-29 Nights
106 listings
10% of total
30+ Nights
158 listings
14.9% of total
Key Insights
- The most prevalent minimum stay requirement in Lloret de Mar is 2 Nights, adopted by 24.4% of listings. This highlights the market's preference for shorter, flexible bookings.
- A significant segment (14.9%) caters to monthly stays (30+ nights) in Lloret de Mar, pointing to opportunities in the extended-stay market.
Recommendations
- Align with the market by considering a 2 Nights minimum stay, as 24.4% of Lloret de Mar hosts use this setting.
- If feasible, allowing 1-night stays, especially midweek or during low season, could capture last-minute bookings, as only 15.6% currently do.
- Explore offering discounts for stays of 30+ nights to attract the 14.9% of the market seeking extended stays.
- Adjust minimum nights based on seasonality – potentially shorter during low season and longer during peak demand periods in Lloret de Mar.
Lloret de Mar Airbnb Cancellation Policy Trends Analysis (2025)
Super Strict 30 Days
59 listings
6% of total
Super Strict 60 Days
36 listings
3.7% of total
Flexible
95 listings
9.7% of total
Moderate
170 listings
17.4% of total
Firm
241 listings
24.6% of total
Strict
378 listings
38.6% of total
Cancellation Policy Insights for Lloret de Mar
- The prevailing Airbnb cancellation policy trend in Lloret de Mar is Strict, used by 38.6% of listings.
- A majority (63.2%) of hosts in Lloret de Mar utilize Firm or Strict policies, indicating a market where hosts prioritize booking security.
Recommendations for Hosts
- Consider adopting a Strict policy to align with the 38.6% market standard in Lloret de Mar.
- With 38.6% using Strict terms, this is a viable option in Lloret de Mar, particularly for high-value properties or during peak demand periods.
- Regularly review your cancellation policy against competitors and market demand shifts in Lloret de Mar.
Lloret de Mar STR Booking Lead Time Analysis (2025)
Average Booking Lead Time by Month
Booking Lead Time Insights for Lloret de Mar
- The overall average booking lead time for vacation rentals in Lloret de Mar is 67 days.
- Guests book furthest in advance for stays during July (average 112 days), likely coinciding with peak travel demand or local events.
- The shortest booking windows occur for stays in February (average 32 days), indicating more last-minute travel plans during this time.
- Seasonally, Summer (99 days avg.) sees the longest lead times, while Winter (38 days avg.) has the shortest, reflecting typical travel planning cycles.
Recommendations for Hosts
- Use the overall average lead time (67 days) as a baseline for your pricing and availability strategy in Lloret de Mar.
- For July stays, consider implementing length-of-stay discounts or slightly higher rates for bookings made less than 112 days out to capitalize on advance planning.
- Target marketing efforts for the Summer season well in advance (at least 99 days) to capture early planners.
- Monitor your own booking lead times against these Lloret de Mar averages to identify opportunities for dynamic pricing adjustments.
Popular & Essential Airbnb Amenities in Lloret de Mar (2025)
Amenity Prevalence
Amenity Insights for Lloret de Mar
- Essential amenities in Lloret de Mar that guests expect include: TV, Wifi. Lacking these (any) could significantly impact bookings.
- Popular amenities like Kitchen, Hot water, Washer are common but not universal. Offering these can provide a competitive edge.
Recommendations for Hosts
- Ensure your listing includes all essential amenities for Lloret de Mar: TV, Wifi.
- Prioritize adding missing essentials: TV, Wifi.
- Consider adding popular differentiators like Kitchen or Hot water to increase appeal.
- Highlight unique or less common amenities you offer (e.g., hot tub, dedicated workspace, EV charger) in your listing description and photos.
- Regularly check competitor amenities in Lloret de Mar to stay competitive.
Lloret de Mar Airbnb Guest Demographics & Profile Analysis (2025)
Guest Profile Summary for Lloret de Mar
- The typical guest profile for Airbnb in Lloret de Mar consists of predominantly international visitors (88%), with top international origins including Spain, typically belonging to the Post-2000s (Gen Z/Alpha) group (50%), primarily speaking English or French.
- Domestic travelers account for 11.7% of guests.
- Key international markets include France (41.1%) and Spain (11.7%).
- Top languages spoken are English (33.9%) followed by French (22.1%).
- A significant demographic segment is the Post-2000s (Gen Z/Alpha) group, representing 50% of guests.
Recommendations for Hosts
- Focus marketing internationally, particularly towards travelers from Spain.
- Tailor amenities and listing descriptions to appeal to the dominant Post-2000s (Gen Z/Alpha) demographic (e.g., highlight fast WiFi, smart home features, local guides).
- Highlight unique local experiences or amenities relevant to the primary guest profile.
- Consider seasonal promotions aligned with peak travel times for key origin markets.
Nearby Short-Term Rental Market Comparison
How does the Lloret de Mar Airbnb market stack up against its neighbors? Compare key performance metrics like average monthly revenue, ADR, and occupancy rates in surrounding areas to understand the broader regional STR landscape.
| Market | Active Properties | Monthly Revenue | Daily Rate | Avg. Occupancy |
|---|---|---|---|---|
| Vall-llobrega | 15 | $10,261 | $798.88 | 44% |
| Canyelles | 49 | $5,958 | $1023.94 | 37% |
| Arenys de Munt | 28 | $5,100 | $514.27 | 41% |
| Teià | 25 | $5,027 | $348.45 | 45% |
| Cornellà del Terri | 17 | $4,960 | $460.96 | 41% |
| Tiana | 12 | $4,955 | $299.97 | 48% |
| Amer | 10 | $4,848 | $397.58 | 40% |
| Bescanó | 11 | $4,761 | $445.38 | 41% |
| Porqueres | 12 | $4,714 | $469.05 | 36% |
| Premià de Dalt | 28 | $4,630 | $345.43 | 49% |