Castelldefels Airbnb Market Analysis 2025: Short Term Rental Data & Vacation Rental Statistics in Catalonia, Spain
Is Airbnb profitable in Castelldefels in 2025? Explore comprehensive Airbnb analytics for Castelldefels, Catalonia, Spain to uncover income potential. This 2025 STR market report for Castelldefels, based on AirROI data from April 2024 to March 2025, reveals key trends in the market of 367 active listings.
Whether you're considering an Airbnb investment in Castelldefels, optimizing your existing vacation rental, or exploring rental arbitrage opportunities, understanding the Castelldefels Airbnb data is crucial. Navigating the high regulation landscape is key to maximizing your short term rental income potential. Let's dive into the specifics.
Key Castelldefels Airbnb Performance Metrics Overview
Monthly Airbnb Revenue Variations & Income Potential in Castelldefels (2025)
Understanding the monthly revenue variations for Airbnb listings in Castelldefels is key to maximizing your short term rental income potential. Seasonality significantly impacts earnings. Our analysis, based on data from the past 12 months, shows that the peak revenue month for STRs in Castelldefels is typically August, while January often presents the lowest earnings, highlighting opportunities for strategic pricing adjustments during shoulder and low seasons. Explore the typical Airbnb income in Castelldefels across different performance tiers:
- Best-in-class properties (Top 10%) achieve $6,711+ monthly, often utilizing dynamic pricing and superior guest experiences.
- Strong performing properties (Top 25%) earn $4,476 or more, indicating effective management and desirable locations/amenities.
- Typical properties (Median) generate around $2,632 per month, representing the average market performance.
- Entry-level properties (Bottom 25%) see earnings around $1,362, often with potential for optimization.
Average Monthly Airbnb Earnings Trend in Castelldefels
Castelldefels Airbnb Occupancy Rate Trends (2025)
Maximize your bookings by understanding the Castelldefels STR occupancy trends. Seasonal demand shifts significantly influence how often properties are booked. Typically, Julysees the highest demand (peak season occupancy), while January experiences the lowest (low season). Effective strategies, like adjusting minimum stays or offering promotions, can boost occupancy during slower periods. Here's how different property tiers perform in Castelldefels:
- Best-in-class properties (Top 10%) achieve 90%+ occupancy, indicating high desirability and potentially optimized availability.
- Strong performing properties (Top 25%) maintain 76% or higher occupancy, suggesting good market fit and guest satisfaction.
- Typical properties (Median) have an occupancy rate around 53%.
- Entry-level properties (Bottom 25%) average 28% occupancy, potentially facing higher vacancy.
Average Monthly Occupancy Rate Trend in Castelldefels
Average Daily Rate (ADR) Airbnb Trends in Castelldefels (2025)
Effective short term rental pricing strategy in Castelldefels involves understanding monthly ADR fluctuations. The Average Daily Rate (ADR) for Airbnb in Castelldefels typically peaks in August and dips lowest during January. Leveraging Airbnb dynamic pricing tools or strategies based on this seasonality can significantly boost revenue. Here's a look at the typical nightly rates achieved:
- Best-in-class properties (Top 10%) command rates of $347+ per night, often due to premium features or locations.
- Strong performing properties (Top 25%) achieve nightly rates of $222 or more.
- Typical properties (Median) charge around $145 per night.
- Entry-level properties (Bottom 25%) earn around $95 per night.
Average Daily Rate (ADR) Trend by Month in Castelldefels
Get Live Castelldefels Market Intelligence 👇

Explore Real-time Analytics
Airbnb Seasonality Analysis & Trends in Castelldefels (2025)
Peak Season (August, July, May)
- Revenue averages $4,811 per month
- Occupancy rates average 63.3%
- Daily rates average $211
Shoulder Season
- Revenue averages $3,264 per month
- Occupancy maintains around 52.1%
- Daily rates hold near $188
Low Season (January, February, March)
- Revenue drops to average $1,852 per month
- Occupancy decreases to average 41.0%
- Daily rates adjust to average $162
Seasonality Insights for Castelldefels
- The Airbnb seasonality in Castelldefels shows highly seasonal trends requiring careful strategy. While the sections above show seasonal averages, it's also insightful to look at the extremes:
- During the high season, the absolute peak month showcases Castelldefels's highest earning potential, with monthly revenues capable of climbing to $5,140, occupancy reaching a high of 65.6%, and ADRs peaking at $217.
- Conversely, the slowest single month of the year, typically falling within the low season, marks the market's lowest point. In this month, revenue might dip to $1,766, occupancy could drop to 38.6%, and ADRs may adjust down to $158.
- Understanding both the seasonal averages and these monthly peaks and troughs in revenue, occupancy, and ADR is crucial for maximizing your Airbnb profit potential in Castelldefels.
Seasonal Strategies for Maximizing Profit
- Peak Season: Maximize revenue through premium pricing and potentially longer minimum stays. Ensure high availability.
- Low Season: Offer competitive pricing, special promotions (e.g., extended stay discounts), and flexible cancellation policies. Target off-season travelers like remote workers or budget-conscious guests.
- Shoulder Seasons: Implement dynamic pricing that balances peak and low rates. Target weekend travelers or specific events. Offer slightly more flexible terms than peak season.
- Regularly analyze your own performance against these Castelldefels seasonality benchmarks and adjust your pricing and availability strategy accordingly.
Best Areas for Airbnb Investment in Castelldefels (2025)
Exploring the top neighborhoods for short-term rentals in Castelldefels? This section highlights key areas, outlining why they are attractive for hosts and guests, along with notable local attractions. Consider these locations based on your target guest profile and investment strategy.
| Neighborhood / Area | Why Host Here? (Target Guests & Appeal) | Key Attractions & Landmarks |
|---|---|---|
| Castelldefels Beach | Popular destination for its beautiful sandy beaches and vibrant seaside ambiance, attracting both domestic and international tourists looking for sun, sea, and relaxation. | Castelldefels Beach, BBeach Club, Water sports activities, Seafront promenade, Restaurants and bars along the beach |
| Castelldefels Castle | Historical site offering panoramic views and a unique cultural experience. Ideal for guests interested in history and scenic landscapes. | Castelldefels Castle, Stroll around the castle gardens, Cultural events at the castle, Nearby hiking trails |
| Platja de Garraf | Charming beach area known for its picturesque setting and tranquil environment, perfect for families and couples seeking a quiet getaway. | Platja de Garraf, Garraf Natural Park, Local seafood restaurants, Historical fishing village charm |
| Can Roca | Residential area with a local vibe, offering easy access to amenities and a quieter way of life. Great for long-term stays. | Local markets, Parks and recreational areas, Proximity to schools and services |
| Montemar | Family-friendly area with parks and proximity to the beach. Attractive for guests with children or those seeking a peaceful environment. | Montemar Beach, Parks, Family-friendly cafes and eateries, Close to public transport |
| Centrally Located Castelldefels | Vibrant urban area with a mix of locals and visitors. Great for those who want to experience the local culture and nightlife. | Shopping districts, Cafes and restaurants, Local markets, Proximity to transport links to Barcelona |
| Canyelles | A quieter area that offers a more rural experience with beautiful natural surroundings, appealing to nature lovers and hikers. | Hiking trails, Natural parks, Stunning views of the surrounding landscape |
| Platja de Castelldefels | A family-friendly beach area known for its activities and amenities. The beach is well-kept and offers something for everyone. | Beautiful sandy beaches, Parque de la Mediterráneo, Water sports facilities, Beach bars and restaurants |
Understanding Airbnb License Requirements & STR Laws in Castelldefels (2025)
Yes, Castelldefels, Catalonia, Spain enforces high STR regulations. Obtaining a license and ensuring compliance is almost certainly required according to current 2025 STR laws. Always verify the latest short term rental regulations and Airbnb license requirements directly with local government authorities for Castelldefels to ensure full compliance before hosting.
(Source: AirROI data, 2025, based on 71% licensed listings)
Top Performing Airbnb Properties in Castelldefels (2025)
Benchmark your potential! Explore examples of top-performing Airbnb properties in Castelldefelsbased on Trailing Twelve Month (TTM) revenue. Analyze their characteristics, revenue, occupancy rate, and ADR to understand what drives success in this market.
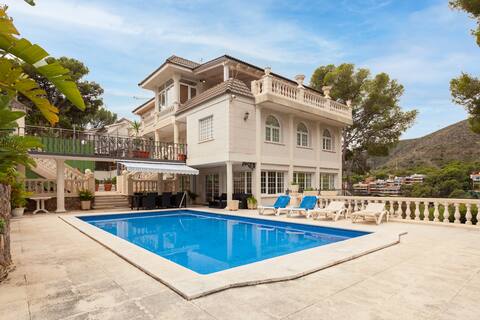
CASA DRAGO. Perfect for family vacations
Entire Place • 9 bedrooms
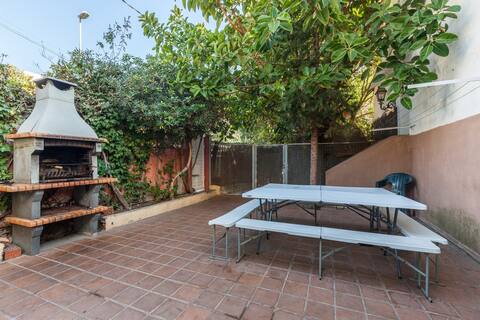
Familiar Verdaguer
Entire Place • 7 bedrooms

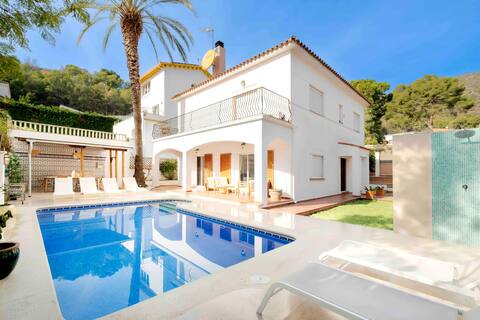
Renovated villa at the beach, just off Barcelona
Entire Place • 5 bedrooms

HHBCN Beach House Castelldefels #3
Entire Place • 4 bedrooms
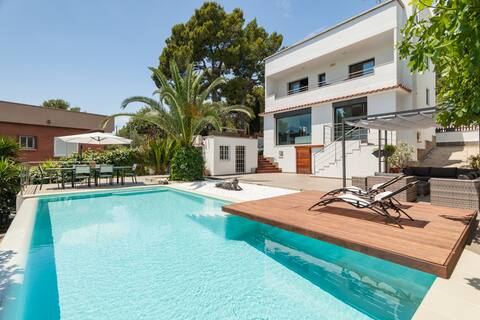
Villa w/Pool Just Renovated | Bellamar by Palmera
Entire Place • 5 bedrooms
A modern house with a swimming pool and a large garden.
Entire Place • 4 bedrooms
Note: Performance varies based on location, size, amenities, seasonality, and management quality. Data reflects the past 12 months.
Top Performing Airbnb Hosts in Castelldefels (2025)
Learn from the best! This table showcases top-performing Airbnb hosts in Castelldefels based on the number of properties managed and estimated total revenue over the past year. Analyze their scale and performance metrics.
| Host Name | Properties | Grossing Revenue | Stay Reviews | Avg Rating |
|---|---|---|---|---|
| Holiday Castelldefels | 24 | $1,268,567 | 475 | 3.20/5.0 |
| Apartamentos Azul | 25 | $1,152,134 | 134 | 3.24/5.0 |
| Laura Y Barbara | 20 | $431,470 | 533 | 2.70/5.0 |
| Apartamentos Balisse | 9 | $293,159 | 260 | 4.60/5.0 |
| Apartamentos Centric | 13 | $278,459 | 159 | 2.44/5.0 |
| Citytrip | 7 | $275,284 | 360 | 4.62/5.0 |
| Castell Beach | 7 | $227,373 | 1099 | 4.68/5.0 |
| Holidu | 2 | $215,164 | 24 | 4.46/5.0 |
| Holiday Castelldefels | 6 | $208,959 | 32 | 3.05/5.0 |
| Manuel | 5 | $193,347 | 172 | 4.78/5.0 |
Analyzing the strategies of top hosts, such as their property selection, pricing, and guest communication, can offer valuable lessons for optimizing your own Airbnb operations in Castelldefels.
Dive Deeper: Advanced Castelldefels STR Market Data (2025)
Ready to unlock more insights? AirROI provides access to advanced metrics and comprehensive Airbnb data for Castelldefels. Explore detailed analytics beyond this report to refine your investment strategy, optimize pricing, and maximize your vacation rental profits.
Explore Advanced MetricsCastelldefels Short-Term Rental Market Composition (2025): Property & Room Types
Room Type Distribution
Property Type Distribution
Market Composition Insights for Castelldefels
- The Castelldefels Airbnb market composition is heavily skewed towards Entire Home/Apt listings, which make up 85% of the 367 active rentals. This indicates strong guest preference for privacy and space.
- Looking at the property type distribution in Castelldefels, Apartment/Condo properties are the most common (77.1%), reflecting the local real estate landscape.
- Houses represent a significant 15.3% portion, catering likely to families or larger groups.
- Smaller segments like hotel/boutique, others, outdoor/unique, unique stays (combined 7.6%) offer potential for unique stay experiences.
Castelldefels Airbnb Room Capacity Analysis (2025): Bedroom Distribution
Distribution of Listings by Number of Bedrooms
Room Capacity Insights for Castelldefels
- The dominant room capacity in Castelldefels is 1 bedroom listings, making up 41.1% of the market. This suggests a strong demand for properties suitable for couples or solo travelers.
- Together, 1 bedroom and 2 bedrooms properties represent 65.6% of the active Airbnb listings in Castelldefels, indicating a high concentration in these sizes.
- A significant 22.9% of listings offer 3+ bedrooms, catering to larger groups and families seeking more space in Castelldefels.
Castelldefels Vacation Rental Guest Capacity Trends (2025)
Distribution of Listings by Guest Capacity
Guest Capacity Insights for Castelldefels
- The most common guest capacity trend in Castelldefels vacation rentals is listings accommodating 4 guests (30%). This suggests the primary traveler segment is likely small families or groups.
- Properties designed for 4 guests and 2 guests dominate the Castelldefels STR market, accounting for 47.4% of listings.
- 20.4% of properties accommodate 6+ guests, serving the market segment for larger families or group travel in Castelldefels.
- On average, properties in Castelldefels are equipped to host 3.8 guests.
Castelldefels Airbnb Booking Patterns (2025): Available vs. Booked Days
Available Days Distribution
Booked Days Distribution
Booking Pattern Insights for Castelldefels
- The most common availability pattern in Castelldefels falls within the 91-180 days range, representing 32.7% of listings. This suggests many properties have significant open periods on their calendars.
- Approximately 62.7% of listings show high availability (181+ days open annually), indicating potential for increased bookings or specific owner usage patterns.
- For booked days, the 181-270 days range is most frequent in Castelldefels (34.1%), reflecting common guest stay durations or potential owner blocking patterns.
- A notable 39.5% of properties secure long booking periods (181+ days booked per year), highlighting successful long-term rental strategies or significant owner usage.
Castelldefels Airbnb Minimum Stay Requirements Analysis
Distribution of Listings by Minimum Night Requirement
1 Night
66 listings
20% of total
2 Nights
46 listings
13.9% of total
3 Nights
27 listings
8.2% of total
4-6 Nights
43 listings
13% of total
7-29 Nights
22 listings
6.7% of total
30+ Nights
126 listings
38.2% of total
Key Insights
- The most prevalent minimum stay requirement in Castelldefels is 30+ Nights, adopted by 38.2% of listings. This highlights the market's preference for longer commitments.
- A significant segment (38.2%) caters to monthly stays (30+ nights) in Castelldefels, pointing to opportunities in the extended-stay market.
Recommendations
- Align with the market by considering a 30+ Nights minimum stay, as 38.2% of Castelldefels hosts use this setting.
- If feasible, allowing 1-night stays, especially midweek or during low season, could capture last-minute bookings, as only 20% currently do.
- Explore offering discounts for stays of 30+ nights to attract the 38.2% of the market seeking extended stays.
- Adjust minimum nights based on seasonality – potentially shorter during low season and longer during peak demand periods in Castelldefels.
Castelldefels Airbnb Cancellation Policy Trends Analysis (2025)
Super Strict 60 Days
3 listings
1% of total
Super Strict 30 Days
7 listings
2.4% of total
Flexible
38 listings
13.2% of total
Moderate
56 listings
19.5% of total
Firm
58 listings
20.2% of total
Strict
125 listings
43.6% of total
Cancellation Policy Insights for Castelldefels
- The prevailing Airbnb cancellation policy trend in Castelldefels is Strict, used by 43.6% of listings.
- A majority (63.8%) of hosts in Castelldefels utilize Firm or Strict policies, indicating a market where hosts prioritize booking security.
Recommendations for Hosts
- Consider adopting a Strict policy to align with the 43.6% market standard in Castelldefels.
- With 43.6% using Strict terms, this is a viable option in Castelldefels, particularly for high-value properties or during peak demand periods.
- Regularly review your cancellation policy against competitors and market demand shifts in Castelldefels.
Castelldefels STR Booking Lead Time Analysis (2025)
Average Booking Lead Time by Month
Booking Lead Time Insights for Castelldefels
- The overall average booking lead time for vacation rentals in Castelldefels is 48 days.
- Guests book furthest in advance for stays during July (average 90 days), likely coinciding with peak travel demand or local events.
- The shortest booking windows occur for stays in February (average 31 days), indicating more last-minute travel plans during this time.
- Seasonally, Summer (78 days avg.) sees the longest lead times, while Winter (36 days avg.) has the shortest, reflecting typical travel planning cycles.
Recommendations for Hosts
- Use the overall average lead time (48 days) as a baseline for your pricing and availability strategy in Castelldefels.
- For July stays, consider implementing length-of-stay discounts or slightly higher rates for bookings made less than 90 days out to capitalize on advance planning.
- Target marketing efforts for the Summer season well in advance (at least 78 days) to capture early planners.
- Monitor your own booking lead times against these Castelldefels averages to identify opportunities for dynamic pricing adjustments.
Popular & Essential Airbnb Amenities in Castelldefels (2025)
Amenity Prevalence
Amenity Insights for Castelldefels
- Essential amenities in Castelldefels that guests expect include: Wifi, TV. Lacking these (any) could significantly impact bookings.
- Popular amenities like Heating, Air conditioning, Essentials are common but not universal. Offering these can provide a competitive edge.
Recommendations for Hosts
- Ensure your listing includes all essential amenities for Castelldefels: Wifi, TV.
- Prioritize adding missing essentials: Wifi, TV.
- Consider adding popular differentiators like Heating or Air conditioning to increase appeal.
- Highlight unique or less common amenities you offer (e.g., hot tub, dedicated workspace, EV charger) in your listing description and photos.
- Regularly check competitor amenities in Castelldefels to stay competitive.
Castelldefels Airbnb Guest Demographics & Profile Analysis (2025)
Guest Profile Summary for Castelldefels
- The typical guest profile for Airbnb in Castelldefels consists of predominantly international visitors (90%), with top international origins including France, typically belonging to the Post-2000s (Gen Z/Alpha) group (50%), primarily speaking English or Spanish.
- Domestic travelers account for 9.6% of guests.
- Key international markets include United Kingdom (15.7%) and France (14.5%).
- Top languages spoken are English (39.8%) followed by Spanish (15.6%).
- A significant demographic segment is the Post-2000s (Gen Z/Alpha) group, representing 50% of guests.
Recommendations for Hosts
- Focus marketing internationally, particularly towards travelers from France.
- Tailor amenities and listing descriptions to appeal to the dominant Post-2000s (Gen Z/Alpha) demographic (e.g., highlight fast WiFi, smart home features, local guides).
- Highlight unique local experiences or amenities relevant to the primary guest profile.
- Consider seasonal promotions aligned with peak travel times for key origin markets.
Nearby Short-Term Rental Market Comparison
How does the Castelldefels Airbnb market stack up against its neighbors? Compare key performance metrics like average monthly revenue, ADR, and occupancy rates in surrounding areas to understand the broader regional STR landscape.
| Market | Active Properties | Monthly Revenue | Daily Rate | Avg. Occupancy |
|---|---|---|---|---|
| Canyelles | 49 | $5,958 | $1023.94 | 37% |
| Arenys de Munt | 28 | $5,100 | $514.27 | 41% |
| Teià | 25 | $5,027 | $348.45 | 45% |
| Cornellà del Terri | 17 | $4,960 | $460.96 | 41% |
| Tiana | 12 | $4,955 | $299.97 | 48% |
| Amer | 10 | $4,848 | $397.58 | 40% |
| Bescanó | 11 | $4,761 | $445.38 | 41% |
| Porqueres | 12 | $4,714 | $469.05 | 36% |
| Premià de Dalt | 28 | $4,630 | $345.43 | 49% |
| Cabrils | 53 | $4,474 | $436.58 | 48% |