Cardona Airbnb Market Analysis 2025: Short Term Rental Data & Vacation Rental Statistics in Catalonia, Spain
Is Airbnb profitable in Cardona in 2025? Explore comprehensive Airbnb analytics for Cardona, Catalonia, Spain to uncover income potential. This 2025 STR market report for Cardona, based on AirROI data from April 2024 to March 2025, reveals key trends in the niche market of 21 active listings.
Whether you're considering an Airbnb investment in Cardona, optimizing your existing vacation rental, or exploring rental arbitrage opportunities, understanding the Cardona Airbnb data is crucial. Navigating the high regulation landscape is key to maximizing your short term rental income potential. Let's dive into the specifics.
Key Cardona Airbnb Performance Metrics Overview
Monthly Airbnb Revenue Variations & Income Potential in Cardona (2025)
Understanding the monthly revenue variations for Airbnb listings in Cardona is key to maximizing your short term rental income potential. Seasonality significantly impacts earnings. Our analysis, based on data from the past 12 months, shows that the peak revenue month for STRs in Cardona is typically August, while February often presents the lowest earnings, highlighting opportunities for strategic pricing adjustments during shoulder and low seasons. Explore the typical Airbnb income in Cardona across different performance tiers:
- Best-in-class properties (Top 10%) achieve $4,109+ monthly, often utilizing dynamic pricing and superior guest experiences.
- Strong performing properties (Top 25%) earn $2,252 or more, indicating effective management and desirable locations/amenities.
- Typical properties (Median) generate around $1,085 per month, representing the average market performance.
- Entry-level properties (Bottom 25%) see earnings around $634, often with potential for optimization.
Average Monthly Airbnb Earnings Trend in Cardona
Cardona Airbnb Occupancy Rate Trends (2025)
Maximize your bookings by understanding the Cardona STR occupancy trends. Seasonal demand shifts significantly influence how often properties are booked. Typically, Augustsees the highest demand (peak season occupancy), while April experiences the lowest (low season). Effective strategies, like adjusting minimum stays or offering promotions, can boost occupancy during slower periods. Here's how different property tiers perform in Cardona:
- Best-in-class properties (Top 10%) achieve 54%+ occupancy, indicating high desirability and potentially optimized availability.
- Strong performing properties (Top 25%) maintain 40% or higher occupancy, suggesting good market fit and guest satisfaction.
- Typical properties (Median) have an occupancy rate around 26%.
- Entry-level properties (Bottom 25%) average 14% occupancy, potentially facing higher vacancy.
Average Monthly Occupancy Rate Trend in Cardona
Average Daily Rate (ADR) Airbnb Trends in Cardona (2025)
Effective short term rental pricing strategy in Cardona involves understanding monthly ADR fluctuations. The Average Daily Rate (ADR) for Airbnb in Cardona typically peaks in December and dips lowest during August. Leveraging Airbnb dynamic pricing tools or strategies based on this seasonality can significantly boost revenue. Here's a look at the typical nightly rates achieved:
- Best-in-class properties (Top 10%) command rates of $374+ per night, often due to premium features or locations.
- Strong performing properties (Top 25%) achieve nightly rates of $238 or more.
- Typical properties (Median) charge around $130 per night.
- Entry-level properties (Bottom 25%) earn around $104 per night.
Average Daily Rate (ADR) Trend by Month in Cardona
Get Live Cardona Market Intelligence 👇

Explore Real-time Analytics
Airbnb Seasonality Analysis & Trends in Cardona (2025)
Peak Season (August, July, June)
- Revenue averages $2,779 per month
- Occupancy rates average 36.6%
- Daily rates average $180
Shoulder Season
- Revenue averages $1,794 per month
- Occupancy maintains around 29.5%
- Daily rates hold near $192
Low Season (February, March, April)
- Revenue drops to average $1,058 per month
- Occupancy decreases to average 18.9%
- Daily rates adjust to average $192
Seasonality Insights for Cardona
- The Airbnb seasonality in Cardona shows highly seasonal trends requiring careful strategy. While the sections above show seasonal averages, it's also insightful to look at the extremes:
- During the high season, the absolute peak month showcases Cardona's highest earning potential, with monthly revenues capable of climbing to $3,664, occupancy reaching a high of 49.6%, and ADRs peaking at $207.
- Conversely, the slowest single month of the year, typically falling within the low season, marks the market's lowest point. In this month, revenue might dip to $1,021, occupancy could drop to 16.4%, and ADRs may adjust down to $179.
- Understanding both the seasonal averages and these monthly peaks and troughs in revenue, occupancy, and ADR is crucial for maximizing your Airbnb profit potential in Cardona.
Seasonal Strategies for Maximizing Profit
- Peak Season: Maximize revenue through premium pricing and potentially longer minimum stays. Ensure high availability.
- Low Season: Offer competitive pricing, special promotions (e.g., extended stay discounts), and flexible cancellation policies. Target off-season travelers like remote workers or budget-conscious guests.
- Shoulder Seasons: Implement dynamic pricing that balances peak and low rates. Target weekend travelers or specific events. Offer slightly more flexible terms than peak season.
- Regularly analyze your own performance against these Cardona seasonality benchmarks and adjust your pricing and availability strategy accordingly.
Best Areas for Airbnb Investment in Cardona (2025)
Exploring the top neighborhoods for short-term rentals in Cardona? This section highlights key areas, outlining why they are attractive for hosts and guests, along with notable local attractions. Consider these locations based on your target guest profile and investment strategy.
| Neighborhood / Area | Why Host Here? (Target Guests & Appeal) | Key Attractions & Landmarks |
|---|---|---|
| Cardona Castle | A historic fortress that offers stunning views and a glimpse into the region's medieval past. Attracts tourists interested in history and culture. | Cardona Castle, Salt Mountain Cultural Park, Church of Sant Miquel, Parc de la Font del Lleó, Local artisan shops |
| Salt Mountain | A unique geological site that showcases the region's history of salt mining. Perfect for nature lovers and those interested in geology. | Salt Mountain, Salt Mines, Natural Park of Cadí-Moixeró, Caves of Salnitre, Hiking trails in the area |
| Town Center | The bustling heart of Cardona, filled with shops, cafes, and local life. Ideal for travelers looking for local culture and gastronomy. | Plaza Nueva, Church of Sant Maria, Local festivals, Market days, Gastronomic tours |
| The Gelida Valley | A picturesque valley offering breathtaking nature views and outdoor activities. Attracts hikers and families looking for relaxation. | Hiking trails, Bird watching, Picnic areas, Scenic viewpoints, Cycling routes |
| El Castellot | A charming neighborhood known for its narrow streets and traditional Catalan architecture. Great for those wanting an authentic experience. | Narrow streets, Local restaurants, Traditional architecture, Cultural events, Community markets |
| Museu de la Sal | A museum dedicated to the history of salt mining in Cardona, offering insights into the local heritage and economy. | Museum exhibits, Guided tours, Cultural events, Educational programs, Workshops |
| The Old Town | A quaint area showcasing Cardona's rich history and architectural beauty, appealing to history buffs and architecture enthusiasts. | Historic buildings, Guided walking tours, Local art galleries, Craft shops, Cafes with local cuisine |
| Local Vineyards | Nearby vineyards offer wine tasting and tours, attracting connoisseurs and those seeking a rural getaway. | Wine tours, Tasting rooms, Vineyard walks, Local wine festivals, Food and wine pairings |
Understanding Airbnb License Requirements & STR Laws in Cardona (2025)
Yes, Cardona, Catalonia, Spain enforces high STR regulations. Obtaining a license and ensuring compliance is almost certainly required according to current 2025 STR laws. Always verify the latest short term rental regulations and Airbnb license requirements directly with local government authorities for Cardona to ensure full compliance before hosting.
(Source: AirROI data, 2025, based on 90% licensed listings)
Top Performing Airbnb Properties in Cardona (2025)
Benchmark your potential! Explore examples of top-performing Airbnb properties in Cardonabased on Trailing Twelve Month (TTM) revenue. Analyze their characteristics, revenue, occupancy rate, and ADR to understand what drives success in this market.
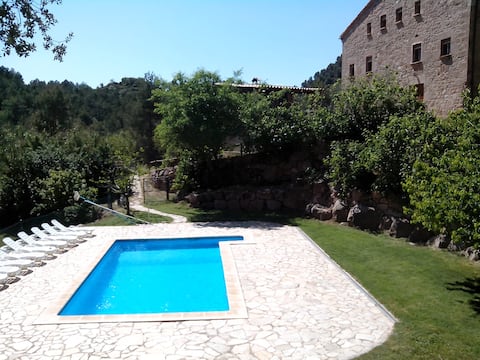
Rural house with outdoor pool and BBQ
Entire Place • 6 bedrooms

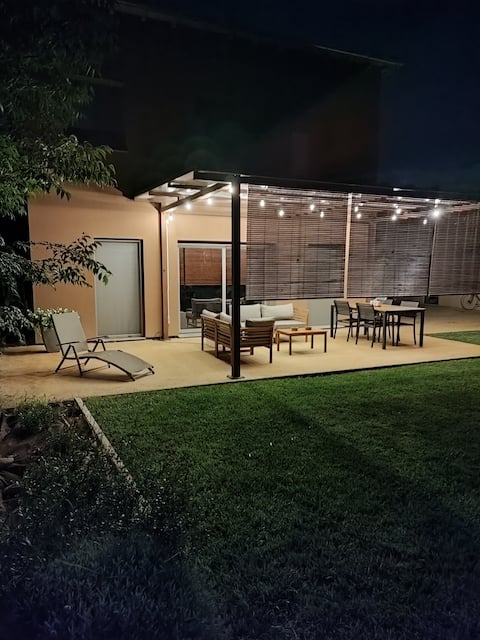
Large Rural House with private pool, 7 rooms 17p
Entire Place • 7 bedrooms
Can Bastida
Entire Place • 5 bedrooms
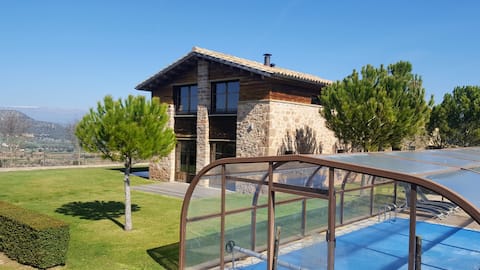
Rural House with Private Pool and air-conditioned
Entire Place • 4 bedrooms
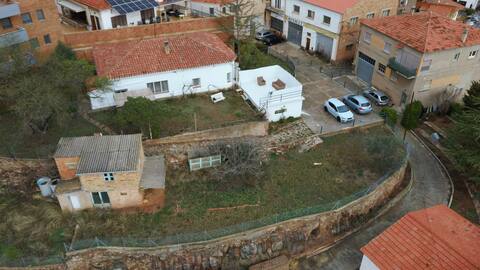
Modern Home in the Country Environment of Cardona
Entire Place • 3 bedrooms
Tourist Apartments Cardona IV
Entire Place • 1 bedroom
Note: Performance varies based on location, size, amenities, seasonality, and management quality. Data reflects the past 12 months.
Top Performing Airbnb Hosts in Cardona (2025)
Learn from the best! This table showcases top-performing Airbnb hosts in Cardona based on the number of properties managed and estimated total revenue over the past year. Analyze their scale and performance metrics.
| Host Name | Properties | Grossing Revenue | Stay Reviews | Avg Rating |
|---|---|---|---|---|
| Xavi Vilà | 5 | $86,861 | 93 | 4.95/5.0 |
| Maria Pilar | 2 | $86,231 | 12 | 4.75/5.0 |
| Laia | 1 | $60,919 | 3 | 5.00/5.0 |
| Host #359534094 | 1 | $41,845 | 0 | 0.00/5.0 |
| Laia | 1 | $32,870 | 8 | 4.88/5.0 |
| Josefina | 1 | $17,274 | 9 | 4.89/5.0 |
| Sonia | 1 | $16,381 | 50 | 4.98/5.0 |
| Miriam | 1 | $11,584 | 70 | 4.97/5.0 |
| Marc | 1 | $11,290 | 8 | 4.50/5.0 |
| Ariana I Sergi | 1 | $9,377 | 52 | 4.94/5.0 |
Analyzing the strategies of top hosts, such as their property selection, pricing, and guest communication, can offer valuable lessons for optimizing your own Airbnb operations in Cardona.
Dive Deeper: Advanced Cardona STR Market Data (2025)
Ready to unlock more insights? AirROI provides access to advanced metrics and comprehensive Airbnb data for Cardona. Explore detailed analytics beyond this report to refine your investment strategy, optimize pricing, and maximize your vacation rental profits.
Explore Advanced MetricsCardona Short-Term Rental Market Composition (2025): Property & Room Types
Room Type Distribution
Property Type Distribution
Market Composition Insights for Cardona
- The Cardona Airbnb market composition is heavily skewed towards Entire Home/Apt listings, which make up 100% of the 21 active rentals. This indicates strong guest preference for privacy and space.
- Looking at the property type distribution in Cardona, Apartment/Condo properties are the most common (76.2%), reflecting the local real estate landscape.
- Houses represent a significant 23.8% portion, catering likely to families or larger groups.
Cardona Airbnb Room Capacity Analysis (2025): Bedroom Distribution
Distribution of Listings by Number of Bedrooms
Room Capacity Insights for Cardona
- The dominant room capacity in Cardona is 3 bedrooms listings, making up 28.6% of the market. This suggests a strong demand for properties suitable for families or small groups.
- Together, 3 bedrooms and 2 bedrooms properties represent 52.4% of the active Airbnb listings in Cardona, indicating a high concentration in these sizes.
- A significant 52.4% of listings offer 3+ bedrooms, catering to larger groups and families seeking more space in Cardona.
Cardona Vacation Rental Guest Capacity Trends (2025)
Distribution of Listings by Guest Capacity
Guest Capacity Insights for Cardona
- The most common guest capacity trend in Cardona vacation rentals is listings accommodating 8+ guests (28.6%). This suggests the primary traveler segment is likely larger groups.
- Properties designed for 8+ guests and 4 guests dominate the Cardona STR market, accounting for 57.2% of listings.
- 52.4% of properties accommodate 6+ guests, serving the market segment for larger families or group travel in Cardona.
- On average, properties in Cardona are equipped to host 5.6 guests.
Cardona Airbnb Booking Patterns (2025): Available vs. Booked Days
Available Days Distribution
Booked Days Distribution
Booking Pattern Insights for Cardona
- The most common availability pattern in Cardona falls within the 181-270 days range, representing 52.4% of listings. This suggests many properties have significant open periods on their calendars.
- Approximately 100.0% of listings show high availability (181+ days open annually), indicating potential for increased bookings or specific owner usage patterns.
- For booked days, the 91-180 days range is most frequent in Cardona (57.1%), reflecting common guest stay durations or potential owner blocking patterns.
Cardona Airbnb Minimum Stay Requirements Analysis
Distribution of Listings by Minimum Night Requirement
1 Night
11 listings
52.4% of total
2 Nights
7 listings
33.3% of total
7-29 Nights
2 listings
9.5% of total
30+ Nights
1 listings
4.8% of total
Key Insights
- The most prevalent minimum stay requirement in Cardona is 1 Night, adopted by 52.4% of listings. This highlights the market's preference for shorter, flexible bookings.
- A strong majority (85.7%) of the Cardona Airbnb data shows acceptance of very short stays (1-2 nights), indicating a dynamic, high-turnover market.
Recommendations
- Align with the market by considering a 1 Night minimum stay, as 52.4% of Cardona hosts use this setting.
- Adjust minimum nights based on seasonality – potentially shorter during low season and longer during peak demand periods in Cardona.
Cardona Airbnb Cancellation Policy Trends Analysis (2025)
Flexible
6 listings
31.6% of total
Moderate
10 listings
52.6% of total
Strict
3 listings
15.8% of total
Cancellation Policy Insights for Cardona
- The prevailing Airbnb cancellation policy trend in Cardona is Moderate, used by 52.6% of listings.
- The market strongly favors guest-friendly terms, with 84.2% of listings offering Flexible or Moderate policies. This suggests guests in Cardona may expect booking flexibility.
Recommendations for Hosts
- Consider adopting a Moderate policy to align with the 52.6% market standard in Cardona.
- Regularly review your cancellation policy against competitors and market demand shifts in Cardona.
Cardona STR Booking Lead Time Analysis (2025)
Average Booking Lead Time by Month
Booking Lead Time Insights for Cardona
- The overall average booking lead time for vacation rentals in Cardona is 41 days.
- Guests book furthest in advance for stays during June (average 73 days), likely coinciding with peak travel demand or local events.
- The shortest booking windows occur for stays in January (average 25 days), indicating more last-minute travel plans during this time.
- Seasonally, Summer (64 days avg.) sees the longest lead times, while Winter (38 days avg.) has the shortest, reflecting typical travel planning cycles.
Recommendations for Hosts
- Use the overall average lead time (41 days) as a baseline for your pricing and availability strategy in Cardona.
- For June stays, consider implementing length-of-stay discounts or slightly higher rates for bookings made less than 73 days out to capitalize on advance planning.
- Target marketing efforts for the Summer season well in advance (at least 64 days) to capture early planners.
- Monitor your own booking lead times against these Cardona averages to identify opportunities for dynamic pricing adjustments.
Popular & Essential Airbnb Amenities in Cardona (2025)
Amenity Prevalence
Amenity Insights for Cardona
- Essential amenities in Cardona that guests expect include: Wifi, Kitchen. Lacking these (any) could significantly impact bookings.
- Popular amenities like TV, Essentials, Heating are common but not universal. Offering these can provide a competitive edge.
Recommendations for Hosts
- Ensure your listing includes all essential amenities for Cardona: Wifi, Kitchen.
- Prioritize adding missing essentials: Wifi, Kitchen.
- Consider adding popular differentiators like TV or Essentials to increase appeal.
- Highlight unique or less common amenities you offer (e.g., hot tub, dedicated workspace, EV charger) in your listing description and photos.
- Regularly check competitor amenities in Cardona to stay competitive.
Cardona Airbnb Guest Demographics & Profile Analysis (2025)
Guest Profile Summary for Cardona
- The typical guest profile for Airbnb in Cardona consists of a mix of domestic (54%) and international guests, often arriving from nearby Barcelona, typically belonging to the Post-2000s (Gen Z/Alpha) group (50%), primarily speaking English or Spanish.
- Domestic travelers account for 54.3% of guests.
- Key international markets include Spain (54.3%) and France (15.7%).
- Top languages spoken are English (32%) followed by Spanish (20%).
- A significant demographic segment is the Post-2000s (Gen Z/Alpha) group, representing 50% of guests.
Recommendations for Hosts
- Balance marketing efforts between domestic and international channels based on the guest mix.
- Tailor amenities and listing descriptions to appeal to the dominant Post-2000s (Gen Z/Alpha) demographic (e.g., highlight fast WiFi, smart home features, local guides).
- Highlight unique local experiences or amenities relevant to the primary guest profile.
- Consider seasonal promotions aligned with peak travel times for key origin markets.
Nearby Short-Term Rental Market Comparison
How does the Cardona Airbnb market stack up against its neighbors? Compare key performance metrics like average monthly revenue, ADR, and occupancy rates in surrounding areas to understand the broader regional STR landscape.
| Market | Active Properties | Monthly Revenue | Daily Rate | Avg. Occupancy |
|---|---|---|---|---|
| Canyelles | 49 | $5,958 | $1023.94 | 37% |
| Arenys de Munt | 28 | $5,100 | $514.27 | 41% |
| Teià | 25 | $5,027 | $348.45 | 45% |
| Cornellà del Terri | 17 | $4,960 | $460.96 | 41% |
| Tiana | 12 | $4,955 | $299.97 | 48% |
| Amer | 10 | $4,848 | $397.58 | 40% |
| Bescanó | 11 | $4,761 | $445.38 | 41% |
| Porqueres | 12 | $4,714 | $469.05 | 36% |
| Premià de Dalt | 28 | $4,630 | $345.43 | 49% |
| Cabrils | 53 | $4,474 | $436.58 | 48% |