Calella Airbnb Market Analysis 2025: Short Term Rental Data & Vacation Rental Statistics in Catalonia, Spain
Is Airbnb profitable in Calella in 2025? Explore comprehensive Airbnb analytics for Calella, Catalonia, Spain to uncover income potential. This 2025 STR market report for Calella, based on AirROI data from April 2024 to March 2025, reveals key trends in the niche market of 188 active listings.
Whether you're considering an Airbnb investment in Calella, optimizing your existing vacation rental, or exploring rental arbitrage opportunities, understanding the Calella Airbnb data is crucial. Navigating the high regulation landscape is key to maximizing your short term rental income potential. Let's dive into the specifics.
Key Calella Airbnb Performance Metrics Overview
Monthly Airbnb Revenue Variations & Income Potential in Calella (2025)
Understanding the monthly revenue variations for Airbnb listings in Calella is key to maximizing your short term rental income potential. Seasonality significantly impacts earnings. Our analysis, based on data from the past 12 months, shows that the peak revenue month for STRs in Calella is typically August, while February often presents the lowest earnings, highlighting opportunities for strategic pricing adjustments during shoulder and low seasons. Explore the typical Airbnb income in Calella across different performance tiers:
- Best-in-class properties (Top 10%) achieve $3,552+ monthly, often utilizing dynamic pricing and superior guest experiences.
- Strong performing properties (Top 25%) earn $2,291 or more, indicating effective management and desirable locations/amenities.
- Typical properties (Median) generate around $1,408 per month, representing the average market performance.
- Entry-level properties (Bottom 25%) see earnings around $769, often with potential for optimization.
Average Monthly Airbnb Earnings Trend in Calella
Calella Airbnb Occupancy Rate Trends (2025)
Maximize your bookings by understanding the Calella STR occupancy trends. Seasonal demand shifts significantly influence how often properties are booked. Typically, Augustsees the highest demand (peak season occupancy), while February experiences the lowest (low season). Effective strategies, like adjusting minimum stays or offering promotions, can boost occupancy during slower periods. Here's how different property tiers perform in Calella:
- Best-in-class properties (Top 10%) achieve 76%+ occupancy, indicating high desirability and potentially optimized availability.
- Strong performing properties (Top 25%) maintain 59% or higher occupancy, suggesting good market fit and guest satisfaction.
- Typical properties (Median) have an occupancy rate around 35%.
- Entry-level properties (Bottom 25%) average 20% occupancy, potentially facing higher vacancy.
Average Monthly Occupancy Rate Trend in Calella
Average Daily Rate (ADR) Airbnb Trends in Calella (2025)
Effective short term rental pricing strategy in Calella involves understanding monthly ADR fluctuations. The Average Daily Rate (ADR) for Airbnb in Calella typically peaks in July and dips lowest during March. Leveraging Airbnb dynamic pricing tools or strategies based on this seasonality can significantly boost revenue. Here's a look at the typical nightly rates achieved:
- Best-in-class properties (Top 10%) command rates of $248+ per night, often due to premium features or locations.
- Strong performing properties (Top 25%) achieve nightly rates of $159 or more.
- Typical properties (Median) charge around $115 per night.
- Entry-level properties (Bottom 25%) earn around $86 per night.
Average Daily Rate (ADR) Trend by Month in Calella
Get Live Calella Market Intelligence 👇

Explore Real-time Analytics
Airbnb Seasonality Analysis & Trends in Calella (2025)
Peak Season (August, July, June)
- Revenue averages $3,269 per month
- Occupancy rates average 57.6%
- Daily rates average $158
Shoulder Season
- Revenue averages $1,600 per month
- Occupancy maintains around 36.9%
- Daily rates hold near $144
Low Season (January, February, March)
- Revenue drops to average $926 per month
- Occupancy decreases to average 26.2%
- Daily rates adjust to average $142
Seasonality Insights for Calella
- The Airbnb seasonality in Calella shows highly seasonal trends requiring careful strategy. While the sections above show seasonal averages, it's also insightful to look at the extremes:
- During the high season, the absolute peak month showcases Calella's highest earning potential, with monthly revenues capable of climbing to $3,873, occupancy reaching a high of 69.9%, and ADRs peaking at $162.
- Conversely, the slowest single month of the year, typically falling within the low season, marks the market's lowest point. In this month, revenue might dip to $862, occupancy could drop to 23.8%, and ADRs may adjust down to $141.
- Understanding both the seasonal averages and these monthly peaks and troughs in revenue, occupancy, and ADR is crucial for maximizing your Airbnb profit potential in Calella.
Seasonal Strategies for Maximizing Profit
- Peak Season: Maximize revenue through premium pricing and potentially longer minimum stays. Ensure high availability.
- Low Season: Offer competitive pricing, special promotions (e.g., extended stay discounts), and flexible cancellation policies. Target off-season travelers like remote workers or budget-conscious guests.
- Shoulder Seasons: Implement dynamic pricing that balances peak and low rates. Target weekend travelers or specific events. Offer slightly more flexible terms than peak season.
- Regularly analyze your own performance against these Calella seasonality benchmarks and adjust your pricing and availability strategy accordingly.
Best Areas for Airbnb Investment in Calella (2025)
Exploring the top neighborhoods for short-term rentals in Calella? This section highlights key areas, outlining why they are attractive for hosts and guests, along with notable local attractions. Consider these locations based on your target guest profile and investment strategy.
| Neighborhood / Area | Why Host Here? (Target Guests & Appeal) | Key Attractions & Landmarks |
|---|---|---|
| Calella Beach | One of the main attractions in Calella, known for its beautiful sandy beaches and crystal-clear waters. Ideal for tourists looking for sun, sea, and relaxation. | Calella Beach, Water Sports Activities, Beach Bars, Coastal Promenade |
| Old Town Calella | Historic area featuring charming streets, local shops, and traditional Catalan architecture. Great for tourists interested in culture and history. | Calella's Church, Main Square (Plaça de l'Església), Local Restaurants, Artisan Shops |
| Parc Dalmau | A beautiful park located in the heart of Calella, offering green spaces for relaxation and recreation. Perfect for families and those seeking a serene environment. | Playgrounds, Walking Trails, Picnic Areas, Scenic Views of the Coast |
| Calella's Promenade | Lively beachfront promenade with restaurants, bars, and shops. Attracts both tourists and locals for dining and entertainment options. | Seaside Restaurants, Shopping Stalls, Scenic Walks, Events and Festivals |
| Hotel Zone | Area dominated by hotels and accommodations catering to tourists. Convenient for visitors seeking easy access to beaches and attractions. | Close to the Beach, Restaurants, Entertainment Venues, Transport Links |
| Nightlife District | Area known for vibrant nightlife, including clubs and bars. Popular among young travelers looking for entertainment after dark. | Clubs, Live Music Venues, Bars, Late-night Dining |
| Cultural Events Center | A hub for local festivals and cultural events, drawing visitors interested in traditional Catalan culture and activities. | Theatre Performances, Local Fairs, Cultural Exhibitions, Gastronomy Events |
| Nearby Nature Reserves | Regions surrounding Calella, offering beautiful landscapes and hiking opportunities. Appeals to nature lovers and outdoor enthusiasts. | Montnegre-Corredor Natural Park, Nature Trails, Bird Watching, Scenic Views |
Understanding Airbnb License Requirements & STR Laws in Calella (2025)
Yes, Calella, Catalonia, Spain enforces high STR regulations. Obtaining a license and ensuring compliance is almost certainly required according to current 2025 STR laws. Always verify the latest short term rental regulations and Airbnb license requirements directly with local government authorities for Calella to ensure full compliance before hosting.
(Source: AirROI data, 2025, based on 84% licensed listings)
Top Performing Airbnb Properties in Calella (2025)
Benchmark your potential! Explore examples of top-performing Airbnb properties in Calellabased on Trailing Twelve Month (TTM) revenue. Analyze their characteristics, revenue, occupancy rate, and ADR to understand what drives success in this market.

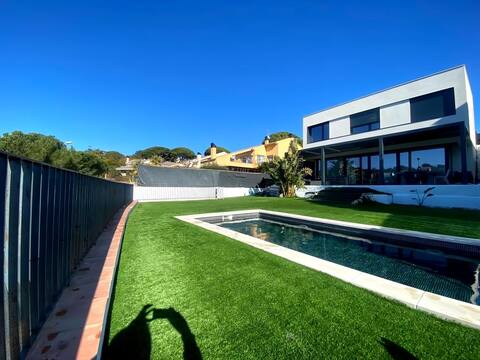
★CoastalVillas - Villa Destiny ★ garden, pool&bbq
Entire Place • 7 bedrooms
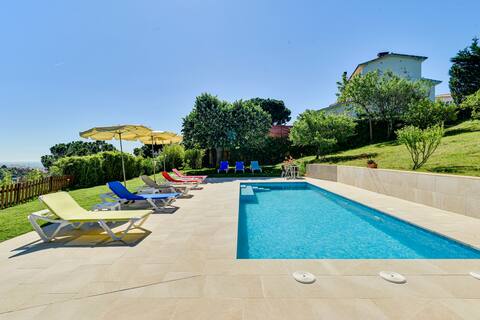
House with a luxury swimming pool
Entire Place • 3 bedrooms
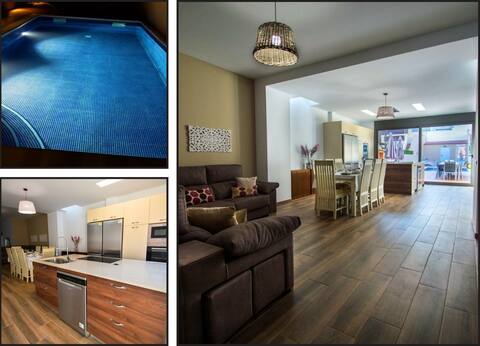
★ CoastalVillas - Villa Margot ★ very large garden
Entire Place • 6 bedrooms
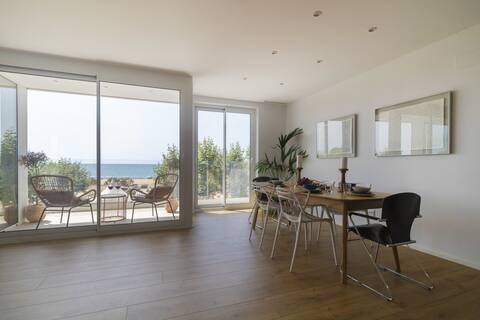
Charming home in Calella center 300m from beach
Entire Place • 7 bedrooms
Vivalidays Apartour - Calella
Entire Place • 3 bedrooms

Villa Paquita Luxury house in Barcelona (10 pax)
Entire Place • 5 bedrooms
Note: Performance varies based on location, size, amenities, seasonality, and management quality. Data reflects the past 12 months.
Top Performing Airbnb Hosts in Calella (2025)
Learn from the best! This table showcases top-performing Airbnb hosts in Calella based on the number of properties managed and estimated total revenue over the past year. Analyze their scale and performance metrics.
| Host Name | Properties | Grossing Revenue | Stay Reviews | Avg Rating |
|---|---|---|---|---|
| Jordi I Cristina | 3 | $173,985 | 203 | 4.83/5.0 |
| Camping El Far | 17 | $165,750 | 253 | 4.51/5.0 |
| CoastalVillas | 3 | $159,410 | 24 | 3.17/5.0 |
| Yolanda | 6 | $118,139 | 242 | 4.83/5.0 |
| Olala Homes | 2 | $98,226 | 37 | 4.68/5.0 |
| Mei | 3 | $80,793 | 53 | 4.49/5.0 |
| Manuel | 3 | $69,566 | 38 | 4.96/5.0 |
| Óscar | 1 | $67,727 | 8 | 5.00/5.0 |
| Roger - Hauzify | 2 | $61,253 | 45 | 4.94/5.0 |
| Pension Colibri | 9 | $58,605 | 167 | 2.99/5.0 |
Analyzing the strategies of top hosts, such as their property selection, pricing, and guest communication, can offer valuable lessons for optimizing your own Airbnb operations in Calella.
Dive Deeper: Advanced Calella STR Market Data (2025)
Ready to unlock more insights? AirROI provides access to advanced metrics and comprehensive Airbnb data for Calella. Explore detailed analytics beyond this report to refine your investment strategy, optimize pricing, and maximize your vacation rental profits.
Explore Advanced MetricsCalella Short-Term Rental Market Composition (2025): Property & Room Types
Room Type Distribution
Property Type Distribution
Market Composition Insights for Calella
- The Calella Airbnb market composition is heavily skewed towards Entire Home/Apt listings, which make up 85.6% of the 188 active rentals. This indicates strong guest preference for privacy and space.
- Looking at the property type distribution in Calella, Apartment/Condo properties are the most common (66.5%), reflecting the local real estate landscape.
- Houses represent a significant 22.3% portion, catering likely to families or larger groups.
- The presence of 8% Hotel/Boutique listings indicates integration with traditional hospitality.
- Smaller segments like outdoor/unique, others (combined 3.2%) offer potential for unique stay experiences.
Calella Airbnb Room Capacity Analysis (2025): Bedroom Distribution
Distribution of Listings by Number of Bedrooms
Room Capacity Insights for Calella
- The dominant room capacity in Calella is 2 bedrooms listings, making up 30.3% of the market. This suggests a strong demand for properties suitable for couples or solo travelers.
- Together, 2 bedrooms and 1 bedroom properties represent 60.1% of the active Airbnb listings in Calella, indicating a high concentration in these sizes.
- A significant 34.5% of listings offer 3+ bedrooms, catering to larger groups and families seeking more space in Calella.
Calella Vacation Rental Guest Capacity Trends (2025)
Distribution of Listings by Guest Capacity
Guest Capacity Insights for Calella
- The most common guest capacity trend in Calella vacation rentals is listings accommodating 4 guests (25%). This suggests the primary traveler segment is likely small families or groups.
- Properties designed for 4 guests and 2 guests dominate the Calella STR market, accounting for 42.0% of listings.
- 29.8% of properties accommodate 6+ guests, serving the market segment for larger families or group travel in Calella.
- On average, properties in Calella are equipped to host 4.4 guests.
Calella Airbnb Booking Patterns (2025): Available vs. Booked Days
Available Days Distribution
Booked Days Distribution
Booking Pattern Insights for Calella
- The most common availability pattern in Calella falls within the 271-366 days range, representing 50.5% of listings. This suggests many properties have significant open periods on their calendars.
- Approximately 83.5% of listings show high availability (181+ days open annually), indicating potential for increased bookings or specific owner usage patterns.
- For booked days, the 91-180 days range is most frequent in Calella (36.2%), reflecting common guest stay durations or potential owner blocking patterns.
- A notable 17.0% of properties secure long booking periods (181+ days booked per year), highlighting successful long-term rental strategies or significant owner usage.
Calella Airbnb Minimum Stay Requirements Analysis
Distribution of Listings by Minimum Night Requirement
1 Night
38 listings
21% of total
2 Nights
30 listings
16.6% of total
3 Nights
25 listings
13.8% of total
4-6 Nights
55 listings
30.4% of total
7-29 Nights
12 listings
6.6% of total
30+ Nights
21 listings
11.6% of total
Key Insights
- The most prevalent minimum stay requirement in Calella is 4-6 Nights, adopted by 30.4% of listings. This highlights the market's preference for longer commitments.
- A significant segment (11.6%) caters to monthly stays (30+ nights) in Calella, pointing to opportunities in the extended-stay market.
Recommendations
- Align with the market by considering a 4-6 Nights minimum stay, as 30.4% of Calella hosts use this setting.
- If feasible, allowing 1-night stays, especially midweek or during low season, could capture last-minute bookings, as only 21% currently do.
- Explore offering discounts for stays of 30+ nights to attract the 11.6% of the market seeking extended stays.
- Adjust minimum nights based on seasonality – potentially shorter during low season and longer during peak demand periods in Calella.
Calella Airbnb Cancellation Policy Trends Analysis (2025)
Super Strict 30 Days
4 listings
2.3% of total
Super Strict 60 Days
2 listings
1.1% of total
Flexible
17 listings
9.7% of total
Moderate
37 listings
21.1% of total
Firm
43 listings
24.6% of total
Strict
72 listings
41.1% of total
Cancellation Policy Insights for Calella
- The prevailing Airbnb cancellation policy trend in Calella is Strict, used by 41.1% of listings.
- A majority (65.7%) of hosts in Calella utilize Firm or Strict policies, indicating a market where hosts prioritize booking security.
Recommendations for Hosts
- Consider adopting a Strict policy to align with the 41.1% market standard in Calella.
- With 41.1% using Strict terms, this is a viable option in Calella, particularly for high-value properties or during peak demand periods.
- Regularly review your cancellation policy against competitors and market demand shifts in Calella.
Calella STR Booking Lead Time Analysis (2025)
Average Booking Lead Time by Month
Booking Lead Time Insights for Calella
- The overall average booking lead time for vacation rentals in Calella is 78 days.
- Guests book furthest in advance for stays during October (average 112 days), likely coinciding with peak travel demand or local events.
- The shortest booking windows occur for stays in March (average 33 days), indicating more last-minute travel plans during this time.
- Seasonally, Summer (93 days avg.) sees the longest lead times, while Winter (44 days avg.) has the shortest, reflecting typical travel planning cycles.
Recommendations for Hosts
- Use the overall average lead time (78 days) as a baseline for your pricing and availability strategy in Calella.
- For October stays, consider implementing length-of-stay discounts or slightly higher rates for bookings made less than 112 days out to capitalize on advance planning.
- Target marketing efforts for the Summer season well in advance (at least 93 days) to capture early planners.
- Monitor your own booking lead times against these Calella averages to identify opportunities for dynamic pricing adjustments.
Popular & Essential Airbnb Amenities in Calella (2025)
Amenity Prevalence
Amenity Insights for Calella
- Essential amenities in Calella that guests expect include: TV, Wifi. Lacking these (any) could significantly impact bookings.
- Popular amenities like Kitchen, Heating, Hangers are common but not universal. Offering these can provide a competitive edge.
Recommendations for Hosts
- Ensure your listing includes all essential amenities for Calella: TV, Wifi.
- Prioritize adding missing essentials: TV, Wifi.
- Consider adding popular differentiators like Kitchen or Heating to increase appeal.
- Highlight unique or less common amenities you offer (e.g., hot tub, dedicated workspace, EV charger) in your listing description and photos.
- Regularly check competitor amenities in Calella to stay competitive.
Calella Airbnb Guest Demographics & Profile Analysis (2025)
Guest Profile Summary for Calella
- The typical guest profile for Airbnb in Calella consists of predominantly international visitors (86%), with top international origins including Spain, typically belonging to the Post-2000s (Gen Z/Alpha) group (50%), primarily speaking English or French.
- Domestic travelers account for 13.6% of guests.
- Key international markets include France (30.5%) and Spain (13.6%).
- Top languages spoken are English (34.1%) followed by French (16.3%).
- A significant demographic segment is the Post-2000s (Gen Z/Alpha) group, representing 50% of guests.
Recommendations for Hosts
- Focus marketing internationally, particularly towards travelers from Spain.
- Tailor amenities and listing descriptions to appeal to the dominant Post-2000s (Gen Z/Alpha) demographic (e.g., highlight fast WiFi, smart home features, local guides).
- Highlight unique local experiences or amenities relevant to the primary guest profile.
- Consider seasonal promotions aligned with peak travel times for key origin markets.
Nearby Short-Term Rental Market Comparison
How does the Calella Airbnb market stack up against its neighbors? Compare key performance metrics like average monthly revenue, ADR, and occupancy rates in surrounding areas to understand the broader regional STR landscape.
| Market | Active Properties | Monthly Revenue | Daily Rate | Avg. Occupancy |
|---|---|---|---|---|
| Vall-llobrega | 15 | $10,261 | $798.88 | 44% |
| Canyelles | 49 | $5,958 | $1023.94 | 37% |
| Arenys de Munt | 28 | $5,100 | $514.27 | 41% |
| Teià | 25 | $5,027 | $348.45 | 45% |
| Cornellà del Terri | 17 | $4,960 | $460.96 | 41% |
| Tiana | 12 | $4,955 | $299.97 | 48% |
| Amer | 10 | $4,848 | $397.58 | 40% |
| Bescanó | 11 | $4,761 | $445.38 | 41% |
| Porqueres | 12 | $4,714 | $469.05 | 36% |
| Premià de Dalt | 28 | $4,630 | $345.43 | 49% |