Caldes de Montbui Airbnb Market Analysis 2025: Short Term Rental Data & Vacation Rental Statistics in Catalonia, Spain
Is Airbnb profitable in Caldes de Montbui in 2025? Explore comprehensive Airbnb analytics for Caldes de Montbui, Catalonia, Spain to uncover income potential. This 2025 STR market report for Caldes de Montbui, based on AirROI data from April 2024 to March 2025, reveals key trends in the niche market of 19 active listings.
Whether you're considering an Airbnb investment in Caldes de Montbui, optimizing your existing vacation rental, or exploring rental arbitrage opportunities, understanding the Caldes de Montbui Airbnb data is crucial. Navigating the high regulation landscape is key to maximizing your short term rental income potential. Let's dive into the specifics.
Key Caldes de Montbui Airbnb Performance Metrics Overview
Monthly Airbnb Revenue Variations & Income Potential in Caldes de Montbui (2025)
Understanding the monthly revenue variations for Airbnb listings in Caldes de Montbui is key to maximizing your short term rental income potential. Seasonality significantly impacts earnings. Our analysis, based on data from the past 12 months, shows that the peak revenue month for STRs in Caldes de Montbui is typically January, while February often presents the lowest earnings, highlighting opportunities for strategic pricing adjustments during shoulder and low seasons. Explore the typical Airbnb income in Caldes de Montbui across different performance tiers:
- Best-in-class properties (Top 10%) achieve $4,297+ monthly, often utilizing dynamic pricing and superior guest experiences.
- Strong performing properties (Top 25%) earn $2,051 or more, indicating effective management and desirable locations/amenities.
- Typical properties (Median) generate around $1,132 per month, representing the average market performance.
- Entry-level properties (Bottom 25%) see earnings around $566, often with potential for optimization.
Average Monthly Airbnb Earnings Trend in Caldes de Montbui
Caldes de Montbui Airbnb Occupancy Rate Trends (2025)
Maximize your bookings by understanding the Caldes de Montbui STR occupancy trends. Seasonal demand shifts significantly influence how often properties are booked. Typically, Januarysees the highest demand (peak season occupancy), while April experiences the lowest (low season). Effective strategies, like adjusting minimum stays or offering promotions, can boost occupancy during slower periods. Here's how different property tiers perform in Caldes de Montbui:
- Best-in-class properties (Top 10%) achieve 68%+ occupancy, indicating high desirability and potentially optimized availability.
- Strong performing properties (Top 25%) maintain 32% or higher occupancy, suggesting good market fit and guest satisfaction.
- Typical properties (Median) have an occupancy rate around 20%.
- Entry-level properties (Bottom 25%) average 13% occupancy, potentially facing higher vacancy.
Average Monthly Occupancy Rate Trend in Caldes de Montbui
Average Daily Rate (ADR) Airbnb Trends in Caldes de Montbui (2025)
Effective short term rental pricing strategy in Caldes de Montbui involves understanding monthly ADR fluctuations. The Average Daily Rate (ADR) for Airbnb in Caldes de Montbui typically peaks in June and dips lowest during September. Leveraging Airbnb dynamic pricing tools or strategies based on this seasonality can significantly boost revenue. Here's a look at the typical nightly rates achieved:
- Best-in-class properties (Top 10%) command rates of $405+ per night, often due to premium features or locations.
- Strong performing properties (Top 25%) achieve nightly rates of $329 or more.
- Typical properties (Median) charge around $173 per night.
- Entry-level properties (Bottom 25%) earn around $125 per night.
Average Daily Rate (ADR) Trend by Month in Caldes de Montbui
Get Live Caldes de Montbui Market Intelligence 👇

Explore Real-time Analytics
Airbnb Seasonality Analysis & Trends in Caldes de Montbui (2025)
Peak Season (January, June, December)
- Revenue averages $2,830 per month
- Occupancy rates average 41.9%
- Daily rates average $249
Shoulder Season
- Revenue averages $1,646 per month
- Occupancy maintains around 26.2%
- Daily rates hold near $231
Low Season (February, March, September)
- Revenue drops to average $798 per month
- Occupancy decreases to average 21.9%
- Daily rates adjust to average $215
Seasonality Insights for Caldes de Montbui
- The Airbnb seasonality in Caldes de Montbui shows highly seasonal trends requiring careful strategy. While the sections above show seasonal averages, it's also insightful to look at the extremes:
- During the high season, the absolute peak month showcases Caldes de Montbui's highest earning potential, with monthly revenues capable of climbing to $3,111, occupancy reaching a high of 46.0%, and ADRs peaking at $252.
- Conversely, the slowest single month of the year, typically falling within the low season, marks the market's lowest point. In this month, revenue might dip to $627, occupancy could drop to 13.8%, and ADRs may adjust down to $191.
- Understanding both the seasonal averages and these monthly peaks and troughs in revenue, occupancy, and ADR is crucial for maximizing your Airbnb profit potential in Caldes de Montbui.
Seasonal Strategies for Maximizing Profit
- Peak Season: Maximize revenue through premium pricing and potentially longer minimum stays. Ensure high availability.
- Low Season: Offer competitive pricing, special promotions (e.g., extended stay discounts), and flexible cancellation policies. Target off-season travelers like remote workers or budget-conscious guests.
- Shoulder Seasons: Implement dynamic pricing that balances peak and low rates. Target weekend travelers or specific events. Offer slightly more flexible terms than peak season.
- Regularly analyze your own performance against these Caldes de Montbui seasonality benchmarks and adjust your pricing and availability strategy accordingly.
Best Areas for Airbnb Investment in Caldes de Montbui (2025)
Exploring the top neighborhoods for short-term rentals in Caldes de Montbui? This section highlights key areas, outlining why they are attractive for hosts and guests, along with notable local attractions. Consider these locations based on your target guest profile and investment strategy.
| Neighborhood / Area | Why Host Here? (Target Guests & Appeal) | Key Attractions & Landmarks |
|---|---|---|
| Caldes de Montbui Old Town | Charming historic town center with beautiful architecture and vibrant local culture. Popular among tourists looking for a quaint Spanish experience with access to local dining and shops. | Roman Baths, Church of Santa Maria, Caldes de Montbui Town Hall, Parc de les Olors, Carrer de l'Estació |
| La Mola | Scenic area just outside the town with beautiful natural landscapes. Ideal for nature lovers and those seeking outdoor activities such as hiking. | La Mola Mountain, Hiking trails, Nature parks, Picnic areas, Foix Reservoir |
| Spa de Caldes | Famous for its thermal springs and wellness spas, attracting visitors seeking relaxation and rejuvenation. Perfect for wellness retreats. | Thermal Baths, Spa Hotels, Wellness Centers, Wellness Workshops, Natural Springs |
| El Raval | A lively neighborhood known for its local bars and restaurants, drawing visitors looking for authentic regional dining experiences. | Local Tapas Bars, Gastronomic Markets, Cultural Events, Traditional Festivals, Food Tours |
| Sant Llorenç del Munt | A natural park offering hiking, cycling, and stunning views. Popular among outdoor enthusiasts and families. | Natural Park Trails, Scenic Overlooks, Wildlife Watching, Picnic Areas, Cycling Paths |
| Celler de Caldes | A local winery area known for producing wines that attract tourists interested in local viticulture and tastings. | Wine Tasting Events, Vineyard Tours, Wine Cellars, Local Wine Festivals, Gourmet Food Pairings |
| Parc de les Olors | A park offering sensory experiences with various flowers and plants, appealing to families and tourists seeking relaxation in nature. | Botanical Gardens, Play Areas for Kids, Picnic Spots, Nature Walks, Art Installations |
| Caldes Thermal Park | Dedicated park featuring thermal pools and recreational areas, great for families and tourists seeking fun and relaxation. | Thermal Pools, Family Recreation Areas, Sport Facilities, Children's Playgrounds, Outdoor Activities |
Understanding Airbnb License Requirements & STR Laws in Caldes de Montbui (2025)
Yes, Caldes de Montbui, Catalonia, Spain enforces high STR regulations. Obtaining a license and ensuring compliance is almost certainly required according to current 2025 STR laws. Always verify the latest short term rental regulations and Airbnb license requirements directly with local government authorities for Caldes de Montbui to ensure full compliance before hosting.
(Source: AirROI data, 2025, based on 95% licensed listings)
Top Performing Airbnb Properties in Caldes de Montbui (2025)
Benchmark your potential! Explore examples of top-performing Airbnb properties in Caldes de Montbuibased on Trailing Twelve Month (TTM) revenue. Analyze their characteristics, revenue, occupancy rate, and ADR to understand what drives success in this market.
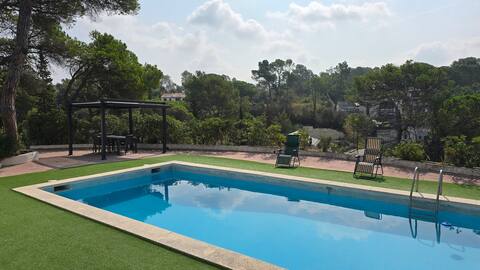
Villa in Can Valls
Entire Place • 6 bedrooms
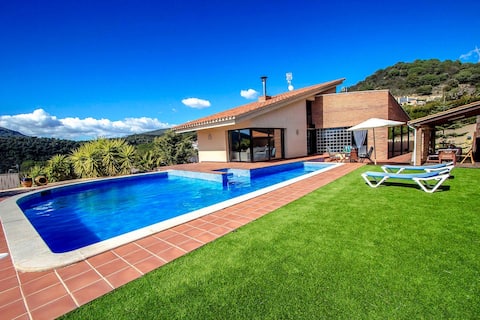
Stunning modern villa - just half hour to Barcelon
Entire Place • 4 bedrooms

Typical stone house next to BCN
Entire Place • 5 bedrooms
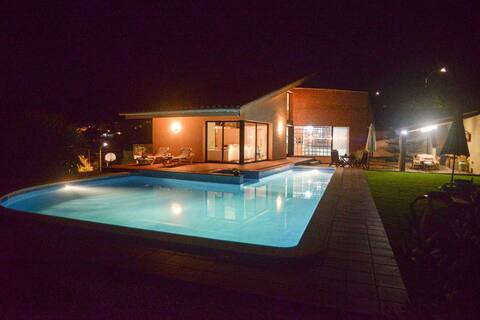
Holiday home 25 minutes from Barcelona.
Entire Place • 4 bedrooms

Village house 20 m from BCN
Entire Place • 2 bedrooms
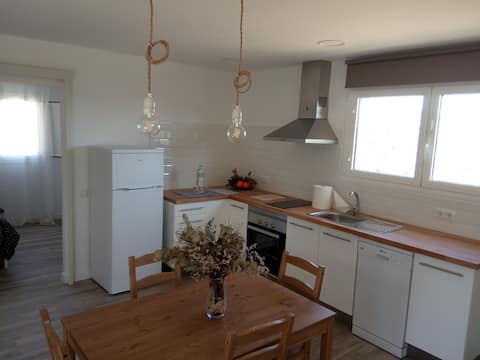
Countryside loft near Barcelona
Entire Place • 1 bedroom
Note: Performance varies based on location, size, amenities, seasonality, and management quality. Data reflects the past 12 months.
Top Performing Airbnb Hosts in Caldes de Montbui (2025)
Learn from the best! This table showcases top-performing Airbnb hosts in Caldes de Montbui based on the number of properties managed and estimated total revenue over the past year. Analyze their scale and performance metrics.
| Host Name | Properties | Grossing Revenue | Stay Reviews | Avg Rating |
|---|---|---|---|---|
| Paul | 1 | $60,733 | 14 | 4.57/5.0 |
| CatalunyaCasas | 1 | $52,580 | 26 | 4.69/5.0 |
| Leo | 1 | $44,474 | 165 | 4.81/5.0 |
| RV Hotels | 7 | $41,141 | 85 | 4.62/5.0 |
| Josep | 3 | $34,630 | 34 | 4.90/5.0 |
| Siscu | 2 | $30,755 | 95 | 4.96/5.0 |
| Joaquim | 1 | $30,182 | 23 | 4.91/5.0 |
| Gemma | 2 | $27,382 | 58 | 2.37/5.0 |
| RV Hotels | 1 | $16,321 | 32 | 4.47/5.0 |
Analyzing the strategies of top hosts, such as their property selection, pricing, and guest communication, can offer valuable lessons for optimizing your own Airbnb operations in Caldes de Montbui.
Dive Deeper: Advanced Caldes de Montbui STR Market Data (2025)
Ready to unlock more insights? AirROI provides access to advanced metrics and comprehensive Airbnb data for Caldes de Montbui. Explore detailed analytics beyond this report to refine your investment strategy, optimize pricing, and maximize your vacation rental profits.
Explore Advanced MetricsCaldes de Montbui Short-Term Rental Market Composition (2025): Property & Room Types
Room Type Distribution
Property Type Distribution
Market Composition Insights for Caldes de Montbui
- The Caldes de Montbui Airbnb market composition is heavily skewed towards Entire Home/Apt listings, which make up 52.6% of the 19 active rentals. This indicates strong guest preference for privacy and space.
- However, a notable 47.4% share for Private Rooms suggests opportunities for budget-conscious travelers or hosts renting out spare rooms.
- Looking at the property type distribution in Caldes de Montbui, Hotel/Boutique properties are the most common (52.6%), reflecting the local real estate landscape.
- Houses represent a significant 47.4% portion, catering likely to families or larger groups.
- The presence of 52.6% Hotel/Boutique listings indicates integration with traditional hospitality.
Caldes de Montbui Airbnb Room Capacity Analysis (2025): Bedroom Distribution
Distribution of Listings by Number of Bedrooms
Room Capacity Insights for Caldes de Montbui
- The dominant room capacity in Caldes de Montbui is 1 bedroom listings, making up 63.2% of the market. This suggests a strong demand for properties suitable for couples or solo travelers.
- Together, 1 bedroom and 4 bedrooms properties represent 73.7% of the active Airbnb listings in Caldes de Montbui, indicating a high concentration in these sizes.
- With over half the market (63.2%) consisting of studios or 1-bedroom units, Caldes de Montbui is particularly well-suited for individuals or couples.
- A significant 31.5% of listings offer 3+ bedrooms, catering to larger groups and families seeking more space in Caldes de Montbui.
Caldes de Montbui Vacation Rental Guest Capacity Trends (2025)
Distribution of Listings by Guest Capacity
Guest Capacity Insights for Caldes de Montbui
- The most common guest capacity trend in Caldes de Montbui vacation rentals is listings accommodating 2 guests (47.4%). This suggests the primary traveler segment is likely couples or solo travelers.
- Properties designed for 2 guests and 8+ guests dominate the Caldes de Montbui STR market, accounting for 84.2% of listings.
- A significant 52.7% of listings cater specifically to 1-2 guests, highlighting strong demand from couples and solo travelers in Caldes de Montbui.
- 36.8% of properties accommodate 6+ guests, serving the market segment for larger families or group travel in Caldes de Montbui.
- On average, properties in Caldes de Montbui are equipped to host 4.4 guests.
Caldes de Montbui Airbnb Booking Patterns (2025): Available vs. Booked Days
Available Days Distribution
Booked Days Distribution
Booking Pattern Insights for Caldes de Montbui
- The most common availability pattern in Caldes de Montbui falls within the 271-366 days range, representing 63.2% of listings. This suggests many properties have significant open periods on their calendars.
- Approximately 84.3% of listings show high availability (181+ days open annually), indicating potential for increased bookings or specific owner usage patterns.
- For booked days, the 31-90 days range is most frequent in Caldes de Montbui (36.8%), reflecting common guest stay durations or potential owner blocking patterns.
- A notable 15.8% of properties secure long booking periods (181+ days booked per year), highlighting successful long-term rental strategies or significant owner usage.
Caldes de Montbui Airbnb Minimum Stay Requirements Analysis
Distribution of Listings by Minimum Night Requirement
1 Night
9 listings
47.4% of total
2 Nights
3 listings
15.8% of total
3 Nights
4 listings
21.1% of total
4-6 Nights
3 listings
15.8% of total
Key Insights
- The most prevalent minimum stay requirement in Caldes de Montbui is 1 Night, adopted by 47.4% of listings. This highlights the market's preference for shorter, flexible bookings.
- A strong majority (63.2%) of the Caldes de Montbui Airbnb data shows acceptance of very short stays (1-2 nights), indicating a dynamic, high-turnover market.
Recommendations
- Align with the market by considering a 1 Night minimum stay, as 47.4% of Caldes de Montbui hosts use this setting.
- Adjust minimum nights based on seasonality – potentially shorter during low season and longer during peak demand periods in Caldes de Montbui.
Caldes de Montbui Airbnb Cancellation Policy Trends Analysis (2025)
Flexible
2 listings
11.1% of total
Moderate
9 listings
50% of total
Firm
3 listings
16.7% of total
Strict
4 listings
22.2% of total
Cancellation Policy Insights for Caldes de Montbui
- The prevailing Airbnb cancellation policy trend in Caldes de Montbui is Moderate, used by 50% of listings.
- There's a relatively balanced mix between guest-friendly (61.1%) and stricter (38.9%) policies, offering choices for different guest needs.
Recommendations for Hosts
- Consider adopting a Moderate policy to align with the 50% market standard in Caldes de Montbui.
- Regularly review your cancellation policy against competitors and market demand shifts in Caldes de Montbui.
Caldes de Montbui STR Booking Lead Time Analysis (2025)
Average Booking Lead Time by Month
Booking Lead Time Insights for Caldes de Montbui
- The overall average booking lead time for vacation rentals in Caldes de Montbui is 76 days.
- Guests book furthest in advance for stays during June (average 163 days), likely coinciding with peak travel demand or local events.
- The shortest booking windows occur for stays in July (average 31 days), indicating more last-minute travel plans during this time.
- Seasonally, Spring (112 days avg.) sees the longest lead times, while Winter (64 days avg.) has the shortest, reflecting typical travel planning cycles.
Recommendations for Hosts
- Use the overall average lead time (76 days) as a baseline for your pricing and availability strategy in Caldes de Montbui.
- For June stays, consider implementing length-of-stay discounts or slightly higher rates for bookings made less than 163 days out to capitalize on advance planning.
- Target marketing efforts for the Spring season well in advance (at least 112 days) to capture early planners.
- Monitor your own booking lead times against these Caldes de Montbui averages to identify opportunities for dynamic pricing adjustments.
Popular & Essential Airbnb Amenities in Caldes de Montbui (2025)
Amenity Prevalence
Amenity Insights for Caldes de Montbui
- Popular amenities like Hangers, Essentials, Hair dryer are common but not universal. Offering these can provide a competitive edge.
- A pool is a highly desired but not standard amenity, making it a key feature for attracting guests seeking leisure in Caldes de Montbui.
Recommendations for Hosts
- Consider adding popular differentiators like Hangers or Essentials to increase appeal.
- Highlight unique or less common amenities you offer (e.g., hot tub, dedicated workspace, EV charger) in your listing description and photos.
- Regularly check competitor amenities in Caldes de Montbui to stay competitive.
Caldes de Montbui Airbnb Guest Demographics & Profile Analysis (2025)
Guest Profile Summary for Caldes de Montbui
- The typical guest profile for Airbnb in Caldes de Montbui consists of predominantly international visitors (68%), with top international origins including France, typically belonging to the Post-2000s (Gen Z/Alpha) group (50%), primarily speaking English or Spanish.
- Domestic travelers account for 32.1% of guests.
- Key international markets include Spain (32.1%) and France (29.8%).
- Top languages spoken are English (32.6%) followed by Spanish (28.4%).
- A significant demographic segment is the Post-2000s (Gen Z/Alpha) group, representing 50% of guests.
Recommendations for Hosts
- Focus marketing internationally, particularly towards travelers from France.
- Tailor amenities and listing descriptions to appeal to the dominant Post-2000s (Gen Z/Alpha) demographic (e.g., highlight fast WiFi, smart home features, local guides).
- Highlight unique local experiences or amenities relevant to the primary guest profile.
- Consider seasonal promotions aligned with peak travel times for key origin markets.
Nearby Short-Term Rental Market Comparison
How does the Caldes de Montbui Airbnb market stack up against its neighbors? Compare key performance metrics like average monthly revenue, ADR, and occupancy rates in surrounding areas to understand the broader regional STR landscape.
| Market | Active Properties | Monthly Revenue | Daily Rate | Avg. Occupancy |
|---|---|---|---|---|
| Vall-llobrega | 15 | $10,261 | $798.88 | 44% |
| Canyelles | 49 | $5,958 | $1023.94 | 37% |
| Arenys de Munt | 28 | $5,100 | $514.27 | 41% |
| Teià | 25 | $5,027 | $348.45 | 45% |
| Cornellà del Terri | 17 | $4,960 | $460.96 | 41% |
| Tiana | 12 | $4,955 | $299.97 | 48% |
| Amer | 10 | $4,848 | $397.58 | 40% |
| Bescanó | 11 | $4,761 | $445.38 | 41% |
| Porqueres | 12 | $4,714 | $469.05 | 36% |
| Premià de Dalt | 28 | $4,630 | $345.43 | 49% |