Balaguer Airbnb Market Analysis 2025: Short Term Rental Data & Vacation Rental Statistics in Catalonia, Spain
Is Airbnb profitable in Balaguer in 2025? Explore comprehensive Airbnb analytics for Balaguer, Catalonia, Spain to uncover income potential. This 2025 STR market report for Balaguer, based on AirROI data from April 2024 to March 2025, reveals key trends in the niche market of 21 active listings.
Whether you're considering an Airbnb investment in Balaguer, optimizing your existing vacation rental, or exploring rental arbitrage opportunities, understanding the Balaguer Airbnb data is crucial. Navigating the high regulation landscape is key to maximizing your short term rental income potential. Let's dive into the specifics.
Key Balaguer Airbnb Performance Metrics Overview
Monthly Airbnb Revenue Variations & Income Potential in Balaguer (2025)
Understanding the monthly revenue variations for Airbnb listings in Balaguer is key to maximizing your short term rental income potential. Seasonality significantly impacts earnings. Our analysis, based on data from the past 12 months, shows that the peak revenue month for STRs in Balaguer is typically August, while January often presents the lowest earnings, highlighting opportunities for strategic pricing adjustments during shoulder and low seasons. Explore the typical Airbnb income in Balaguer across different performance tiers:
- Best-in-class properties (Top 10%) achieve $3,188+ monthly, often utilizing dynamic pricing and superior guest experiences.
- Strong performing properties (Top 25%) earn $2,043 or more, indicating effective management and desirable locations/amenities.
- Typical properties (Median) generate around $954 per month, representing the average market performance.
- Entry-level properties (Bottom 25%) see earnings around $544, often with potential for optimization.
Average Monthly Airbnb Earnings Trend in Balaguer
Balaguer Airbnb Occupancy Rate Trends (2025)
Maximize your bookings by understanding the Balaguer STR occupancy trends. Seasonal demand shifts significantly influence how often properties are booked. Typically, Augustsees the highest demand (peak season occupancy), while April experiences the lowest (low season). Effective strategies, like adjusting minimum stays or offering promotions, can boost occupancy during slower periods. Here's how different property tiers perform in Balaguer:
- Best-in-class properties (Top 10%) achieve 72%+ occupancy, indicating high desirability and potentially optimized availability.
- Strong performing properties (Top 25%) maintain 53% or higher occupancy, suggesting good market fit and guest satisfaction.
- Typical properties (Median) have an occupancy rate around 19%.
- Entry-level properties (Bottom 25%) average 11% occupancy, potentially facing higher vacancy.
Average Monthly Occupancy Rate Trend in Balaguer
Average Daily Rate (ADR) Airbnb Trends in Balaguer (2025)
Effective short term rental pricing strategy in Balaguer involves understanding monthly ADR fluctuations. The Average Daily Rate (ADR) for Airbnb in Balaguer typically peaks in December and dips lowest during September. Leveraging Airbnb dynamic pricing tools or strategies based on this seasonality can significantly boost revenue. Here's a look at the typical nightly rates achieved:
- Best-in-class properties (Top 10%) command rates of $298+ per night, often due to premium features or locations.
- Strong performing properties (Top 25%) achieve nightly rates of $204 or more.
- Typical properties (Median) charge around $136 per night.
- Entry-level properties (Bottom 25%) earn around $79 per night.
Average Daily Rate (ADR) Trend by Month in Balaguer
Get Live Balaguer Market Intelligence 👇

Explore Real-time Analytics
Airbnb Seasonality Analysis & Trends in Balaguer (2025)
Peak Season (August, July, September)
- Revenue averages $2,197 per month
- Occupancy rates average 42.0%
- Daily rates average $168
Shoulder Season
- Revenue averages $1,375 per month
- Occupancy maintains around 29.3%
- Daily rates hold near $174
Low Season (January, February, March)
- Revenue drops to average $877 per month
- Occupancy decreases to average 30.0%
- Daily rates adjust to average $181
Seasonality Insights for Balaguer
- The Airbnb seasonality in Balaguer shows highly seasonal trends requiring careful strategy. While the sections above show seasonal averages, it's also insightful to look at the extremes:
- During the high season, the absolute peak month showcases Balaguer's highest earning potential, with monthly revenues capable of climbing to $2,540, occupancy reaching a high of 50.3%, and ADRs peaking at $183.
- Conversely, the slowest single month of the year, typically falling within the low season, marks the market's lowest point. In this month, revenue might dip to $817, occupancy could drop to 24.4%, and ADRs may adjust down to $165.
- Understanding both the seasonal averages and these monthly peaks and troughs in revenue, occupancy, and ADR is crucial for maximizing your Airbnb profit potential in Balaguer.
Seasonal Strategies for Maximizing Profit
- Peak Season: Maximize revenue through premium pricing and potentially longer minimum stays. Ensure high availability.
- Low Season: Offer competitive pricing, special promotions (e.g., extended stay discounts), and flexible cancellation policies. Target off-season travelers like remote workers or budget-conscious guests.
- Shoulder Seasons: Implement dynamic pricing that balances peak and low rates. Target weekend travelers or specific events. Offer slightly more flexible terms than peak season.
- Regularly analyze your own performance against these Balaguer seasonality benchmarks and adjust your pricing and availability strategy accordingly.
Best Areas for Airbnb Investment in Balaguer (2025)
Exploring the top neighborhoods for short-term rentals in Balaguer? This section highlights key areas, outlining why they are attractive for hosts and guests, along with notable local attractions. Consider these locations based on your target guest profile and investment strategy.
| Neighborhood / Area | Why Host Here? (Target Guests & Appeal) | Key Attractions & Landmarks |
|---|---|---|
| Old Town Balaguer | A historic area filled with medieval architecture and charming streets, perfect for tourists looking to explore local culture and history. | Balaguer Castle, Santa Maria de Balaguer, Museum of the Balaguer Region, L'Estany, Carrer del Canyeret |
| La Noguera | A natural area surrounding Balaguer, popular for outdoor activities and nature lovers looking for a peaceful retreat. | Montsec Mountain Range, Canyoning in the River Noguera, Hiking trails, Birdwatching sites, Fishing in local rivers |
| Balaguer Waterfront | The scenic banks of the River Noguera offer a picturesque place for walks and relaxation, attractive to families and travelers seeking leisure. | Paseo del Río Noguera, Parks along the river, Bike rental services, Outdoor cafes, Playgrounds |
| Cultural Center | Home to local events and cultural activities, this area draws those interested in local art and community events, making it a hub for visitors. | Teatre de Balaguer, Local art galleries, Fairs and festivals, Art workshops, Cultural exhibits |
| Ronda de Balaguer | A vibrant area close to shops and restaurants, perfect for those looking for convenience and accessibility during their stay. | Shopping streets, Local eateries, Markets, Nearby grocery stores, Cafes |
| Balaguer Park | A large green space ideal for families and nature enthusiasts, featuring walking paths, playgrounds, and picnic areas. | Playground, Picnic areas, Walking paths, Green gardens, Outdoor fitness equipment |
| Sports Complex | attracts sports enthusiasts and families, providing facilities for various outdoor activities and events. | Sports fields, Gyms, Outdoor swimming pool, Playgrounds, Event hosting |
| Gastronomy Hub | A growing area known for local food and wine, ideal for foodies looking to experience Catalonian cuisine and wines. | Local vineyards, Traditional Catalan restaurants, Food markets, Cooking classes, Wine tasting tours |
Understanding Airbnb License Requirements & STR Laws in Balaguer (2025)
Yes, Balaguer, Catalonia, Spain enforces high STR regulations. Obtaining a license and ensuring compliance is almost certainly required according to current 2025 STR laws. Always verify the latest short term rental regulations and Airbnb license requirements directly with local government authorities for Balaguer to ensure full compliance before hosting.
(Source: AirROI data, 2025, based on 86% licensed listings)
Top Performing Airbnb Properties in Balaguer (2025)
Benchmark your potential! Explore examples of top-performing Airbnb properties in Balaguerbased on Trailing Twelve Month (TTM) revenue. Analyze their characteristics, revenue, occupancy rate, and ADR to understand what drives success in this market.
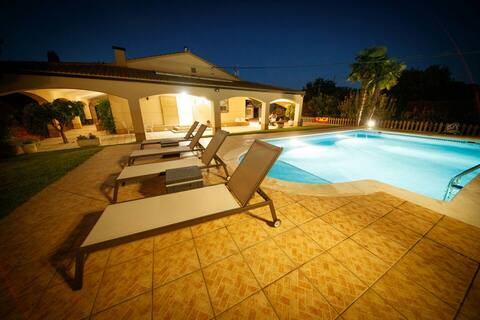
Cottage, with pool and 2500 meters of garden
Entire Place • 3 bedrooms
Ca la Josefa, BBQ grill, fireplace, 9 pax.
Entire Place • 4 bedrooms

Musicians' house | Balaguer | 8 people
Entire Place • 3 bedrooms
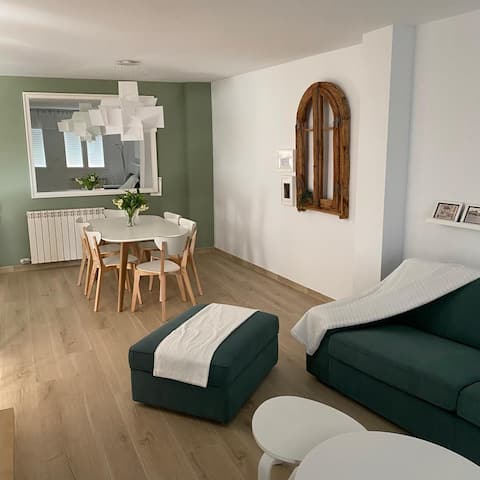
Cozy Duplex in Balaguer
Entire Place • 5 bedrooms
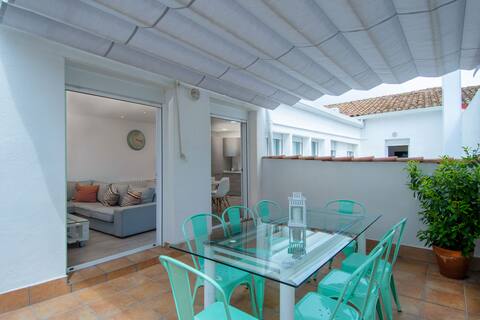
Apartment in the old town overlooking the river
Entire Place • 3 bedrooms

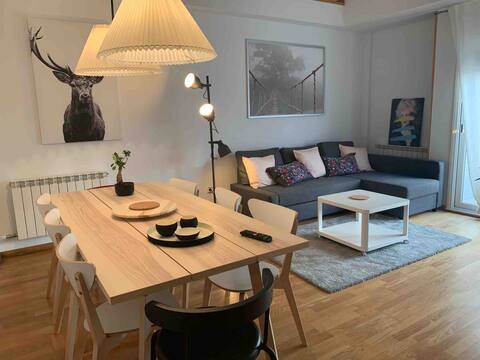
Newly renovated apartment overlooking the river
Entire Place • 2 bedrooms
Note: Performance varies based on location, size, amenities, seasonality, and management quality. Data reflects the past 12 months.
Top Performing Airbnb Hosts in Balaguer (2025)
Learn from the best! This table showcases top-performing Airbnb hosts in Balaguer based on the number of properties managed and estimated total revenue over the past year. Analyze their scale and performance metrics.
| Host Name | Properties | Grossing Revenue | Stay Reviews | Avg Rating |
|---|---|---|---|---|
| Gentilhome 1877 , S.L. | 7 | $48,057 | 17 | 2.86/5.0 |
| Mireia | 3 | $47,885 | 97 | 4.84/5.0 |
| Felix | 1 | $36,048 | 103 | 4.96/5.0 |
| Maria Jose | 2 | $35,465 | 243 | 4.92/5.0 |
| Joan Carles | 1 | $32,002 | 69 | 4.97/5.0 |
| Antònia | 1 | $16,607 | 12 | 5.00/5.0 |
| Noelia | 1 | $10,720 | 41 | 4.66/5.0 |
| Teresa | 2 | $9,697 | 36 | 4.64/5.0 |
| Robert & Núria | 1 | $9,269 | 14 | 4.86/5.0 |
| Borja | 1 | $8,375 | 98 | 4.78/5.0 |
Analyzing the strategies of top hosts, such as their property selection, pricing, and guest communication, can offer valuable lessons for optimizing your own Airbnb operations in Balaguer.
Dive Deeper: Advanced Balaguer STR Market Data (2025)
Ready to unlock more insights? AirROI provides access to advanced metrics and comprehensive Airbnb data for Balaguer. Explore detailed analytics beyond this report to refine your investment strategy, optimize pricing, and maximize your vacation rental profits.
Explore Advanced MetricsBalaguer Short-Term Rental Market Composition (2025): Property & Room Types
Room Type Distribution
Property Type Distribution
Market Composition Insights for Balaguer
- The Balaguer Airbnb market composition is heavily skewed towards Entire Home/Apt listings, which make up 85.7% of the 21 active rentals. This indicates strong guest preference for privacy and space.
- Looking at the property type distribution in Balaguer, Apartment/Condo properties are the most common (71.4%), reflecting the local real estate landscape.
- The presence of 14.3% Hotel/Boutique listings indicates integration with traditional hospitality.
Balaguer Airbnb Room Capacity Analysis (2025): Bedroom Distribution
Distribution of Listings by Number of Bedrooms
Room Capacity Insights for Balaguer
- The dominant room capacity in Balaguer is 1 bedroom listings, making up 38.1% of the market. This suggests a strong demand for properties suitable for couples or solo travelers.
- Together, 1 bedroom and 2 bedrooms properties represent 66.7% of the active Airbnb listings in Balaguer, indicating a high concentration in these sizes.
- A significant 33.3% of listings offer 3+ bedrooms, catering to larger groups and families seeking more space in Balaguer.
Balaguer Vacation Rental Guest Capacity Trends (2025)
Distribution of Listings by Guest Capacity
Guest Capacity Insights for Balaguer
- The most common guest capacity trend in Balaguer vacation rentals is listings accommodating 8+ guests (28.6%). This suggests the primary traveler segment is likely larger groups.
- Properties designed for 8+ guests and 6 guests dominate the Balaguer STR market, accounting for 52.4% of listings.
- 52.4% of properties accommodate 6+ guests, serving the market segment for larger families or group travel in Balaguer.
- On average, properties in Balaguer are equipped to host 5.5 guests.
Balaguer Airbnb Booking Patterns (2025): Available vs. Booked Days
Available Days Distribution
Booked Days Distribution
Booking Pattern Insights for Balaguer
- The most common availability pattern in Balaguer falls within the 271-366 days range, representing 61.9% of listings. This suggests many properties have significant open periods on their calendars.
- Approximately 85.7% of listings show high availability (181+ days open annually), indicating potential for increased bookings or specific owner usage patterns.
- For booked days, the 31-90 days range is most frequent in Balaguer (38.1%), reflecting common guest stay durations or potential owner blocking patterns.
- A notable 14.3% of properties secure long booking periods (181+ days booked per year), highlighting successful long-term rental strategies or significant owner usage.
Balaguer Airbnb Minimum Stay Requirements Analysis
Distribution of Listings by Minimum Night Requirement
1 Night
10 listings
47.6% of total
2 Nights
9 listings
42.9% of total
3 Nights
1 listings
4.8% of total
4-6 Nights
1 listings
4.8% of total
Key Insights
- The most prevalent minimum stay requirement in Balaguer is 1 Night, adopted by 47.6% of listings. This highlights the market's preference for shorter, flexible bookings.
- A strong majority (90.5%) of the Balaguer Airbnb data shows acceptance of very short stays (1-2 nights), indicating a dynamic, high-turnover market.
Recommendations
- Align with the market by considering a 1 Night minimum stay, as 47.6% of Balaguer hosts use this setting.
- Adjust minimum nights based on seasonality – potentially shorter during low season and longer during peak demand periods in Balaguer.
Balaguer Airbnb Cancellation Policy Trends Analysis (2025)
Flexible
9 listings
50% of total
Moderate
5 listings
27.8% of total
Strict
4 listings
22.2% of total
Cancellation Policy Insights for Balaguer
- The prevailing Airbnb cancellation policy trend in Balaguer is Flexible, used by 50% of listings.
- The market strongly favors guest-friendly terms, with 77.8% of listings offering Flexible or Moderate policies. This suggests guests in Balaguer may expect booking flexibility.
Recommendations for Hosts
- Consider adopting a Flexible policy to align with the 50% market standard in Balaguer.
- Regularly review your cancellation policy against competitors and market demand shifts in Balaguer.
Balaguer STR Booking Lead Time Analysis (2025)
Average Booking Lead Time by Month
Booking Lead Time Insights for Balaguer
- The overall average booking lead time for vacation rentals in Balaguer is 45 days.
- Guests book furthest in advance for stays during April (average 74 days), likely coinciding with peak travel demand or local events.
- The shortest booking windows occur for stays in January (average 18 days), indicating more last-minute travel plans during this time.
- Seasonally, Fall (55 days avg.) sees the longest lead times, while Winter (23 days avg.) has the shortest, reflecting typical travel planning cycles.
Recommendations for Hosts
- Use the overall average lead time (45 days) as a baseline for your pricing and availability strategy in Balaguer.
- For April stays, consider implementing length-of-stay discounts or slightly higher rates for bookings made less than 74 days out to capitalize on advance planning.
- Target marketing efforts for the Fall season well in advance (at least 55 days) to capture early planners.
- Monitor your own booking lead times against these Balaguer averages to identify opportunities for dynamic pricing adjustments.
Popular & Essential Airbnb Amenities in Balaguer (2025)
Amenity Prevalence
Amenity Insights for Balaguer
- Essential amenities in Balaguer that guests expect include: Kitchen, Essentials, Hot water, Wifi. Lacking these (any) could significantly impact bookings.
- Popular amenities like Heating, TV, Washer are common but not universal. Offering these can provide a competitive edge.
Recommendations for Hosts
- Ensure your listing includes all essential amenities for Balaguer: Kitchen, Essentials, Hot water, Wifi.
- Prioritize adding missing essentials: Hot water, Wifi.
- Consider adding popular differentiators like Heating or TV to increase appeal.
- Highlight unique or less common amenities you offer (e.g., hot tub, dedicated workspace, EV charger) in your listing description and photos.
- Regularly check competitor amenities in Balaguer to stay competitive.
Balaguer Airbnb Guest Demographics & Profile Analysis (2025)
Guest Profile Summary for Balaguer
- The typical guest profile for Airbnb in Balaguer consists of a mix of domestic (58%) and international guests, often arriving from nearby Barcelona, typically belonging to the Post-2000s (Gen Z/Alpha) group (50%), primarily speaking English or Spanish.
- Domestic travelers account for 58.3% of guests.
- Key international markets include Spain (58.3%) and France (14.6%).
- Top languages spoken are English (28.2%) followed by Spanish (26.6%).
- A significant demographic segment is the Post-2000s (Gen Z/Alpha) group, representing 50% of guests.
Recommendations for Hosts
- Balance marketing efforts between domestic and international channels based on the guest mix.
- Tailor amenities and listing descriptions to appeal to the dominant Post-2000s (Gen Z/Alpha) demographic (e.g., highlight fast WiFi, smart home features, local guides).
- Highlight unique local experiences or amenities relevant to the primary guest profile.
- Consider seasonal promotions aligned with peak travel times for key origin markets.
Nearby Short-Term Rental Market Comparison
How does the Balaguer Airbnb market stack up against its neighbors? Compare key performance metrics like average monthly revenue, ADR, and occupancy rates in surrounding areas to understand the broader regional STR landscape.
| Market | Active Properties | Monthly Revenue | Daily Rate | Avg. Occupancy |
|---|---|---|---|---|
| Canyelles | 49 | $5,958 | $1023.94 | 37% |
| la Baronia de Rialb | 14 | $4,296 | $393.88 | 43% |
| Sant Martí Sarroca | 10 | $3,855 | $337.60 | 43% |
| Banyeres del Penedès | 12 | $3,474 | $373.99 | 37% |
| Mediona | 11 | $3,355 | $550.99 | 37% |
| Corbera de Llobregat | 14 | $3,275 | $304.33 | 52% |
| Riudoms | 10 | $3,270 | $363.84 | 36% |
| Olivella | 94 | $3,211 | $420.71 | 41% |
| Castellet i la Gornal | 15 | $3,167 | $465.42 | 39% |
| Aiguamúrcia | 11 | $3,008 | $223.61 | 47% |