Talavera de la Reina Airbnb Market Analysis 2025: Short Term Rental Data & Vacation Rental Statistics in Castile-La Mancha, Spain
Is Airbnb profitable in Talavera de la Reina in 2025? Explore comprehensive Airbnb analytics for Talavera de la Reina, Castile-La Mancha, Spain to uncover income potential. This 2025 STR market report for Talavera de la Reina, based on AirROI data from April 2024 to March 2025, reveals key trends in the niche market of 61 active listings.
Whether you're considering an Airbnb investment in Talavera de la Reina, optimizing your existing vacation rental, or exploring rental arbitrage opportunities, understanding the Talavera de la Reina Airbnb data is crucial. Leveraging the low regulation environment is key to maximizing your short term rental income potential. Let's dive into the specifics.
Key Talavera de la Reina Airbnb Performance Metrics Overview
Monthly Airbnb Revenue Variations & Income Potential in Talavera de la Reina (2025)
Understanding the monthly revenue variations for Airbnb listings in Talavera de la Reina is key to maximizing your short term rental income potential. Seasonality significantly impacts earnings. Our analysis, based on data from the past 12 months, shows that the peak revenue month for STRs in Talavera de la Reina is typically June, while January often presents the lowest earnings, highlighting opportunities for strategic pricing adjustments during shoulder and low seasons. Explore the typical Airbnb income in Talavera de la Reina across different performance tiers:
- Best-in-class properties (Top 10%) achieve $2,538+ monthly, often utilizing dynamic pricing and superior guest experiences.
- Strong performing properties (Top 25%) earn $1,450 or more, indicating effective management and desirable locations/amenities.
- Typical properties (Median) generate around $881 per month, representing the average market performance.
- Entry-level properties (Bottom 25%) see earnings around $489, often with potential for optimization.
Average Monthly Airbnb Earnings Trend in Talavera de la Reina
Talavera de la Reina Airbnb Occupancy Rate Trends (2025)
Maximize your bookings by understanding the Talavera de la Reina STR occupancy trends. Seasonal demand shifts significantly influence how often properties are booked. Typically, Aprilsees the highest demand (peak season occupancy), while January experiences the lowest (low season). Effective strategies, like adjusting minimum stays or offering promotions, can boost occupancy during slower periods. Here's how different property tiers perform in Talavera de la Reina:
- Best-in-class properties (Top 10%) achieve 73%+ occupancy, indicating high desirability and potentially optimized availability.
- Strong performing properties (Top 25%) maintain 51% or higher occupancy, suggesting good market fit and guest satisfaction.
- Typical properties (Median) have an occupancy rate around 31%.
- Entry-level properties (Bottom 25%) average 17% occupancy, potentially facing higher vacancy.
Average Monthly Occupancy Rate Trend in Talavera de la Reina
Average Daily Rate (ADR) Airbnb Trends in Talavera de la Reina (2025)
Effective short term rental pricing strategy in Talavera de la Reina involves understanding monthly ADR fluctuations. The Average Daily Rate (ADR) for Airbnb in Talavera de la Reina typically peaks in December and dips lowest during September. Leveraging Airbnb dynamic pricing tools or strategies based on this seasonality can significantly boost revenue. Here's a look at the typical nightly rates achieved:
- Best-in-class properties (Top 10%) command rates of $179+ per night, often due to premium features or locations.
- Strong performing properties (Top 25%) achieve nightly rates of $115 or more.
- Typical properties (Median) charge around $74 per night.
- Entry-level properties (Bottom 25%) earn around $57 per night.
Average Daily Rate (ADR) Trend by Month in Talavera de la Reina
Get Live Talavera de la Reina Market Intelligence 👇

Explore Real-time Analytics
Airbnb Seasonality Analysis & Trends in Talavera de la Reina (2025)
Peak Season (June, May, April)
- Revenue averages $2,092 per month
- Occupancy rates average 41.4%
- Daily rates average $102
Shoulder Season
- Revenue averages $1,093 per month
- Occupancy maintains around 35.0%
- Daily rates hold near $106
Low Season (January, February, November)
- Revenue drops to average $834 per month
- Occupancy decreases to average 30.3%
- Daily rates adjust to average $114
Seasonality Insights for Talavera de la Reina
- The Airbnb seasonality in Talavera de la Reina shows highly seasonal trends requiring careful strategy. While the sections above show seasonal averages, it's also insightful to look at the extremes:
- During the high season, the absolute peak month showcases Talavera de la Reina's highest earning potential, with monthly revenues capable of climbing to $2,106, occupancy reaching a high of 43.6%, and ADRs peaking at $119.
- Conversely, the slowest single month of the year, typically falling within the low season, marks the market's lowest point. In this month, revenue might dip to $804, occupancy could drop to 27.9%, and ADRs may adjust down to $100.
- Understanding both the seasonal averages and these monthly peaks and troughs in revenue, occupancy, and ADR is crucial for maximizing your Airbnb profit potential in Talavera de la Reina.
Seasonal Strategies for Maximizing Profit
- Peak Season: Maximize revenue through premium pricing and potentially longer minimum stays. Ensure high availability.
- Low Season: Offer competitive pricing, special promotions (e.g., extended stay discounts), and flexible cancellation policies. Target off-season travelers like remote workers or budget-conscious guests.
- Shoulder Seasons: Implement dynamic pricing that balances peak and low rates. Target weekend travelers or specific events. Offer slightly more flexible terms than peak season.
- Regularly analyze your own performance against these Talavera de la Reina seasonality benchmarks and adjust your pricing and availability strategy accordingly.
Best Areas for Airbnb Investment in Talavera de la Reina (2025)
Exploring the top neighborhoods for short-term rentals in Talavera de la Reina? This section highlights key areas, outlining why they are attractive for hosts and guests, along with notable local attractions. Consider these locations based on your target guest profile and investment strategy.
| Neighborhood / Area | Why Host Here? (Target Guests & Appeal) | Key Attractions & Landmarks |
|---|---|---|
| Centro Histórico | The historical center of Talavera de la Reina is rich in culture and architecture, making it an attractive location for tourists seeking to explore its heritage and local cuisine. | Gerardo de Rojas Theatre, Talavera Cathedral, Bullring of Talavera, Ceramics Museum, Plaza del Pan |
| Río Tajo | This area offers scenic views of the Tajo River, perfect for outdoor activities and relaxation. It's popular among locals and tourists for riverside walks and parks. | Riverfront promenade, Río Tajo Natural Park, Parks and picnic areas, Kayaking opportunities, Historic watermills |
| Talavera Park | A large green space in the city that attracts families and nature lovers. Ideal for those looking to escape the urban environment while still being close to city amenities. | Playgrounds, Walking trails, Natural ponds, Open-air concerts, Cafes in the park |
| Cerro de los Ángeles | A stunning viewpoint and a religious site that offers a panoramic view of Talavera. It attracts visitors looking for a unique experience and local religious pilgrims. | Virgin of the Angels Sanctuary, Hiking trails, Viewpoint, Nature reserves, Historical significance |
| La Estación | This area is close to the train station, making it convenient for travelers. It has a mix of residential and commercial spaces, catering to different types of visitors. | Train Station, Shopping centers, Restaurants and cafes, Access to public transport, Local markets |
| Zona comercial de Talavera | The commercial zone is bustling with shops and businesses, ideal for travelers looking to explore local commerce while enjoying their stay. | Shopping malls, Local boutiques, Gastro bars, Cafes and restaurants, Cultural events |
| El Prado | A quiet, residential neighborhood that offers a peaceful atmosphere. Perfect for families or travelers wanting a retreat from the city center's hustle and bustle. | Local parks, Family-friendly activities, Quiet streets, Community events, Local shops |
| Talavera de la Reina’s Old Town | With narrow streets and charming architecture, the Old Town offers an authentic experience of Spanish lifestyle and traditions, drawing in cultural enthusiasts. | Old Town Square, Historical buildings, Local craft shops, Traditional restaurants, Cultural festivals |
Understanding Airbnb License Requirements & STR Laws in Talavera de la Reina (2025)
While Talavera de la Reina, Castile-La Mancha, Spain currently shows low STR regulations, specific Airbnb license requirements might still exist or change. Always verify the latest short term rental regulations and Airbnb license requirements directly with local government authorities for Talavera de la Reina to ensure full compliance before hosting.
(Source: AirROI data, 2025, based on 7% licensed listings)
Top Performing Airbnb Properties in Talavera de la Reina (2025)
Benchmark your potential! Explore examples of top-performing Airbnb properties in Talavera de la Reinabased on Trailing Twelve Month (TTM) revenue. Analyze their characteristics, revenue, occupancy rate, and ADR to understand what drives success in this market.

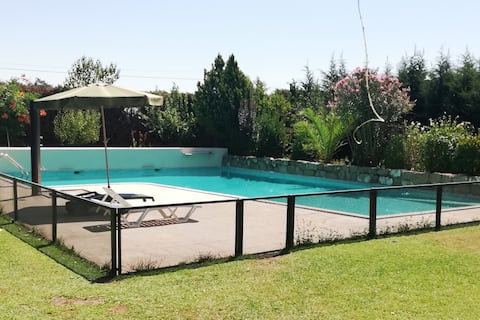
Cheerful cottage with pool
Entire Place • 5 bedrooms
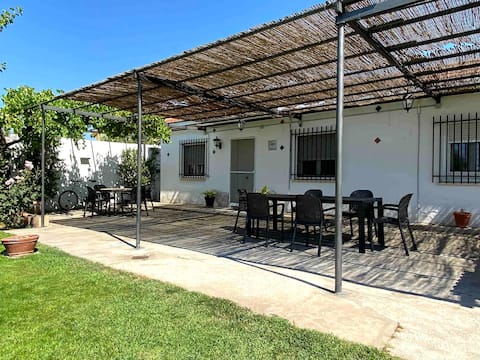
Casa de Campo en Finca La Pastera
Entire Place • 4 bedrooms
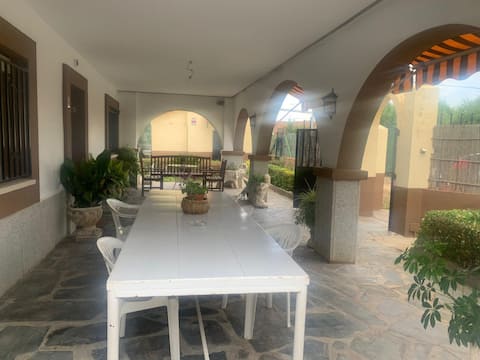
Casa rural "La Huerta"
Entire Place • 3 bedrooms

Apartment Mimosa Home
Entire Place • 2 bedrooms
Casa Familiar La Cabra
Entire Place • 5 bedrooms

Ribera del Tajo Apartment
Entire Place • 6 bedrooms
Note: Performance varies based on location, size, amenities, seasonality, and management quality. Data reflects the past 12 months.
Top Performing Airbnb Hosts in Talavera de la Reina (2025)
Learn from the best! This table showcases top-performing Airbnb hosts in Talavera de la Reina based on the number of properties managed and estimated total revenue over the past year. Analyze their scale and performance metrics.
| Host Name | Properties | Grossing Revenue | Stay Reviews | Avg Rating |
|---|---|---|---|---|
| Ana Belén | 1 | $123,864 | 13 | 4.92/5.0 |
| Jesús | 3 | $50,045 | 30 | 4.98/5.0 |
| José Ignacio | 1 | $35,402 | 95 | 4.74/5.0 |
| Silvia | 4 | $34,942 | 91 | 4.78/5.0 |
| Prado | 2 | $31,716 | 87 | 4.91/5.0 |
| Pedro | 2 | $29,902 | 23 | 4.91/5.0 |
| Carmelo | 4 | $29,719 | 45 | 3.29/5.0 |
| Sarabel | 2 | $29,686 | 24 | 4.21/5.0 |
| Constanza | 1 | $29,093 | 52 | 4.88/5.0 |
| Wofy Rooms | 4 | $28,819 | 60 | 4.13/5.0 |
Analyzing the strategies of top hosts, such as their property selection, pricing, and guest communication, can offer valuable lessons for optimizing your own Airbnb operations in Talavera de la Reina.
Dive Deeper: Advanced Talavera de la Reina STR Market Data (2025)
Ready to unlock more insights? AirROI provides access to advanced metrics and comprehensive Airbnb data for Talavera de la Reina. Explore detailed analytics beyond this report to refine your investment strategy, optimize pricing, and maximize your vacation rental profits.
Explore Advanced MetricsTalavera de la Reina Short-Term Rental Market Composition (2025): Property & Room Types
Room Type Distribution
Property Type Distribution
Market Composition Insights for Talavera de la Reina
- The Talavera de la Reina Airbnb market composition is heavily skewed towards Entire Home/Apt listings, which make up 63.9% of the 61 active rentals. This indicates strong guest preference for privacy and space.
- However, a notable 36.1% share for Private Rooms suggests opportunities for budget-conscious travelers or hosts renting out spare rooms.
- Looking at the property type distribution in Talavera de la Reina, Apartment/Condo properties are the most common (60.7%), reflecting the local real estate landscape.
- The presence of 24.6% Hotel/Boutique listings indicates integration with traditional hospitality.
Talavera de la Reina Airbnb Room Capacity Analysis (2025): Bedroom Distribution
Distribution of Listings by Number of Bedrooms
Room Capacity Insights for Talavera de la Reina
- The dominant room capacity in Talavera de la Reina is 1 bedroom listings, making up 37.7% of the market. This suggests a strong demand for properties suitable for couples or solo travelers.
- Together, 1 bedroom and 2 bedrooms properties represent 65.6% of the active Airbnb listings in Talavera de la Reina, indicating a high concentration in these sizes.
- A significant 24.6% of listings offer 3+ bedrooms, catering to larger groups and families seeking more space in Talavera de la Reina.
Talavera de la Reina Vacation Rental Guest Capacity Trends (2025)
Distribution of Listings by Guest Capacity
Guest Capacity Insights for Talavera de la Reina
- The most common guest capacity trend in Talavera de la Reina vacation rentals is listings accommodating 2 guests (23%). This suggests the primary traveler segment is likely couples or solo travelers.
- Properties designed for 2 guests and 4 guests dominate the Talavera de la Reina STR market, accounting for 41.0% of listings.
- 26.3% of properties accommodate 6+ guests, serving the market segment for larger families or group travel in Talavera de la Reina.
- On average, properties in Talavera de la Reina are equipped to host 3.9 guests.
Talavera de la Reina Airbnb Booking Patterns (2025): Available vs. Booked Days
Available Days Distribution
Booked Days Distribution
Booking Pattern Insights for Talavera de la Reina
- The most common availability pattern in Talavera de la Reina falls within the 181-270 days range, representing 42.6% of listings. This suggests many properties have significant open periods on their calendars.
- Approximately 78.7% of listings show high availability (181+ days open annually), indicating potential for increased bookings or specific owner usage patterns.
- For booked days, the 91-180 days range is most frequent in Talavera de la Reina (44.3%), reflecting common guest stay durations or potential owner blocking patterns.
- A notable 21.3% of properties secure long booking periods (181+ days booked per year), highlighting successful long-term rental strategies or significant owner usage.
Talavera de la Reina Airbnb Minimum Stay Requirements Analysis
Distribution of Listings by Minimum Night Requirement
1 Night
36 listings
61% of total
2 Nights
14 listings
23.7% of total
3 Nights
1 listings
1.7% of total
4-6 Nights
2 listings
3.4% of total
7-29 Nights
2 listings
3.4% of total
30+ Nights
4 listings
6.8% of total
Key Insights
- The most prevalent minimum stay requirement in Talavera de la Reina is 1 Night, adopted by 61% of listings. This highlights the market's preference for shorter, flexible bookings.
- A strong majority (84.7%) of the Talavera de la Reina Airbnb data shows acceptance of very short stays (1-2 nights), indicating a dynamic, high-turnover market.
Recommendations
- Align with the market by considering a 1 Night minimum stay, as 61% of Talavera de la Reina hosts use this setting.
- Explore offering discounts for stays of 30+ nights to attract the 6.8% of the market seeking extended stays.
- Adjust minimum nights based on seasonality – potentially shorter during low season and longer during peak demand periods in Talavera de la Reina.
Talavera de la Reina Airbnb Cancellation Policy Trends Analysis (2025)
Flexible
12 listings
23.5% of total
Moderate
19 listings
37.3% of total
Firm
12 listings
23.5% of total
Strict
8 listings
15.7% of total
Cancellation Policy Insights for Talavera de la Reina
- The prevailing Airbnb cancellation policy trend in Talavera de la Reina is Moderate, used by 37.3% of listings.
- There's a relatively balanced mix between guest-friendly (60.8%) and stricter (39.2%) policies, offering choices for different guest needs.
Recommendations for Hosts
- Consider adopting a Moderate policy to align with the 37.3% market standard in Talavera de la Reina.
- Regularly review your cancellation policy against competitors and market demand shifts in Talavera de la Reina.
Talavera de la Reina STR Booking Lead Time Analysis (2025)
Average Booking Lead Time by Month
Booking Lead Time Insights for Talavera de la Reina
- The overall average booking lead time for vacation rentals in Talavera de la Reina is 39 days.
- Guests book furthest in advance for stays during May (average 71 days), likely coinciding with peak travel demand or local events.
- The shortest booking windows occur for stays in February (average 20 days), indicating more last-minute travel plans during this time.
- Seasonally, Summer (56 days avg.) sees the longest lead times, while Winter (34 days avg.) has the shortest, reflecting typical travel planning cycles.
Recommendations for Hosts
- Use the overall average lead time (39 days) as a baseline for your pricing and availability strategy in Talavera de la Reina.
- For May stays, consider implementing length-of-stay discounts or slightly higher rates for bookings made less than 71 days out to capitalize on advance planning.
- Target marketing efforts for the Summer season well in advance (at least 56 days) to capture early planners.
- Monitor your own booking lead times against these Talavera de la Reina averages to identify opportunities for dynamic pricing adjustments.
Popular & Essential Airbnb Amenities in Talavera de la Reina (2025)
Amenity Prevalence
Amenity Insights for Talavera de la Reina
- Essential amenities in Talavera de la Reina that guests expect include: TV. Lacking these (this) could significantly impact bookings.
- Popular amenities like Heating, Hot water, Wifi are common but not universal. Offering these can provide a competitive edge.
- Warning: Wifi is not universally provided but is considered essential globally. Ensure reliable Wifi is offered.
Recommendations for Hosts
- Ensure your listing includes all essential amenities for Talavera de la Reina: TV.
- Prioritize adding missing essentials: TV.
- Consider adding popular differentiators like Heating or Hot water to increase appeal.
- Highlight unique or less common amenities you offer (e.g., hot tub, dedicated workspace, EV charger) in your listing description and photos.
- Regularly check competitor amenities in Talavera de la Reina to stay competitive.
Talavera de la Reina Airbnb Guest Demographics & Profile Analysis (2025)
Guest Profile Summary for Talavera de la Reina
- The typical guest profile for Airbnb in Talavera de la Reina consists of primarily domestic travelers (73%), often arriving from nearby Madrid, typically belonging to the Post-2000s (Gen Z/Alpha) group (50%), primarily speaking Spanish or English.
- Domestic travelers account for 73.4% of guests.
- Key international markets include Spain (73.4%) and United States (4.2%).
- Top languages spoken are Spanish (41.5%) followed by English (31.7%).
- A significant demographic segment is the Post-2000s (Gen Z/Alpha) group, representing 50% of guests.
Recommendations for Hosts
- Target domestic marketing efforts towards travelers from Madrid and Talavera de la Reina.
- Tailor amenities and listing descriptions to appeal to the dominant Post-2000s (Gen Z/Alpha) demographic (e.g., highlight fast WiFi, smart home features, local guides).
- Highlight unique local experiences or amenities relevant to the primary guest profile.
- Consider seasonal promotions aligned with peak travel times for key origin markets.
Nearby Short-Term Rental Market Comparison
How does the Talavera de la Reina Airbnb market stack up against its neighbors? Compare key performance metrics like average monthly revenue, ADR, and occupancy rates in surrounding areas to understand the broader regional STR landscape.
| Market | Active Properties | Monthly Revenue | Daily Rate | Avg. Occupancy |
|---|---|---|---|---|
| Argés | 22 | $3,255 | $255.60 | 39% |
| Ortigosa del Monte | 11 | $3,075 | $292.25 | 38% |
| El Espinar | 33 | $3,000 | $308.36 | 39% |
| Nuevo Baztán | 13 | $2,976 | $282.31 | 38% |
| Cebreros | 11 | $2,968 | $264.97 | 31% |
| Robledo de Chavela | 26 | $2,968 | $255.14 | 35% |
| Valdemorillo | 27 | $2,959 | $302.94 | 42% |
| Venturada | 11 | $2,935 | $307.18 | 33% |
| Guadamur | 25 | $2,706 | $232.56 | 34% |
| Burguillos de Toledo | 13 | $2,595 | $185.50 | 43% |