Villablino Airbnb Market Analysis 2025: Short Term Rental Data & Vacation Rental Statistics in Castile and León, Spain
Is Airbnb profitable in Villablino in 2025? Explore comprehensive Airbnb analytics for Villablino, Castile and León, Spain to uncover income potential. This 2025 STR market report for Villablino, based on AirROI data from April 2024 to March 2025, reveals key trends in the niche market of 22 active listings.
Whether you're considering an Airbnb investment in Villablino, optimizing your existing vacation rental, or exploring rental arbitrage opportunities, understanding the Villablino Airbnb data is crucial. Navigating the high regulation landscape is key to maximizing your short term rental income potential. Let's dive into the specifics.
Key Villablino Airbnb Performance Metrics Overview
Monthly Airbnb Revenue Variations & Income Potential in Villablino (2025)
Understanding the monthly revenue variations for Airbnb listings in Villablino is key to maximizing your short term rental income potential. Seasonality significantly impacts earnings. Our analysis, based on data from the past 12 months, shows that the peak revenue month for STRs in Villablino is typically August, while November often presents the lowest earnings, highlighting opportunities for strategic pricing adjustments during shoulder and low seasons. Explore the typical Airbnb income in Villablino across different performance tiers:
- Best-in-class properties (Top 10%) achieve $2,080+ monthly, often utilizing dynamic pricing and superior guest experiences.
- Strong performing properties (Top 25%) earn $1,285 or more, indicating effective management and desirable locations/amenities.
- Typical properties (Median) generate around $672 per month, representing the average market performance.
- Entry-level properties (Bottom 25%) see earnings around $299, often with potential for optimization.
Average Monthly Airbnb Earnings Trend in Villablino
Villablino Airbnb Occupancy Rate Trends (2025)
Maximize your bookings by understanding the Villablino STR occupancy trends. Seasonal demand shifts significantly influence how often properties are booked. Typically, Augustsees the highest demand (peak season occupancy), while April experiences the lowest (low season). Effective strategies, like adjusting minimum stays or offering promotions, can boost occupancy during slower periods. Here's how different property tiers perform in Villablino:
- Best-in-class properties (Top 10%) achieve 50%+ occupancy, indicating high desirability and potentially optimized availability.
- Strong performing properties (Top 25%) maintain 38% or higher occupancy, suggesting good market fit and guest satisfaction.
- Typical properties (Median) have an occupancy rate around 22%.
- Entry-level properties (Bottom 25%) average 8% occupancy, potentially facing higher vacancy.
Average Monthly Occupancy Rate Trend in Villablino
Average Daily Rate (ADR) Airbnb Trends in Villablino (2025)
Effective short term rental pricing strategy in Villablino involves understanding monthly ADR fluctuations. The Average Daily Rate (ADR) for Airbnb in Villablino typically peaks in December and dips lowest during September. Leveraging Airbnb dynamic pricing tools or strategies based on this seasonality can significantly boost revenue. Here's a look at the typical nightly rates achieved:
- Best-in-class properties (Top 10%) command rates of $195+ per night, often due to premium features or locations.
- Strong performing properties (Top 25%) achieve nightly rates of $145 or more.
- Typical properties (Median) charge around $106 per night.
- Entry-level properties (Bottom 25%) earn around $86 per night.
Average Daily Rate (ADR) Trend by Month in Villablino
Get Live Villablino Market Intelligence 👇

Explore Real-time Analytics
Airbnb Seasonality Analysis & Trends in Villablino (2025)
Peak Season (August, July, May)
- Revenue averages $1,511 per month
- Occupancy rates average 43.4%
- Daily rates average $114
Shoulder Season
- Revenue averages $856 per month
- Occupancy maintains around 22.0%
- Daily rates hold near $120
Low Season (March, October, November)
- Revenue drops to average $559 per month
- Occupancy decreases to average 15.1%
- Daily rates adjust to average $117
Seasonality Insights for Villablino
- The Airbnb seasonality in Villablino shows highly seasonal trends requiring careful strategy. While the sections above show seasonal averages, it's also insightful to look at the extremes:
- During the high season, the absolute peak month showcases Villablino's highest earning potential, with monthly revenues capable of climbing to $1,750, occupancy reaching a high of 49.7%, and ADRs peaking at $132.
- Conversely, the slowest single month of the year, typically falling within the low season, marks the market's lowest point. In this month, revenue might dip to $537, occupancy could drop to 13.3%, and ADRs may adjust down to $109.
- Understanding both the seasonal averages and these monthly peaks and troughs in revenue, occupancy, and ADR is crucial for maximizing your Airbnb profit potential in Villablino.
Seasonal Strategies for Maximizing Profit
- Peak Season: Maximize revenue through premium pricing and potentially longer minimum stays. Ensure high availability.
- Low Season: Offer competitive pricing, special promotions (e.g., extended stay discounts), and flexible cancellation policies. Target off-season travelers like remote workers or budget-conscious guests.
- Shoulder Seasons: Implement dynamic pricing that balances peak and low rates. Target weekend travelers or specific events. Offer slightly more flexible terms than peak season.
- Regularly analyze your own performance against these Villablino seasonality benchmarks and adjust your pricing and availability strategy accordingly.
Best Areas for Airbnb Investment in Villablino (2025)
Exploring the top neighborhoods for short-term rentals in Villablino? This section highlights key areas, outlining why they are attractive for hosts and guests, along with notable local attractions. Consider these locations based on your target guest profile and investment strategy.
| Neighborhood / Area | Why Host Here? (Target Guests & Appeal) | Key Attractions & Landmarks |
|---|---|---|
| Caboalles de Abajo | A charming village close to Villablino, known for its natural beauty and access to hiking trails. Ideal for travelers looking for a peaceful retreat in nature. | Caboalles de Abajo Nature Trails, Local parks, Rural tourism activities |
| Villafranca del Bierzo | A picturesque town nearby with a rich history and beautiful vineyards. Great for those who appreciate wine tourism and cultural sites. | Castillo de Villafranca, Wine tours, Bierzo vineyards, Historical architecture |
| León | The capital city of the province, known for its stunning cathedral and cultural attractions. Perfect for urban travelers and history enthusiasts. | León Cathedral, Basilica de San Isidoro, Historic Quarter, Museum of Contemporary Art |
| Ponferrada | A larger town with a vibrant atmosphere and historical significance, great for tourists exploring the region's heritage. | Templar Castle, Bierzo Museum, Basilica de la Encina, Local festivals |
| Los Ancares | A natural park area ideal for those seeking outdoor adventures such as hiking and wildlife watching. Attracts eco-tourists and athletes. | Los Ancares Natural Park, Hiking routes, Traditional villages, Adventure sports |
| Piedrafita de Babia | A small village positioned in the Babia region, known for its stunning landscapes and tranquility. Attractive to nature lovers. | Babia Valley, Nature trails, Traditional cuisine |
| Torre del Bierzo | A quiet mountain village that offers breathtaking views and a relaxed atmosphere, attracting those looking to unwind. | Scenic landscapes, Hiking paths, Local historical sites |
| Cistierna | A historic town with various local attractions and a rich mining history. Suitable for cultural tourism and local exploration. | Mining Museum, Natural Park Mampodre, Historic architecture, Cultural festivals |
Understanding Airbnb License Requirements & STR Laws in Villablino (2025)
Yes, Villablino, Castile and León, Spain enforces high STR regulations. Obtaining a license and ensuring compliance is almost certainly required according to current 2025 STR laws. Always verify the latest short term rental regulations and Airbnb license requirements directly with local government authorities for Villablino to ensure full compliance before hosting.
(Source: AirROI data, 2025, based on 36% licensed listings)
Top Performing Airbnb Properties in Villablino (2025)
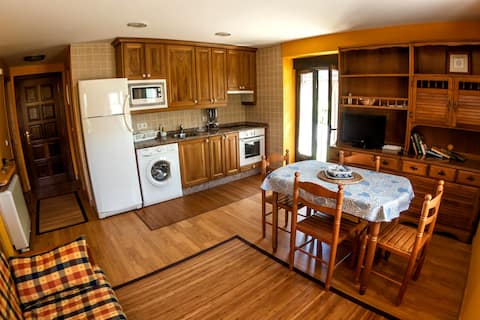
Benchmark your potential! Explore examples of top-performing Airbnb properties in Villablinobased on Trailing Twelve Month (TTM) revenue. Analyze their characteristics, revenue, occupancy rate, and ADR to understand what drives success in this market.

El Parreiro VUT-LE-610 Dúplex www furmumecha com
Entire Place • 1 bedroom

Apartamentos L'Abiseu- Balagar
Entire Place • 2 bedrooms

Apartamentos L´Abiseu- La Alcoba
Entire Place • 1 bedroom
Accommodation Valley of Laciana Sur
Entire Place • 2 bedrooms
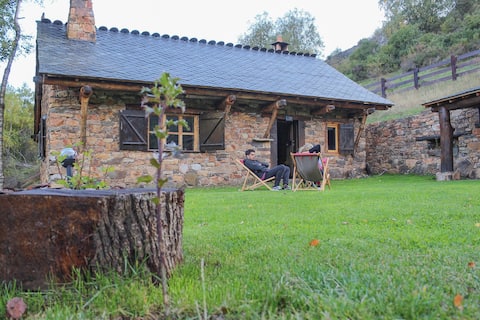
LA CABAÑA DE LACIANA
Entire Place • N/A

La Furmumecha VUTLE611 Apartamento furmumecha com
Entire Place • 1 bedroom
Note: Performance varies based on location, size, amenities, seasonality, and management quality. Data reflects the past 12 months.
Top Performing Airbnb Hosts in Villablino (2025)
Learn from the best! This table showcases top-performing Airbnb hosts in Villablino based on the number of properties managed and estimated total revenue over the past year. Analyze their scale and performance metrics.
| Host Name | Properties | Grossing Revenue | Stay Reviews | Avg Rating |
|---|---|---|---|---|
| Jose | 3 | $37,976 | 42 | 4.94/5.0 |
| Carlos | 2 | $31,588 | 150 | 4.89/5.0 |
| David | 2 | $19,970 | 79 | 4.91/5.0 |
| Ana María | 1 | $10,837 | 41 | 4.93/5.0 |
| Luisa | 1 | $10,230 | 48 | 4.94/5.0 |
| Elizabeth | 1 | $9,190 | 6 | 4.67/5.0 |
| Marta | 1 | $8,900 | 55 | 4.64/5.0 |
| Begoña | 1 | $7,454 | 21 | 4.86/5.0 |
| Carlos | 1 | $6,873 | 3 | 5.00/5.0 |
| Roberto | 1 | $5,096 | 40 | 4.93/5.0 |
Analyzing the strategies of top hosts, such as their property selection, pricing, and guest communication, can offer valuable lessons for optimizing your own Airbnb operations in Villablino.
Dive Deeper: Advanced Villablino STR Market Data (2025)
Ready to unlock more insights? AirROI provides access to advanced metrics and comprehensive Airbnb data for Villablino. Explore detailed analytics beyond this report to refine your investment strategy, optimize pricing, and maximize your vacation rental profits.
Explore Advanced MetricsVillablino Short-Term Rental Market Composition (2025): Property & Room Types
Room Type Distribution
Property Type Distribution
Market Composition Insights for Villablino
- The Villablino Airbnb market composition is heavily skewed towards Entire Home/Apt listings, which make up 100% of the 22 active rentals. This indicates strong guest preference for privacy and space.
- Looking at the property type distribution in Villablino, House properties are the most common (63.6%), reflecting the local real estate landscape.
- Houses represent a significant 63.6% portion, catering likely to families or larger groups.
- Smaller segments like outdoor/unique, hotel/boutique (combined 9.0%) offer potential for unique stay experiences.
Villablino Airbnb Room Capacity Analysis (2025): Bedroom Distribution
Distribution of Listings by Number of Bedrooms
Room Capacity Insights for Villablino
- The dominant room capacity in Villablino is 2 bedrooms listings, making up 40.9% of the market. This suggests a strong demand for properties suitable for couples or solo travelers.
- Together, 2 bedrooms and 3 bedrooms properties represent 72.7% of the active Airbnb listings in Villablino, indicating a high concentration in these sizes.
- A significant 36.3% of listings offer 3+ bedrooms, catering to larger groups and families seeking more space in Villablino.
Villablino Vacation Rental Guest Capacity Trends (2025)
Distribution of Listings by Guest Capacity
Guest Capacity Insights for Villablino
- The most common guest capacity trend in Villablino vacation rentals is listings accommodating 4 guests (36.4%). This suggests the primary traveler segment is likely small families or groups.
- Properties designed for 4 guests and 6 guests dominate the Villablino STR market, accounting for 54.6% of listings.
- 31.8% of properties accommodate 6+ guests, serving the market segment for larger families or group travel in Villablino.
- On average, properties in Villablino are equipped to host 4.9 guests.
Villablino Airbnb Booking Patterns (2025): Available vs. Booked Days
Available Days Distribution
Booked Days Distribution
Booking Pattern Insights for Villablino
- The most common availability pattern in Villablino falls within the 271-366 days range, representing 68.2% of listings. This suggests many properties have significant open periods on their calendars.
- Approximately 100.0% of listings show high availability (181+ days open annually), indicating potential for increased bookings or specific owner usage patterns.
- For booked days, the 31-90 days range is most frequent in Villablino (36.4%), reflecting common guest stay durations or potential owner blocking patterns.
Villablino Airbnb Minimum Stay Requirements Analysis
Distribution of Listings by Minimum Night Requirement
1 Night
1 listings
4.5% of total
2 Nights
18 listings
81.8% of total
4-6 Nights
1 listings
4.5% of total
30+ Nights
2 listings
9.1% of total
Key Insights
- The most prevalent minimum stay requirement in Villablino is 2 Nights, adopted by 81.8% of listings. This highlights the market's preference for shorter, flexible bookings.
- A strong majority (86.3%) of the Villablino Airbnb data shows acceptance of very short stays (1-2 nights), indicating a dynamic, high-turnover market.
Recommendations
- Align with the market by considering a 2 Nights minimum stay, as 81.8% of Villablino hosts use this setting.
- If feasible, allowing 1-night stays, especially midweek or during low season, could capture last-minute bookings, as only 4.5% currently do.
- A 2-night minimum appears standard (81.8%). Consider this for weekends or peak periods.
- Explore offering discounts for stays of 30+ nights to attract the 9.1% of the market seeking extended stays.
- Adjust minimum nights based on seasonality – potentially shorter during low season and longer during peak demand periods in Villablino.
Villablino Airbnb Cancellation Policy Trends Analysis (2025)
Flexible
4 listings
20% of total
Moderate
8 listings
40% of total
Strict
8 listings
40% of total
Cancellation Policy Insights for Villablino
- The prevailing Airbnb cancellation policy trend in Villablino is Moderate, used by 40% of listings.
- There's a relatively balanced mix between guest-friendly (60.0%) and stricter (40.0%) policies, offering choices for different guest needs.
Recommendations for Hosts
- Consider adopting a Moderate policy to align with the 40% market standard in Villablino.
- With 40% using Strict terms, this is a viable option in Villablino, particularly for high-value properties or during peak demand periods.
- Regularly review your cancellation policy against competitors and market demand shifts in Villablino.
Villablino STR Booking Lead Time Analysis (2025)
Average Booking Lead Time by Month
Booking Lead Time Insights for Villablino
- The overall average booking lead time for vacation rentals in Villablino is 34 days.
- Guests book furthest in advance for stays during May (average 82 days), likely coinciding with peak travel demand or local events.
- The shortest booking windows occur for stays in October (average 8 days), indicating more last-minute travel plans during this time.
- Seasonally, Summer (59 days avg.) sees the longest lead times, while Winter (23 days avg.) has the shortest, reflecting typical travel planning cycles.
Recommendations for Hosts
- Use the overall average lead time (34 days) as a baseline for your pricing and availability strategy in Villablino.
- For May stays, consider implementing length-of-stay discounts or slightly higher rates for bookings made less than 82 days out to capitalize on advance planning.
- During October, focus on last-minute booking availability and promotions, as guests book with very short notice (8 days avg.).
- Target marketing efforts for the Summer season well in advance (at least 59 days) to capture early planners.
- Monitor your own booking lead times against these Villablino averages to identify opportunities for dynamic pricing adjustments.
Popular & Essential Airbnb Amenities in Villablino (2025)
Amenity Prevalence
Amenity Insights for Villablino
- Essential amenities in Villablino that guests expect include: Kitchen, Essentials, Heating. Lacking these (any) could significantly impact bookings.
- Popular amenities like Dishes and silverware, Washer, TV are common but not universal. Offering these can provide a competitive edge.
Recommendations for Hosts
- Ensure your listing includes all essential amenities for Villablino: Kitchen, Essentials, Heating.
- Prioritize adding missing essentials: Essentials, Heating.
- Consider adding popular differentiators like Dishes and silverware or Washer to increase appeal.
- Highlight unique or less common amenities you offer (e.g., hot tub, dedicated workspace, EV charger) in your listing description and photos.
- Regularly check competitor amenities in Villablino to stay competitive.
Villablino Airbnb Guest Demographics & Profile Analysis (2025)
Guest Profile Summary for Villablino
- The typical guest profile for Airbnb in Villablino consists of primarily domestic travelers (76%), often arriving from nearby Madrid, typically belonging to the Post-2000s (Gen Z/Alpha) group (50%), primarily speaking Spanish or English.
- Domestic travelers account for 75.6% of guests.
- Key international markets include Spain (75.6%) and United Kingdom (7%).
- Top languages spoken are Spanish (39.6%) followed by English (31.9%).
- A significant demographic segment is the Post-2000s (Gen Z/Alpha) group, representing 50% of guests.
Recommendations for Hosts
- Target domestic marketing efforts towards travelers from Madrid and Barcelona.
- Tailor amenities and listing descriptions to appeal to the dominant Post-2000s (Gen Z/Alpha) demographic (e.g., highlight fast WiFi, smart home features, local guides).
- Highlight unique local experiences or amenities relevant to the primary guest profile.
- Consider seasonal promotions aligned with peak travel times for key origin markets.
Nearby Short-Term Rental Market Comparison
How does the Villablino Airbnb market stack up against its neighbors? Compare key performance metrics like average monthly revenue, ADR, and occupancy rates in surrounding areas to understand the broader regional STR landscape.
| Market | Active Properties | Monthly Revenue | Daily Rate | Avg. Occupancy |
|---|---|---|---|---|
| Armamar | 59 | $2,357 | $253.66 | 38% |
| Alijó | 64 | $2,217 | $264.67 | 32% |
| Mesão Frio | 53 | $1,907 | $195.39 | 46% |
| Anreade e São Romão de Arego | 14 | $1,836 | $184.41 | 39% |
| Tabuaço | 26 | $1,786 | $186.15 | 37% |
| A Fonsagrada | 16 | $1,773 | $154.02 | 42% |
| Sabrosa | 50 | $1,575 | $209.61 | 34% |
| Barrô | 10 | $1,559 | $159.59 | 37% |
| Portomarín | 13 | $1,545 | $152.80 | 50% |
| Peso da Régua | 117 | $1,522 | $188.88 | 33% |