Cacabelos Airbnb Market Analysis 2025: Short Term Rental Data & Vacation Rental Statistics in Castile and León, Spain
Is Airbnb profitable in Cacabelos in 2025? Explore comprehensive Airbnb analytics for Cacabelos, Castile and León, Spain to uncover income potential. This 2025 STR market report for Cacabelos, based on AirROI data from April 2024 to March 2025, reveals key trends in the niche market of 18 active listings.
Whether you're considering an Airbnb investment in Cacabelos, optimizing your existing vacation rental, or exploring rental arbitrage opportunities, understanding the Cacabelos Airbnb data is crucial. Leveraging the low regulation environment is key to maximizing your short term rental income potential. Let's dive into the specifics.
Key Cacabelos Airbnb Performance Metrics Overview
Monthly Airbnb Revenue Variations & Income Potential in Cacabelos (2025)
Understanding the monthly revenue variations for Airbnb listings in Cacabelos is key to maximizing your short term rental income potential. Seasonality significantly impacts earnings. Our analysis, based on data from the past 12 months, shows that the peak revenue month for STRs in Cacabelos is typically April, while September often presents the lowest earnings, highlighting opportunities for strategic pricing adjustments during shoulder and low seasons. Explore the typical Airbnb income in Cacabelos across different performance tiers:
- Best-in-class properties (Top 10%) achieve $3,929+ monthly, often utilizing dynamic pricing and superior guest experiences.
- Strong performing properties (Top 25%) earn $1,347 or more, indicating effective management and desirable locations/amenities.
- Typical properties (Median) generate around $558 per month, representing the average market performance.
- Entry-level properties (Bottom 25%) see earnings around $215, often with potential for optimization.
Average Monthly Airbnb Earnings Trend in Cacabelos
Cacabelos Airbnb Occupancy Rate Trends (2025)
Maximize your bookings by understanding the Cacabelos STR occupancy trends. Seasonal demand shifts significantly influence how often properties are booked. Typically, Augustsees the highest demand (peak season occupancy), while February experiences the lowest (low season). Effective strategies, like adjusting minimum stays or offering promotions, can boost occupancy during slower periods. Here's how different property tiers perform in Cacabelos:
- Best-in-class properties (Top 10%) achieve 53%+ occupancy, indicating high desirability and potentially optimized availability.
- Strong performing properties (Top 25%) maintain 32% or higher occupancy, suggesting good market fit and guest satisfaction.
- Typical properties (Median) have an occupancy rate around 16%.
- Entry-level properties (Bottom 25%) average 8% occupancy, potentially facing higher vacancy.
Average Monthly Occupancy Rate Trend in Cacabelos
Average Daily Rate (ADR) Airbnb Trends in Cacabelos (2025)
Effective short term rental pricing strategy in Cacabelos involves understanding monthly ADR fluctuations. The Average Daily Rate (ADR) for Airbnb in Cacabelos typically peaks in November and dips lowest during April. Leveraging Airbnb dynamic pricing tools or strategies based on this seasonality can significantly boost revenue. Here's a look at the typical nightly rates achieved:
- Best-in-class properties (Top 10%) command rates of $205+ per night, often due to premium features or locations.
- Strong performing properties (Top 25%) achieve nightly rates of $150 or more.
- Typical properties (Median) charge around $76 per night.
- Entry-level properties (Bottom 25%) earn around $55 per night.
Average Daily Rate (ADR) Trend by Month in Cacabelos
Get Live Cacabelos Market Intelligence 👇

Explore Real-time Analytics
Airbnb Seasonality Analysis & Trends in Cacabelos (2025)
Peak Season (April, May, January)
- Revenue averages $2,057 per month
- Occupancy rates average 28.2%
- Daily rates average $103
Shoulder Season
- Revenue averages $963 per month
- Occupancy maintains around 23.3%
- Daily rates hold near $106
Low Season (March, September, October)
- Revenue drops to average $581 per month
- Occupancy decreases to average 19.3%
- Daily rates adjust to average $101
Seasonality Insights for Cacabelos
- The Airbnb seasonality in Cacabelos shows highly seasonal trends requiring careful strategy. While the sections above show seasonal averages, it's also insightful to look at the extremes:
- During the high season, the absolute peak month showcases Cacabelos's highest earning potential, with monthly revenues capable of climbing to $2,643, occupancy reaching a high of 38.6%, and ADRs peaking at $117.
- Conversely, the slowest single month of the year, typically falling within the low season, marks the market's lowest point. In this month, revenue might dip to $431, occupancy could drop to 16.1%, and ADRs may adjust down to $99.
- Understanding both the seasonal averages and these monthly peaks and troughs in revenue, occupancy, and ADR is crucial for maximizing your Airbnb profit potential in Cacabelos.
Seasonal Strategies for Maximizing Profit
- Peak Season: Maximize revenue through premium pricing and potentially longer minimum stays. Ensure high availability.
- Low Season: Offer competitive pricing, special promotions (e.g., extended stay discounts), and flexible cancellation policies. Target off-season travelers like remote workers or budget-conscious guests.
- Shoulder Seasons: Implement dynamic pricing that balances peak and low rates. Target weekend travelers or specific events. Offer slightly more flexible terms than peak season.
- Regularly analyze your own performance against these Cacabelos seasonality benchmarks and adjust your pricing and availability strategy accordingly.
Best Areas for Airbnb Investment in Cacabelos (2025)
Exploring the top neighborhoods for short-term rentals in Cacabelos? This section highlights key areas, outlining why they are attractive for hosts and guests, along with notable local attractions. Consider these locations based on your target guest profile and investment strategy.
| Neighborhood / Area | Why Host Here? (Target Guests & Appeal) | Key Attractions & Landmarks |
|---|---|---|
| Cacabelos Town Center | The heart of Cacabelos, offering easy access to local shops, restaurants, and attractions. A great place for visitors wanting to explore the local culture and cuisine. | Cacabelos Archaeological Museum, Local tapas bars, Plaza de la Constitución, Wine tasting in local bodegas |
| Bierzo Valley | Known for its stunning natural beauty and vineyards, the Bierzo Valley attracts nature lovers and wine enthusiasts. Ideal for guests looking for rural experiences and outdoor activities. | Las Médulas, Vega de Valcarce, Bierzo Cuisine, Hiking trails, Wine tours in local vineyards |
| Monastery of Carracedo | A historical site that draws visitors interested in history and architecture. Perfect for travelers who enjoy cultural and historical experiences. | Monastery of Carracedo, Guided tours, Cultural heritage sites |
| Camino de Santiago Route | Cacabelos is a stop along the famous Camino de Santiago pilgrimage route, attracting many pilgrims and tourists eager to experience this historic journey. | Pilgrim's path, Local albergues, Church of Santiago |
| Cacabelos Wine Region | Renowned for its rich wine production, particularly Mencía wine. Ideal for wine tourism and attracting oenophiles looking to experience local vineyards. | Wine cellars, Wine tasting events, Vineyard tours |
| Natural Parks | Close to various natural parks, providing opportunities for outdoor activities like hiking, biking, and bird watching. Appeals to nature enthusiasts. | Cabo de Peñas Natural Park, Protected natural areas, Biodiversity hotspots |
| Cacabelos Nightlife | Vibrant nightlife with bars and local events, attracting young tourists and locals looking for evening entertainment and socializing. | Local bars, Music events, Cultural festivals |
| Religious Tourism Sites | Presence of various religious sites that attract pilgrims and tourists interested in spirituality and history. | Church of San Juan Bautista, Cultural tours of religious sites |
Understanding Airbnb License Requirements & STR Laws in Cacabelos (2025)
While Cacabelos, Castile and León, Spain currently shows low STR regulations, specific Airbnb license requirements might still exist or change. Always verify the latest short term rental regulations and Airbnb license requirements directly with local government authorities for Cacabelos to ensure full compliance before hosting.
(Source: AirROI data, 2025, finding no licensed listings among those analyzed)
Top Performing Airbnb Properties in Cacabelos (2025)
Benchmark your potential! Explore examples of top-performing Airbnb properties in Cacabelosbased on Trailing Twelve Month (TTM) revenue. Analyze their characteristics, revenue, occupancy rate, and ADR to understand what drives success in this market.
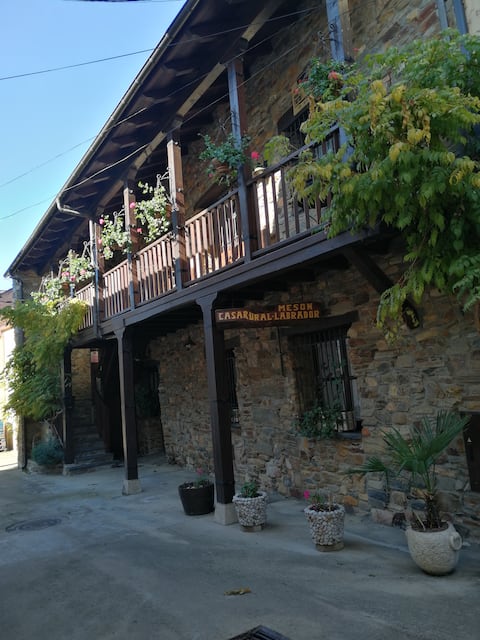
Acojedora casa rural en Cacabelos (Quilós)
Entire Place • 5 bedrooms
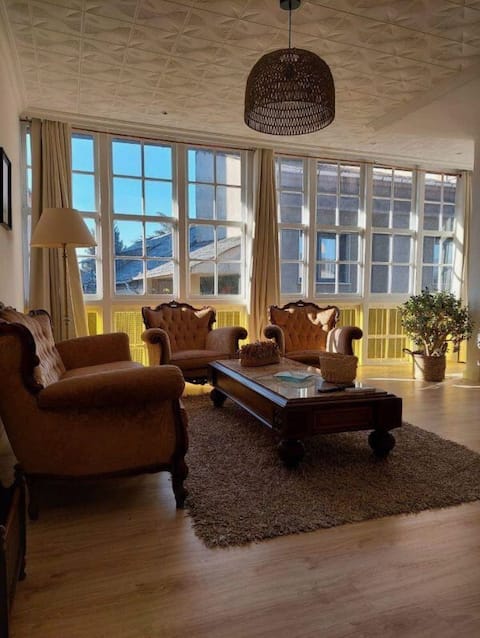
The VUT-LE-703 Gallery
Entire Place • 3 bedrooms
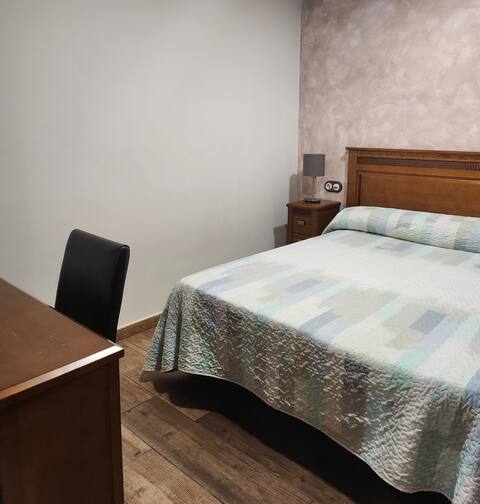
Room Double Earth, 2 Beds
Private Room • 1 bedroom
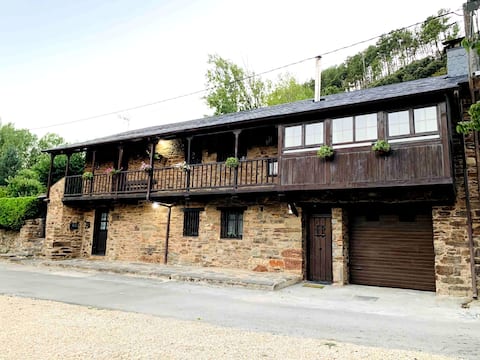
Casa Pico Vila, El Bierzo. Camino de Santiago
Entire Place • 3 bedrooms
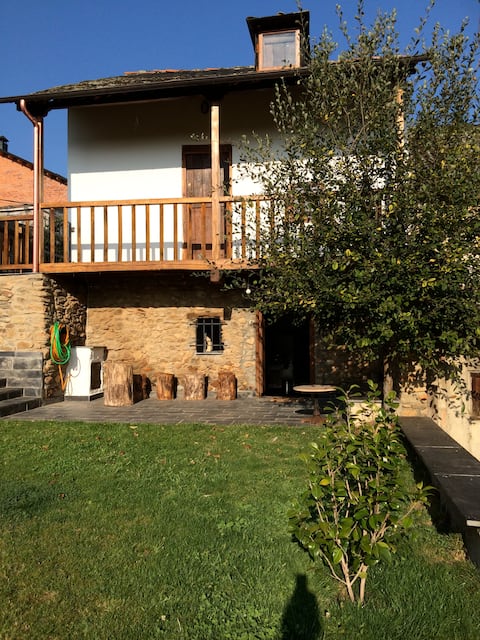
Rustic design house with garden
Entire Place • 2 bedrooms

Studio The VUT-LE-703 Gallery
Entire Place • 1 bedroom
Note: Performance varies based on location, size, amenities, seasonality, and management quality. Data reflects the past 12 months.
Top Performing Airbnb Hosts in Cacabelos (2025)
Learn from the best! This table showcases top-performing Airbnb hosts in Cacabelos based on the number of properties managed and estimated total revenue over the past year. Analyze their scale and performance metrics.
| Host Name | Properties | Grossing Revenue | Stay Reviews | Avg Rating |
|---|---|---|---|---|
| Bierzo Suite | 3 | $42,896 | 29 | 4.85/5.0 |
| Francisca | 1 | $38,417 | 4 | 5.00/5.0 |
| Javi | 3 | $9,887 | 26 | 3.07/5.0 |
| Host #468122742 | 5 | $8,034 | 1 | 0.00/5.0 |
| Javier | 1 | $7,504 | 111 | 4.72/5.0 |
| Christine | 1 | $5,998 | 26 | 4.81/5.0 |
| Host #21479342 | 1 | $5,188 | 2 | 0.00/5.0 |
| Host #97867364 | 1 | $4,512 | 6 | 5.00/5.0 |
| Héctor | 1 | $3,845 | 22 | 4.95/5.0 |
| Silvia | 1 | $2,926 | 37 | 5.00/5.0 |
Analyzing the strategies of top hosts, such as their property selection, pricing, and guest communication, can offer valuable lessons for optimizing your own Airbnb operations in Cacabelos.
Dive Deeper: Advanced Cacabelos STR Market Data (2025)
Ready to unlock more insights? AirROI provides access to advanced metrics and comprehensive Airbnb data for Cacabelos. Explore detailed analytics beyond this report to refine your investment strategy, optimize pricing, and maximize your vacation rental profits.
Explore Advanced MetricsCacabelos Short-Term Rental Market Composition (2025): Property & Room Types
Room Type Distribution
Property Type Distribution
Market Composition Insights for Cacabelos
- The Cacabelos Airbnb market composition is heavily skewed towards Entire Home/Apt listings, which make up 77.8% of the 18 active rentals. This indicates strong guest preference for privacy and space.
- Looking at the property type distribution in Cacabelos, House properties are the most common (44.4%), reflecting the local real estate landscape.
- Houses represent a significant 44.4% portion, catering likely to families or larger groups.
- The presence of 16.7% Hotel/Boutique listings indicates integration with traditional hospitality.
Cacabelos Airbnb Room Capacity Analysis (2025): Bedroom Distribution
Distribution of Listings by Number of Bedrooms
Room Capacity Insights for Cacabelos
- The dominant room capacity in Cacabelos is 1 bedroom listings, making up 50% of the market. This suggests a strong demand for properties suitable for couples or solo travelers.
- Together, 1 bedroom and 2 bedrooms properties represent 72.2% of the active Airbnb listings in Cacabelos, indicating a high concentration in these sizes.
- A significant 27.8% of listings offer 3+ bedrooms, catering to larger groups and families seeking more space in Cacabelos.
Cacabelos Vacation Rental Guest Capacity Trends (2025)
Distribution of Listings by Guest Capacity
Guest Capacity Insights for Cacabelos
- The most common guest capacity trend in Cacabelos vacation rentals is listings accommodating 2 guests (33.3%). This suggests the primary traveler segment is likely couples or solo travelers.
- Properties designed for 2 guests and 4 guests dominate the Cacabelos STR market, accounting for 61.1% of listings.
- 27.8% of properties accommodate 6+ guests, serving the market segment for larger families or group travel in Cacabelos.
- On average, properties in Cacabelos are equipped to host 4.3 guests.
Cacabelos Airbnb Booking Patterns (2025): Available vs. Booked Days
Available Days Distribution
Booked Days Distribution
Booking Pattern Insights for Cacabelos
- The most common availability pattern in Cacabelos falls within the 271-366 days range, representing 72.2% of listings. This suggests many properties have significant open periods on their calendars.
- Approximately 94.4% of listings show high availability (181+ days open annually), indicating potential for increased bookings or specific owner usage patterns.
- For booked days, the 1-30 days range is most frequent in Cacabelos (38.9%), reflecting common guest stay durations or potential owner blocking patterns.
- A notable 5.6% of properties secure long booking periods (181+ days booked per year), highlighting successful long-term rental strategies or significant owner usage.
Cacabelos Airbnb Minimum Stay Requirements Analysis
Distribution of Listings by Minimum Night Requirement
1 Night
5 listings
29.4% of total
2 Nights
9 listings
52.9% of total
4-6 Nights
1 listings
5.9% of total
7-29 Nights
2 listings
11.8% of total
Key Insights
- The most prevalent minimum stay requirement in Cacabelos is 2 Nights, adopted by 52.9% of listings. This highlights the market's preference for shorter, flexible bookings.
- A strong majority (82.3%) of the Cacabelos Airbnb data shows acceptance of very short stays (1-2 nights), indicating a dynamic, high-turnover market.
Recommendations
- Align with the market by considering a 2 Nights minimum stay, as 52.9% of Cacabelos hosts use this setting.
- If feasible, allowing 1-night stays, especially midweek or during low season, could capture last-minute bookings, as only 29.4% currently do.
- Adjust minimum nights based on seasonality – potentially shorter during low season and longer during peak demand periods in Cacabelos.
Cacabelos Airbnb Cancellation Policy Trends Analysis (2025)
Flexible
4 listings
40% of total
Moderate
4 listings
40% of total
Firm
2 listings
20% of total
Cancellation Policy Insights for Cacabelos
- The prevailing Airbnb cancellation policy trend in Cacabelos is Flexible, used by 40% of listings.
- The market strongly favors guest-friendly terms, with 80.0% of listings offering Flexible or Moderate policies. This suggests guests in Cacabelos may expect booking flexibility.
Recommendations for Hosts
- Consider adopting a Flexible policy to align with the 40% market standard in Cacabelos.
- Regularly review your cancellation policy against competitors and market demand shifts in Cacabelos.
Cacabelos STR Booking Lead Time Analysis (2025)
Average Booking Lead Time by Month
Booking Lead Time Insights for Cacabelos
- The overall average booking lead time for vacation rentals in Cacabelos is 32 days.
- Guests book furthest in advance for stays during June (average 74 days), likely coinciding with peak travel demand or local events.
- The shortest booking windows occur for stays in December (average 4 days), indicating more last-minute travel plans during this time.
- Seasonally, Summer (63 days avg.) sees the longest lead times, while Winter (19 days avg.) has the shortest, reflecting typical travel planning cycles.
Recommendations for Hosts
- Use the overall average lead time (32 days) as a baseline for your pricing and availability strategy in Cacabelos.
- For June stays, consider implementing length-of-stay discounts or slightly higher rates for bookings made less than 74 days out to capitalize on advance planning.
- During December, focus on last-minute booking availability and promotions, as guests book with very short notice (4 days avg.).
- Target marketing efforts for the Summer season well in advance (at least 63 days) to capture early planners.
- Monitor your own booking lead times against these Cacabelos averages to identify opportunities for dynamic pricing adjustments.
Popular & Essential Airbnb Amenities in Cacabelos (2025)
Amenity Prevalence
Amenity Insights for Cacabelos
- Popular amenities like TV, Hot water, Heating are common but not universal. Offering these can provide a competitive edge.
- Warning: Wifi is not universally provided but is considered essential globally. Ensure reliable Wifi is offered.
Recommendations for Hosts
- Consider adding popular differentiators like TV or Hot water to increase appeal.
- Highlight unique or less common amenities you offer (e.g., hot tub, dedicated workspace, EV charger) in your listing description and photos.
- Regularly check competitor amenities in Cacabelos to stay competitive.
Cacabelos Airbnb Guest Demographics & Profile Analysis (2025)
Guest Profile Summary for Cacabelos
- The typical guest profile for Airbnb in Cacabelos consists of primarily domestic travelers (76%), often arriving from nearby Madrid, typically belonging to the Post-2000s (Gen Z/Alpha) group (50%), primarily speaking English or Spanish.
- Domestic travelers account for 75.7% of guests.
- Key international markets include Spain (75.7%) and United Kingdom (8.1%).
- Top languages spoken are English (29.6%) followed by Spanish (27.8%).
- A significant demographic segment is the Post-2000s (Gen Z/Alpha) group, representing 50% of guests.
Recommendations for Hosts
- Target domestic marketing efforts towards travelers from Madrid and Sant Vicenç de Montalt.
- Tailor amenities and listing descriptions to appeal to the dominant Post-2000s (Gen Z/Alpha) demographic (e.g., highlight fast WiFi, smart home features, local guides).
- Highlight unique local experiences or amenities relevant to the primary guest profile.
- Consider seasonal promotions aligned with peak travel times for key origin markets.
Nearby Short-Term Rental Market Comparison
How does the Cacabelos Airbnb market stack up against its neighbors? Compare key performance metrics like average monthly revenue, ADR, and occupancy rates in surrounding areas to understand the broader regional STR landscape.
| Market | Active Properties | Monthly Revenue | Daily Rate | Avg. Occupancy |
|---|---|---|---|---|
| Armamar | 59 | $2,357 | $253.66 | 38% |
| Alijó | 64 | $2,217 | $264.67 | 32% |
| Mesão Frio | 53 | $1,907 | $195.39 | 46% |
| Anreade e São Romão de Arego | 14 | $1,836 | $184.41 | 39% |
| Tabuaço | 26 | $1,786 | $186.15 | 37% |
| A Fonsagrada | 16 | $1,773 | $154.02 | 42% |
| Sabrosa | 50 | $1,575 | $209.61 | 34% |
| Barrô | 10 | $1,559 | $159.59 | 37% |
| Portomarín | 13 | $1,545 | $152.80 | 50% |
| Peso da Régua | 117 | $1,522 | $188.88 | 33% |