Valdáliga Airbnb Market Analysis 2025: Short Term Rental Data & Vacation Rental Statistics in Cantabria, Spain
Is Airbnb profitable in Valdáliga in 2025? Explore comprehensive Airbnb analytics for Valdáliga, Cantabria, Spain to uncover income potential. This 2025 STR market report for Valdáliga, based on AirROI data from April 2024 to March 2025, reveals key trends in the niche market of 77 active listings.
Whether you're considering an Airbnb investment in Valdáliga, optimizing your existing vacation rental, or exploring rental arbitrage opportunities, understanding the Valdáliga Airbnb data is crucial. Understanding the local regulations is key to maximizing your short term rental income potential. Let's dive into the specifics.
Key Valdáliga Airbnb Performance Metrics Overview
Monthly Airbnb Revenue Variations & Income Potential in Valdáliga (2025)
Understanding the monthly revenue variations for Airbnb listings in Valdáliga is key to maximizing your short term rental income potential. Seasonality significantly impacts earnings. Our analysis, based on data from the past 12 months, shows that the peak revenue month for STRs in Valdáliga is typically August, while February often presents the lowest earnings, highlighting opportunities for strategic pricing adjustments during shoulder and low seasons. Explore the typical Airbnb income in Valdáliga across different performance tiers:
- Best-in-class properties (Top 10%) achieve $4,074+ monthly, often utilizing dynamic pricing and superior guest experiences.
- Strong performing properties (Top 25%) earn $2,405 or more, indicating effective management and desirable locations/amenities.
- Typical properties (Median) generate around $1,416 per month, representing the average market performance.
- Entry-level properties (Bottom 25%) see earnings around $771, often with potential for optimization.
Average Monthly Airbnb Earnings Trend in Valdáliga
Valdáliga Airbnb Occupancy Rate Trends (2025)
Maximize your bookings by understanding the Valdáliga STR occupancy trends. Seasonal demand shifts significantly influence how often properties are booked. Typically, Augustsees the highest demand (peak season occupancy), while January experiences the lowest (low season). Effective strategies, like adjusting minimum stays or offering promotions, can boost occupancy during slower periods. Here's how different property tiers perform in Valdáliga:
- Best-in-class properties (Top 10%) achieve 56%+ occupancy, indicating high desirability and potentially optimized availability.
- Strong performing properties (Top 25%) maintain 37% or higher occupancy, suggesting good market fit and guest satisfaction.
- Typical properties (Median) have an occupancy rate around 24%.
- Entry-level properties (Bottom 25%) average 13% occupancy, potentially facing higher vacancy.
Average Monthly Occupancy Rate Trend in Valdáliga
Average Daily Rate (ADR) Airbnb Trends in Valdáliga (2025)
Effective short term rental pricing strategy in Valdáliga involves understanding monthly ADR fluctuations. The Average Daily Rate (ADR) for Airbnb in Valdáliga typically peaks in August and dips lowest during November. Leveraging Airbnb dynamic pricing tools or strategies based on this seasonality can significantly boost revenue. Here's a look at the typical nightly rates achieved:
- Best-in-class properties (Top 10%) command rates of $352+ per night, often due to premium features or locations.
- Strong performing properties (Top 25%) achieve nightly rates of $243 or more.
- Typical properties (Median) charge around $162 per night.
- Entry-level properties (Bottom 25%) earn around $125 per night.
Average Daily Rate (ADR) Trend by Month in Valdáliga
Get Live Valdáliga Market Intelligence 👇

Explore Real-time Analytics
Airbnb Seasonality Analysis & Trends in Valdáliga (2025)
Peak Season (August, July, June)
- Revenue averages $4,117 per month
- Occupancy rates average 52.6%
- Daily rates average $242
Shoulder Season
- Revenue averages $1,827 per month
- Occupancy maintains around 21.9%
- Daily rates hold near $223
Low Season (February, March, November)
- Revenue drops to average $878 per month
- Occupancy decreases to average 17.0%
- Daily rates adjust to average $213
Seasonality Insights for Valdáliga
- The Airbnb seasonality in Valdáliga shows highly seasonal trends requiring careful strategy. While the sections above show seasonal averages, it's also insightful to look at the extremes:
- During the high season, the absolute peak month showcases Valdáliga's highest earning potential, with monthly revenues capable of climbing to $5,554, occupancy reaching a high of 71.2%, and ADRs peaking at $250.
- Conversely, the slowest single month of the year, typically falling within the low season, marks the market's lowest point. In this month, revenue might dip to $731, occupancy could drop to 14.7%, and ADRs may adjust down to $210.
- Understanding both the seasonal averages and these monthly peaks and troughs in revenue, occupancy, and ADR is crucial for maximizing your Airbnb profit potential in Valdáliga.
Seasonal Strategies for Maximizing Profit
- Peak Season: Maximize revenue through premium pricing and potentially longer minimum stays. Ensure high availability.
- Low Season: Offer competitive pricing, special promotions (e.g., extended stay discounts), and flexible cancellation policies. Target off-season travelers like remote workers or budget-conscious guests.
- Shoulder Seasons: Implement dynamic pricing that balances peak and low rates. Target weekend travelers or specific events. Offer slightly more flexible terms than peak season.
- Regularly analyze your own performance against these Valdáliga seasonality benchmarks and adjust your pricing and availability strategy accordingly.
Best Areas for Airbnb Investment in Valdáliga (2025)
Exploring the top neighborhoods for short-term rentals in Valdáliga? This section highlights key areas, outlining why they are attractive for hosts and guests, along with notable local attractions. Consider these locations based on your target guest profile and investment strategy.
| Neighborhood / Area | Why Host Here? (Target Guests & Appeal) | Key Attractions & Landmarks |
|---|---|---|
| Comillas | Beautiful coastal town with stunning architecture and rich cultural heritage, famous for El Capricho designed by Antoni Gaudí. Ideal for tourists looking for historical charm and beach access. | El Capricho, Comillas Beach, The Marqués de Comillas Palace, Cypress Gardens, Sculpture of the Pelayo, Historical Center |
| San Vicente de la Barquera | A picturesque fishing village known for its beautiful landscapes, stunning beaches, and rich seafood cuisine. Attracts beach lovers and nature enthusiasts. | San Vicente de la Barquera Beach, Castle of San Vicente, Picos de Europa National Park, Cabo Oyambre Natural Park, Seafood restaurants, Fishing port |
| Potes | A charming town in the Picos de Europa known for its traditional architecture and stunning mountain scenery, appealing to hikers and nature lovers. | The Hermida Monastery, Picos de Europa National Park, Cave of El Soplao, Santillana del Mar, Potrerillo Valley |
| Santillana del Mar | Known as the 'town of three lies', it features medieval streets and proximity to the famous Altamira Caves. Ideal for tourists interested in history and culture. | Altamira Caves, Colegiata de Santa Juliana, Historical town center, Santillana Zoo, Museum of Human Evolution |
| Torrelavega | A commercial hub with good access to various attractions, making it ideal for travelers who want to explore Cantabria and enjoy local amenities. | Parque de las Murallas, Torrelavega Theater, Museo de la Historia, Shopping centers, Local gastronomy |
| Noja | A coastal town with beautiful beaches and natural reserves, perfect for families and beachgoers seeking relaxation and fun in the sun. | Noja Beach, Dunes of Liencres, Nearby natural parks, Golf courses, Local beach restaurants |
| Laredo | Known for its long sandy beach and vibrant summer nightlife, Laredo offers a mix of relaxation and entertainment, attracting young and energetic travelers. | Laredo Beach, Historical sights, Fiestas de la Virgen de la Guía, Water sports, Laredo's promenade |
| Liérganes | A quaint village near the city with thermal springs and beautiful architecture, popular for romantic getaways and wellness retreats. | Natural thermal springs, Puente de los Suspiros, Came to the bibliotheca, Local hiking trails, Gastronomy experiences |
Understanding Airbnb License Requirements & STR Laws in Valdáliga (2025)
With 10% of listings showing registration in 2025, understanding potential Airbnb license requirements is crucial in Valdáliga. Always verify the latest short term rental regulations and Airbnb license requirements directly with local government authorities for Valdáliga to ensure full compliance before hosting.
(Source: AirROI data, 2025, based on 10% licensed listings)
Top Performing Airbnb Properties in Valdáliga (2025)
Benchmark your potential! Explore examples of top-performing Airbnb properties in Valdáligabased on Trailing Twelve Month (TTM) revenue. Analyze their characteristics, revenue, occupancy rate, and ADR to understand what drives success in this market.
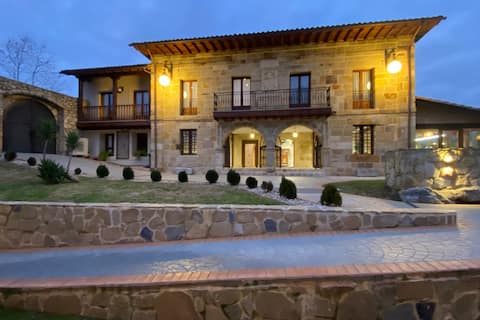
Luxury near the beaches .
Entire Place • 10 bedrooms
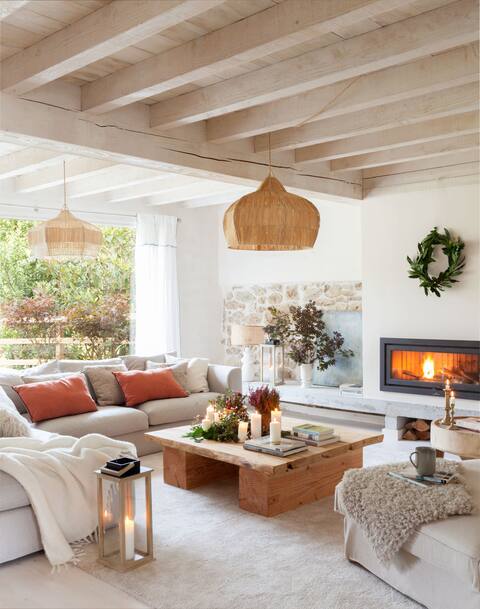
New house, heated pool, near Comillas
Entire Place • 6 bedrooms
Casa el Tejo, next to Comillas
Entire Place • 3 bedrooms
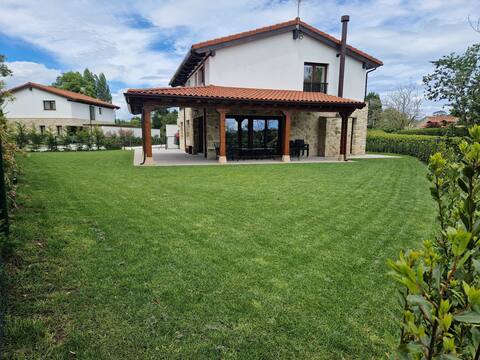
Entire Place • 5 bedrooms
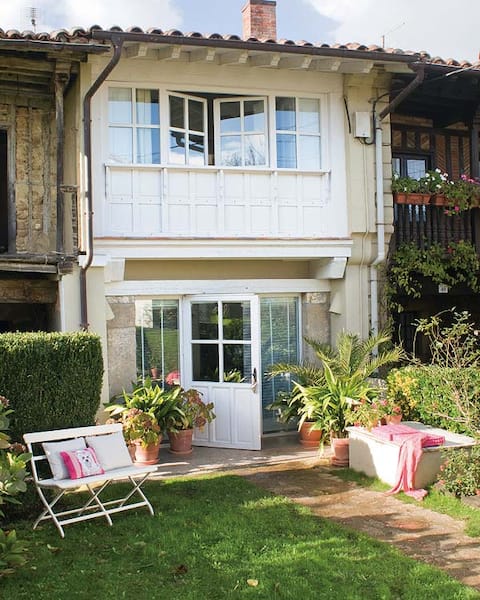
Vivienda con jardín
Entire Place • 2 bedrooms
Palacio de Hualle
Entire Place • 7 bedrooms
Note: Performance varies based on location, size, amenities, seasonality, and management quality. Data reflects the past 12 months.
Top Performing Airbnb Hosts in Valdáliga (2025)
Learn from the best! This table showcases top-performing Airbnb hosts in Valdáliga based on the number of properties managed and estimated total revenue over the past year. Analyze their scale and performance metrics.
| Host Name | Properties | Grossing Revenue | Stay Reviews | Avg Rating |
|---|---|---|---|---|
| Behome -Rentals | 2 | $151,051 | 13 | 2.46/5.0 |
| Isabel | 1 | $73,977 | 3 | 5.00/5.0 |
| Aroa | 6 | $71,939 | 28 | 2.42/5.0 |
| Margaret | 3 | $70,073 | 112 | 3.20/5.0 |
| Casuca | 5 | $65,568 | 23 | 3.98/5.0 |
| María | 4 | $55,993 | 318 | 4.84/5.0 |
| La Machina Santander | 1 | $48,236 | 6 | 5.00/5.0 |
| Alvaro | 1 | $47,975 | 6 | 5.00/5.0 |
| Host #22035820 | 1 | $45,430 | 146 | 4.95/5.0 |
| Maria Sonia | 2 | $34,510 | 149 | 4.78/5.0 |
Analyzing the strategies of top hosts, such as their property selection, pricing, and guest communication, can offer valuable lessons for optimizing your own Airbnb operations in Valdáliga.
Dive Deeper: Advanced Valdáliga STR Market Data (2025)
Ready to unlock more insights? AirROI provides access to advanced metrics and comprehensive Airbnb data for Valdáliga. Explore detailed analytics beyond this report to refine your investment strategy, optimize pricing, and maximize your vacation rental profits.
Explore Advanced MetricsValdáliga Short-Term Rental Market Composition (2025): Property & Room Types
Room Type Distribution
Property Type Distribution
Market Composition Insights for Valdáliga
- The Valdáliga Airbnb market composition is heavily skewed towards Entire Home/Apt listings, which make up 93.5% of the 77 active rentals. This indicates strong guest preference for privacy and space.
- Looking at the property type distribution in Valdáliga, House properties are the most common (59.7%), reflecting the local real estate landscape.
- Houses represent a significant 59.7% portion, catering likely to families or larger groups.
- Smaller segments like hotel/boutique (combined 2.6%) offer potential for unique stay experiences.
Valdáliga Airbnb Room Capacity Analysis (2025): Bedroom Distribution
Distribution of Listings by Number of Bedrooms
Room Capacity Insights for Valdáliga
- The dominant room capacity in Valdáliga is 2 bedrooms listings, making up 31.2% of the market. This suggests a strong demand for properties suitable for couples or solo travelers.
- Together, 2 bedrooms and 3 bedrooms properties represent 52.0% of the active Airbnb listings in Valdáliga, indicating a high concentration in these sizes.
- A significant 48.1% of listings offer 3+ bedrooms, catering to larger groups and families seeking more space in Valdáliga.
Valdáliga Vacation Rental Guest Capacity Trends (2025)
Distribution of Listings by Guest Capacity
Guest Capacity Insights for Valdáliga
- The most common guest capacity trend in Valdáliga vacation rentals is listings accommodating 8+ guests (29.9%). This suggests the primary traveler segment is likely larger groups.
- Properties designed for 8+ guests and 4 guests dominate the Valdáliga STR market, accounting for 59.8% of listings.
- 54.6% of properties accommodate 6+ guests, serving the market segment for larger families or group travel in Valdáliga.
- On average, properties in Valdáliga are equipped to host 5.6 guests.
Valdáliga Airbnb Booking Patterns (2025): Available vs. Booked Days
Available Days Distribution
Booked Days Distribution
Booking Pattern Insights for Valdáliga
- The most common availability pattern in Valdáliga falls within the 271-366 days range, representing 64.9% of listings. This suggests many properties have significant open periods on their calendars.
- Approximately 98.7% of listings show high availability (181+ days open annually), indicating potential for increased bookings or specific owner usage patterns.
- For booked days, the 31-90 days range is most frequent in Valdáliga (42.9%), reflecting common guest stay durations or potential owner blocking patterns.
- A notable 1.3% of properties secure long booking periods (181+ days booked per year), highlighting successful long-term rental strategies or significant owner usage.
Valdáliga Airbnb Minimum Stay Requirements Analysis
Distribution of Listings by Minimum Night Requirement
1 Night
8 listings
11.1% of total
2 Nights
40 listings
55.6% of total
3 Nights
10 listings
13.9% of total
4-6 Nights
8 listings
11.1% of total
30+ Nights
6 listings
8.3% of total
Key Insights
- The most prevalent minimum stay requirement in Valdáliga is 2 Nights, adopted by 55.6% of listings. This highlights the market's preference for shorter, flexible bookings.
- A strong majority (66.7%) of the Valdáliga Airbnb data shows acceptance of very short stays (1-2 nights), indicating a dynamic, high-turnover market.
Recommendations
- Align with the market by considering a 2 Nights minimum stay, as 55.6% of Valdáliga hosts use this setting.
- If feasible, allowing 1-night stays, especially midweek or during low season, could capture last-minute bookings, as only 11.1% currently do.
- A 2-night minimum appears standard (55.6%). Consider this for weekends or peak periods.
- Explore offering discounts for stays of 30+ nights to attract the 8.3% of the market seeking extended stays.
- Adjust minimum nights based on seasonality – potentially shorter during low season and longer during peak demand periods in Valdáliga.
Valdáliga Airbnb Cancellation Policy Trends Analysis (2025)
Flexible
12 listings
21.4% of total
Moderate
13 listings
23.2% of total
Firm
21 listings
37.5% of total
Strict
10 listings
17.9% of total
Cancellation Policy Insights for Valdáliga
- The prevailing Airbnb cancellation policy trend in Valdáliga is Firm, used by 37.5% of listings.
- A majority (55.4%) of hosts in Valdáliga utilize Firm or Strict policies, indicating a market where hosts prioritize booking security.
Recommendations for Hosts
- Consider adopting a Firm policy to align with the 37.5% market standard in Valdáliga.
- Regularly review your cancellation policy against competitors and market demand shifts in Valdáliga.
Valdáliga STR Booking Lead Time Analysis (2025)
Average Booking Lead Time by Month
Booking Lead Time Insights for Valdáliga
- The overall average booking lead time for vacation rentals in Valdáliga is 54 days.
- Guests book furthest in advance for stays during August (average 114 days), likely coinciding with peak travel demand or local events.
- The shortest booking windows occur for stays in February (average 19 days), indicating more last-minute travel plans during this time.
- Seasonally, Summer (91 days avg.) sees the longest lead times, while Winter (38 days avg.) has the shortest, reflecting typical travel planning cycles.
Recommendations for Hosts
- Use the overall average lead time (54 days) as a baseline for your pricing and availability strategy in Valdáliga.
- For August stays, consider implementing length-of-stay discounts or slightly higher rates for bookings made less than 114 days out to capitalize on advance planning.
- Target marketing efforts for the Summer season well in advance (at least 91 days) to capture early planners.
- Monitor your own booking lead times against these Valdáliga averages to identify opportunities for dynamic pricing adjustments.
Popular & Essential Airbnb Amenities in Valdáliga (2025)
Amenity Prevalence
Amenity Insights for Valdáliga
- Popular amenities like Kitchen, Heating, TV are common but not universal. Offering these can provide a competitive edge.
- Warning: Wifi is not universally provided but is considered essential globally. Ensure reliable Wifi is offered.
Recommendations for Hosts
- Consider adding popular differentiators like Kitchen or Heating to increase appeal.
- Highlight unique or less common amenities you offer (e.g., hot tub, dedicated workspace, EV charger) in your listing description and photos.
- Regularly check competitor amenities in Valdáliga to stay competitive.
Valdáliga Airbnb Guest Demographics & Profile Analysis (2025)
Guest Profile Summary for Valdáliga
- The typical guest profile for Airbnb in Valdáliga consists of primarily domestic travelers (72%), often arriving from nearby Madrid, typically belonging to the Post-2000s (Gen Z/Alpha) group (50%), primarily speaking Spanish or English.
- Domestic travelers account for 72.4% of guests.
- Key international markets include Spain (72.4%) and Germany (7%).
- Top languages spoken are Spanish (38.3%) followed by English (33.3%).
- A significant demographic segment is the Post-2000s (Gen Z/Alpha) group, representing 50% of guests.
Recommendations for Hosts
- Target domestic marketing efforts towards travelers from Madrid and Barcelona.
- Tailor amenities and listing descriptions to appeal to the dominant Post-2000s (Gen Z/Alpha) demographic (e.g., highlight fast WiFi, smart home features, local guides).
- Highlight unique local experiences or amenities relevant to the primary guest profile.
- Consider seasonal promotions aligned with peak travel times for key origin markets.
Nearby Short-Term Rental Market Comparison
How does the Valdáliga Airbnb market stack up against its neighbors? Compare key performance metrics like average monthly revenue, ADR, and occupancy rates in surrounding areas to understand the broader regional STR landscape.
| Market | Active Properties | Monthly Revenue | Daily Rate | Avg. Occupancy |
|---|---|---|---|---|
| Quintanilla Vivar | 12 | $2,167 | $186.62 | 41% |
| Getxo | 126 | $1,960 | $159.40 | 47% |
| Li�érganes | 49 | $1,948 | $207.69 | 44% |
| Aiarako kuadrilla/Cuadrilla de Ayala | 22 | $1,936 | $197.35 | 39% |
| Santiurde de Toranzo | 14 | $1,920 | $223.21 | 38% |
| Riotuerto | 15 | $1,897 | $199.60 | 35% |
| Entrambasaguas | 40 | $1,832 | $186.39 | 36% |
| Penagos | 23 | $1,797 | $265.07 | 29% |
| Bareyo | 11 | $1,731 | $190.63 | 46% |
| Villacarriedo | 28 | $1,680 | $281.35 | 35% |