Ruiloba Airbnb Market Analysis 2025: Short Term Rental Data & Vacation Rental Statistics in Cantabria, Spain
Is Airbnb profitable in Ruiloba in 2025? Explore comprehensive Airbnb analytics for Ruiloba, Cantabria, Spain to uncover income potential. This 2025 STR market report for Ruiloba, based on AirROI data from April 2024 to March 2025, reveals key trends in the niche market of 49 active listings.
Whether you're considering an Airbnb investment in Ruiloba, optimizing your existing vacation rental, or exploring rental arbitrage opportunities, understanding the Ruiloba Airbnb data is crucial. Understanding the local regulations is key to maximizing your short term rental income potential. Let's dive into the specifics.
Key Ruiloba Airbnb Performance Metrics Overview
Monthly Airbnb Revenue Variations & Income Potential in Ruiloba (2025)
Understanding the monthly revenue variations for Airbnb listings in Ruiloba is key to maximizing your short term rental income potential. Seasonality significantly impacts earnings. Our analysis, based on data from the past 12 months, shows that the peak revenue month for STRs in Ruiloba is typically August, while January often presents the lowest earnings, highlighting opportunities for strategic pricing adjustments during shoulder and low seasons. Explore the typical Airbnb income in Ruiloba across different performance tiers:
- Best-in-class properties (Top 10%) achieve $3,763+ monthly, often utilizing dynamic pricing and superior guest experiences.
- Strong performing properties (Top 25%) earn $2,133 or more, indicating effective management and desirable locations/amenities.
- Typical properties (Median) generate around $1,201 per month, representing the average market performance.
- Entry-level properties (Bottom 25%) see earnings around $680, often with potential for optimization.
Average Monthly Airbnb Earnings Trend in Ruiloba
Ruiloba Airbnb Occupancy Rate Trends (2025)
Maximize your bookings by understanding the Ruiloba STR occupancy trends. Seasonal demand shifts significantly influence how often properties are booked. Typically, Augustsees the highest demand (peak season occupancy), while January experiences the lowest (low season). Effective strategies, like adjusting minimum stays or offering promotions, can boost occupancy during slower periods. Here's how different property tiers perform in Ruiloba:
- Best-in-class properties (Top 10%) achieve 66%+ occupancy, indicating high desirability and potentially optimized availability.
- Strong performing properties (Top 25%) maintain 53% or higher occupancy, suggesting good market fit and guest satisfaction.
- Typical properties (Median) have an occupancy rate around 31%.
- Entry-level properties (Bottom 25%) average 15% occupancy, potentially facing higher vacancy.
Average Monthly Occupancy Rate Trend in Ruiloba
Average Daily Rate (ADR) Airbnb Trends in Ruiloba (2025)
Effective short term rental pricing strategy in Ruiloba involves understanding monthly ADR fluctuations. The Average Daily Rate (ADR) for Airbnb in Ruiloba typically peaks in August and dips lowest during November. Leveraging Airbnb dynamic pricing tools or strategies based on this seasonality can significantly boost revenue. Here's a look at the typical nightly rates achieved:
- Best-in-class properties (Top 10%) command rates of $282+ per night, often due to premium features or locations.
- Strong performing properties (Top 25%) achieve nightly rates of $190 or more.
- Typical properties (Median) charge around $120 per night.
- Entry-level properties (Bottom 25%) earn around $92 per night.
Average Daily Rate (ADR) Trend by Month in Ruiloba
Get Live Ruiloba Market Intelligence 👇
Explore Real-time Analytics
Airbnb Seasonality Analysis & Trends in Ruiloba (2025)
Peak Season (August, July, June)
- Revenue averages $2,869 per month
- Occupancy rates average 51.4%
- Daily rates average $178
Shoulder Season
- Revenue averages $1,428 per month
- Occupancy maintains around 34.8%
- Daily rates hold near $162
Low Season (January, February, November)
- Revenue drops to average $746 per month
- Occupancy decreases to average 17.0%
- Daily rates adjust to average $154
Seasonality Insights for Ruiloba
- The Airbnb seasonality in Ruiloba shows highly seasonal trends requiring careful strategy. While the sections above show seasonal averages, it's also insightful to look at the extremes:
- During the high season, the absolute peak month showcases Ruiloba's highest earning potential, with monthly revenues capable of climbing to $3,578, occupancy reaching a high of 63.5%, and ADRs peaking at $184.
- Conversely, the slowest single month of the year, typically falling within the low season, marks the market's lowest point. In this month, revenue might dip to $684, occupancy could drop to 13.6%, and ADRs may adjust down to $148.
- Understanding both the seasonal averages and these monthly peaks and troughs in revenue, occupancy, and ADR is crucial for maximizing your Airbnb profit potential in Ruiloba.
Seasonal Strategies for Maximizing Profit
- Peak Season: Maximize revenue through premium pricing and potentially longer minimum stays. Ensure high availability.
- Low Season: Offer competitive pricing, special promotions (e.g., extended stay discounts), and flexible cancellation policies. Target off-season travelers like remote workers or budget-conscious guests.
- Shoulder Seasons: Implement dynamic pricing that balances peak and low rates. Target weekend travelers or specific events. Offer slightly more flexible terms than peak season.
- Regularly analyze your own performance against these Ruiloba seasonality benchmarks and adjust your pricing and availability strategy accordingly.
Best Areas for Airbnb Investment in Ruiloba (2025)
Exploring the top neighborhoods for short-term rentals in Ruiloba? This section highlights key areas, outlining why they are attractive for hosts and guests, along with notable local attractions. Consider these locations based on your target guest profile and investment strategy.
| Neighborhood / Area | Why Host Here? (Target Guests & Appeal) | Key Attractions & Landmarks |
|---|---|---|
| Ruiloba Beach | A beautiful beach area perfect for sunbathing and water sports. Attracts tourists looking for a beach getaway in a serene location. | Ruiloba Beach, Cabo de Ajo, Caves of Monte Castillo, Playa de la Ribera, Local seafood restaurants |
| Jardines de la Casa de Ruiloba | A scenic garden area ideal for relaxation and family picnics. Offers tranquil surroundings with beautiful flora and local wildlife. | Casa de Ruiloba, Botanical gardens, Walking trails, Picnic spots, Local flora exhibitions |
| Picos de Europa Access | Gateway to the stunning Picos de Europa National Park. Ideal for adventure seekers and nature lovers interested in hiking and exploring natural landscapes. | Picos de Europa National Park, Hiking trails, Countryside villages, Natural parks, Scenic viewpoints |
| Santillana del Mar | Close proximity to the historic town known for its medieval architecture and charming streets. A great cultural experience for visitors. | Altamira Cave, Plaza Mayor, Museums, Historic churches, Local artisan shops |
| Comillas | A picturesque coastal town known for its architecture and beaches. Attracts tourists looking for cultural experiences and seaside relaxation. | El Capricho de Gaudí, Comillas Beach, Historical architecture, Cultural festivals, Local seafood cuisine |
| Tudes | A small, quiet village that offers a serene getaway and authentic local experiences. Great for visitors looking for a peaceful retreat. | Traditional architecture, Local vineyards, Hiking routes, Nature trails, Community events |
| Santa Justa Road | A scenic road offering panoramic views of the countryside and proximity to various attractions. Ideal for tourists looking to explore the region. | Scenic views, Countryside paths, Local vineyards, Photography spots, Picnic areas |
| Cultural Events | The area hosts various local festivals and cultural events throughout the year, drawing visitors interested in experiencing local traditions and culture. | Annual festivals, Local markets, Cultural performances, Art exhibitions, Food fairs |
Understanding Airbnb License Requirements & STR Laws in Ruiloba (2025)
With 22% of listings showing registration in 2025, understanding potential Airbnb license requirements is crucial in Ruiloba. Always verify the latest short term rental regulations and Airbnb license requirements directly with local government authorities for Ruiloba to ensure full compliance before hosting.
(Source: AirROI data, 2025, based on 22% licensed listings)
Top Performing Airbnb Properties in Ruiloba (2025)
Benchmark your potential! Explore examples of top-performing Airbnb properties in Ruilobabased on Trailing Twelve Month (TTM) revenue. Analyze their characteristics, revenue, occupancy rate, and ADR to understand what drives success in this market.
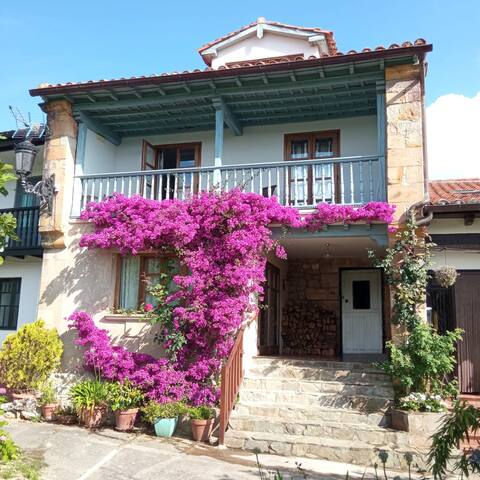
Casa Buganvilla, Comillas, Cantabria
Entire Place • 6 bedrooms
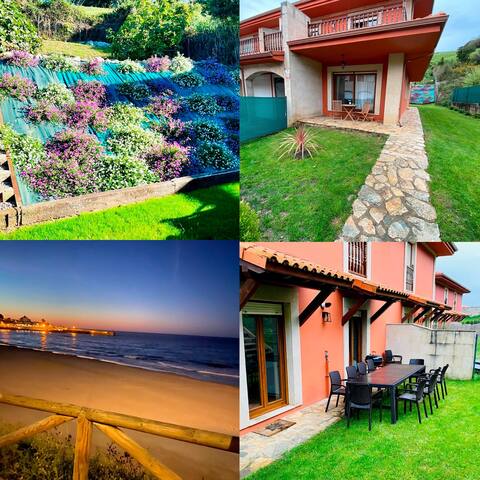
Comillas Chalet “La Higuera” in Comillas beach
Entire Place • 5 bedrooms
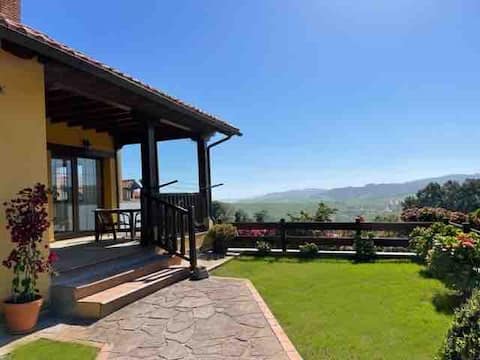
Sunny coastal house with breathtaking views
Entire Place • 3 bedrooms
The Sea Line - Ocean View Penthouse
Entire Place • 2 bedrooms
The Sea Line - Comfortable Ocean View Apartment
Entire Place • 2 bedrooms

Chalet in Comillas (Cantabria)
Entire Place • 5 bedrooms
Note: Performance varies based on location, size, amenities, seasonality, and management quality. Data reflects the past 12 months.
Top Performing Airbnb Hosts in Ruiloba (2025)
Learn from the best! This table showcases top-performing Airbnb hosts in Ruiloba based on the number of properties managed and estimated total revenue over the past year. Analyze their scale and performance metrics.
| Host Name | Properties | Grossing Revenue | Stay Reviews | Avg Rating |
|---|---|---|---|---|
| Ricardo | 4 | $74,340 | 67 | 3.50/5.0 |
| Marta | 2 | $56,844 | 7 | 4.83/5.0 |
| Mari | 3 | $47,628 | 332 | 4.53/5.0 |
| Clara | 1 | $44,926 | 4 | 5.00/5.0 |
| Florian | 1 | $42,828 | 16 | 4.75/5.0 |
| Adelaide | 1 | $40,099 | 43 | 4.91/5.0 |
| Miguel | 2 | $29,302 | 237 | 4.78/5.0 |
| Carmen | 1 | $26,919 | 56 | 4.52/5.0 |
| Rafael | 1 | $22,315 | 38 | 5.00/5.0 |
| Maria Luz | 1 | $21,076 | 16 | 5.00/5.0 |
Analyzing the strategies of top hosts, such as their property selection, pricing, and guest communication, can offer valuable lessons for optimizing your own Airbnb operations in Ruiloba.
Dive Deeper: Advanced Ruiloba STR Market Data (2025)
Ready to unlock more insights? AirROI provides access to advanced metrics and comprehensive Airbnb data for Ruiloba. Explore detailed analytics beyond this report to refine your investment strategy, optimize pricing, and maximize your vacation rental profits.
Explore Advanced MetricsRuiloba Short-Term Rental Market Composition (2025): Property & Room Types
Room Type Distribution
Property Type Distribution
Market Composition Insights for Ruiloba
- The Ruiloba Airbnb market composition is heavily skewed towards Entire Home/Apt listings, which make up 93.9% of the 49 active rentals. This indicates strong guest preference for privacy and space.
- Looking at the property type distribution in Ruiloba, Apartment/Condo properties are the most common (69.4%), reflecting the local real estate landscape.
- Houses represent a significant 28.6% portion, catering likely to families or larger groups.
- Smaller segments like outdoor/unique (combined 2.0%) offer potential for unique stay experiences.
Ruiloba Airbnb Room Capacity Analysis (2025): Bedroom Distribution
Distribution of Listings by Number of Bedrooms
Room Capacity Insights for Ruiloba
- The dominant room capacity in Ruiloba is 2 bedrooms listings, making up 63.3% of the market. This suggests a strong demand for properties suitable for couples or solo travelers.
- Together, 2 bedrooms and 1 bedroom properties represent 75.5% of the active Airbnb listings in Ruiloba, indicating a high concentration in these sizes.
- A significant 22.4% of listings offer 3+ bedrooms, catering to larger groups and families seeking more space in Ruiloba.
Ruiloba Vacation Rental Guest Capacity Trends (2025)
Distribution of Listings by Guest Capacity
Guest Capacity Insights for Ruiloba
- The most common guest capacity trend in Ruiloba vacation rentals is listings accommodating 4 guests (59.2%). This suggests the primary traveler segment is likely small families or groups.
- Properties designed for 4 guests and 6 guests dominate the Ruiloba STR market, accounting for 73.5% of listings.
- 28.5% of properties accommodate 6+ guests, serving the market segment for larger families or group travel in Ruiloba.
- On average, properties in Ruiloba are equipped to host 4.8 guests.
Ruiloba Airbnb Booking Patterns (2025): Available vs. Booked Days
Available Days Distribution
Booked Days Distribution
Booking Pattern Insights for Ruiloba
- The most common availability pattern in Ruiloba falls within the 271-366 days range, representing 57.1% of listings. This suggests many properties have significant open periods on their calendars.
- Approximately 83.6% of listings show high availability (181+ days open annually), indicating potential for increased bookings or specific owner usage patterns.
- For booked days, the 31-90 days range is most frequent in Ruiloba (36.7%), reflecting common guest stay durations or potential owner blocking patterns.
- A notable 16.3% of properties secure long booking periods (181+ days booked per year), highlighting successful long-term rental strategies or significant owner usage.
Ruiloba Airbnb Minimum Stay Requirements Analysis
Distribution of Listings by Minimum Night Requirement
1 Night
3 listings
6.5% of total
2 Nights
14 listings
30.4% of total
3 Nights
7 listings
15.2% of total
4-6 Nights
9 listings
19.6% of total
7-29 Nights
5 listings
10.9% of total
30+ Nights
8 listings
17.4% of total
Key Insights
- The most prevalent minimum stay requirement in Ruiloba is 2 Nights, adopted by 30.4% of listings. This highlights the market's preference for shorter, flexible bookings.
- A significant segment (17.4%) caters to monthly stays (30+ nights) in Ruiloba, pointing to opportunities in the extended-stay market.
Recommendations
- Align with the market by considering a 2 Nights minimum stay, as 30.4% of Ruiloba hosts use this setting.
- If feasible, allowing 1-night stays, especially midweek or during low season, could capture last-minute bookings, as only 6.5% currently do.
- A 2-night minimum appears standard (30.4%). Consider this for weekends or peak periods.
- Explore offering discounts for stays of 30+ nights to attract the 17.4% of the market seeking extended stays.
- Adjust minimum nights based on seasonality – potentially shorter during low season and longer during peak demand periods in Ruiloba.
Ruiloba Airbnb Cancellation Policy Trends Analysis (2025)
Flexible
8 listings
21.1% of total
Moderate
12 listings
31.6% of total
Firm
8 listings
21.1% of total
Strict
10 listings
26.3% of total
Cancellation Policy Insights for Ruiloba
- The prevailing Airbnb cancellation policy trend in Ruiloba is Moderate, used by 31.6% of listings.
- There's a relatively balanced mix between guest-friendly (52.7%) and stricter (47.4%) policies, offering choices for different guest needs.
Recommendations for Hosts
- Consider adopting a Moderate policy to align with the 31.6% market standard in Ruiloba.
- Regularly review your cancellation policy against competitors and market demand shifts in Ruiloba.
Ruiloba STR Booking Lead Time Analysis (2025)
Average Booking Lead Time by Month
Booking Lead Time Insights for Ruiloba
- The overall average booking lead time for vacation rentals in Ruiloba is 56 days.
- Guests book furthest in advance for stays during July (average 102 days), likely coinciding with peak travel demand or local events.
- The shortest booking windows occur for stays in January (average 18 days), indicating more last-minute travel plans during this time.
- Seasonally, Summer (93 days avg.) sees the longest lead times, while Winter (29 days avg.) has the shortest, reflecting typical travel planning cycles.
Recommendations for Hosts
- Use the overall average lead time (56 days) as a baseline for your pricing and availability strategy in Ruiloba.
- For July stays, consider implementing length-of-stay discounts or slightly higher rates for bookings made less than 102 days out to capitalize on advance planning.
- Target marketing efforts for the Summer season well in advance (at least 93 days) to capture early planners.
- Monitor your own booking lead times against these Ruiloba averages to identify opportunities for dynamic pricing adjustments.
Popular & Essential Airbnb Amenities in Ruiloba (2025)
Amenity Prevalence
Amenity Insights for Ruiloba
- Essential amenities in Ruiloba that guests expect include: Heating, TV. Lacking these (any) could significantly impact bookings.
- Popular amenities like Washer, Kitchen, Essentials are common but not universal. Offering these can provide a competitive edge.
Recommendations for Hosts
- Ensure your listing includes all essential amenities for Ruiloba: Heating, TV.
- Prioritize adding missing essentials: Heating, TV.
- Consider adding popular differentiators like Washer or Kitchen to increase appeal.
- Highlight unique or less common amenities you offer (e.g., hot tub, dedicated workspace, EV charger) in your listing description and photos.
- Regularly check competitor amenities in Ruiloba to stay competitive.
Ruiloba Airbnb Guest Demographics & Profile Analysis (2025)
Guest Profile Summary for Ruiloba
- The typical guest profile for Airbnb in Ruiloba consists of primarily domestic travelers (68%), often arriving from nearby Madrid, typically belonging to the Post-2000s (Gen Z/Alpha) group (50%), primarily speaking Spanish or English.
- Domestic travelers account for 68.2% of guests.
- Key international markets include Spain (68.2%) and France (6.5%).
- Top languages spoken are Spanish (35.4%) followed by English (33.3%).
- A significant demographic segment is the Post-2000s (Gen Z/Alpha) group, representing 50% of guests.
Recommendations for Hosts
- Target domestic marketing efforts towards travelers from Madrid and Valladolid.
- Tailor amenities and listing descriptions to appeal to the dominant Post-2000s (Gen Z/Alpha) demographic (e.g., highlight fast WiFi, smart home features, local guides).
- Highlight unique local experiences or amenities relevant to the primary guest profile.
- Consider seasonal promotions aligned with peak travel times for key origin markets.
Nearby Short-Term Rental Market Comparison
How does the Ruiloba Airbnb market stack up against its neighbors? Compare key performance metrics like average monthly revenue, ADR, and occupancy rates in surrounding areas to understand the broader regional STR landscape.
| Market | Active Properties | Monthly Revenue | Daily Rate | Avg. Occupancy |
|---|---|---|---|---|
| Quintanilla Vivar | 12 | $2,167 | $186.62 | 41% |
| Getxo | 126 | $1,960 | $159.40 | 47% |
| Liérganes | 49 | $1,948 | $207.69 | 44% |
| Aiarako kuadrilla/Cuadrilla de Ayala | 22 | $1,936 | $197.35 | 39% |
| Santiurde de Toranzo | 14 | $1,920 | $223.21 | 38% |
| Riotuerto | 15 | $1,897 | $199.60 | 35% |
| Entrambasaguas | 40 | $1,832 | $186.39 | 36% |
| Penagos | 23 | $1,797 | $265.07 | 29% |
| Bareyo | 11 | $1,731 | $190.63 | 46% |
| Villacarriedo | 28 | $1,680 | $281.35 | 35% |