Potes Airbnb Market Analysis 2025: Short Term Rental Data & Vacation Rental Statistics in Cantabria, Spain
Is Airbnb profitable in Potes in 2025? Explore comprehensive Airbnb analytics for Potes, Cantabria, Spain to uncover income potential. This 2025 STR market report for Potes, based on AirROI data from April 2024 to March 2025, reveals key trends in the niche market of 45 active listings.
Whether you're considering an Airbnb investment in Potes, optimizing your existing vacation rental, or exploring rental arbitrage opportunities, understanding the Potes Airbnb data is crucial. Navigating the high regulation landscape is key to maximizing your short term rental income potential. Let's dive into the specifics.
Key Potes Airbnb Performance Metrics Overview
Monthly Airbnb Revenue Variations & Income Potential in Potes (2025)
Understanding the monthly revenue variations for Airbnb listings in Potes is key to maximizing your short term rental income potential. Seasonality significantly impacts earnings. Our analysis, based on data from the past 12 months, shows that the peak revenue month for STRs in Potes is typically August, while February often presents the lowest earnings, highlighting opportunities for strategic pricing adjustments during shoulder and low seasons. Explore the typical Airbnb income in Potes across different performance tiers:
- Best-in-class properties (Top 10%) achieve $3,701+ monthly, often utilizing dynamic pricing and superior guest experiences.
- Strong performing properties (Top 25%) earn $2,319 or more, indicating effective management and desirable locations/amenities.
- Typical properties (Median) generate around $1,395 per month, representing the average market performance.
- Entry-level properties (Bottom 25%) see earnings around $734, often with potential for optimization.
Average Monthly Airbnb Earnings Trend in Potes
Potes Airbnb Occupancy Rate Trends (2025)
Maximize your bookings by understanding the Potes STR occupancy trends. Seasonal demand shifts significantly influence how often properties are booked. Typically, Augustsees the highest demand (peak season occupancy), while March experiences the lowest (low season). Effective strategies, like adjusting minimum stays or offering promotions, can boost occupancy during slower periods. Here's how different property tiers perform in Potes:
- Best-in-class properties (Top 10%) achieve 69%+ occupancy, indicating high desirability and potentially optimized availability.
- Strong performing properties (Top 25%) maintain 53% or higher occupancy, suggesting good market fit and guest satisfaction.
- Typical properties (Median) have an occupancy rate around 36%.
- Entry-level properties (Bottom 25%) average 20% occupancy, potentially facing higher vacancy.
Average Monthly Occupancy Rate Trend in Potes
Average Daily Rate (ADR) Airbnb Trends in Potes (2025)
Effective short term rental pricing strategy in Potes involves understanding monthly ADR fluctuations. The Average Daily Rate (ADR) for Airbnb in Potes typically peaks in August and dips lowest during February. Leveraging Airbnb dynamic pricing tools or strategies based on this seasonality can significantly boost revenue. Here's a look at the typical nightly rates achieved:
- Best-in-class properties (Top 10%) command rates of $251+ per night, often due to premium features or locations.
- Strong performing properties (Top 25%) achieve nightly rates of $153 or more.
- Typical properties (Median) charge around $114 per night.
- Entry-level properties (Bottom 25%) earn around $85 per night.
Average Daily Rate (ADR) Trend by Month in Potes
Get Live Potes Market Intelligence 👇

Explore Real-time Analytics
Airbnb Seasonality Analysis & Trends in Potes (2025)
Peak Season (August, July, June)
- Revenue averages $2,872 per month
- Occupancy rates average 54.7%
- Daily rates average $150
Shoulder Season
- Revenue averages $1,822 per month
- Occupancy maintains around 36.1%
- Daily rates hold near $142
Low Season (January, February, March)
- Revenue drops to average $841 per month
- Occupancy decreases to average 24.4%
- Daily rates adjust to average $122
Seasonality Insights for Potes
- The Airbnb seasonality in Potes shows highly seasonal trends requiring careful strategy. While the sections above show seasonal averages, it's also insightful to look at the extremes:
- During the high season, the absolute peak month showcases Potes's highest earning potential, with monthly revenues capable of climbing to $3,429, occupancy reaching a high of 72.1%, and ADRs peaking at $152.
- Conversely, the slowest single month of the year, typically falling within the low season, marks the market's lowest point. In this month, revenue might dip to $748, occupancy could drop to 23.4%, and ADRs may adjust down to $119.
- Understanding both the seasonal averages and these monthly peaks and troughs in revenue, occupancy, and ADR is crucial for maximizing your Airbnb profit potential in Potes.
Seasonal Strategies for Maximizing Profit
- Peak Season: Maximize revenue through premium pricing and potentially longer minimum stays. Ensure high availability.
- Low Season: Offer competitive pricing, special promotions (e.g., extended stay discounts), and flexible cancellation policies. Target off-season travelers like remote workers or budget-conscious guests.
- Shoulder Seasons: Implement dynamic pricing that balances peak and low rates. Target weekend travelers or specific events. Offer slightly more flexible terms than peak season.
- Regularly analyze your own performance against these Potes seasonality benchmarks and adjust your pricing and availability strategy accordingly.
Best Areas for Airbnb Investment in Potes (2025)
Exploring the top neighborhoods for short-term rentals in Potes? This section highlights key areas, outlining why they are attractive for hosts and guests, along with notable local attractions. Consider these locations based on your target guest profile and investment strategy.
| Neighborhood / Area | Why Host Here? (Target Guests & Appeal) | Key Attractions & Landmarks |
|---|---|---|
| Centro de Potes | The historic center of Potes, known for its charming streets and traditional architecture, attracts tourists looking to explore the beauty and culture of Cantabria. | Monastery of Santo Toribio de Liébana, Torre de Orejón de la Baña, Potes' picturesque streets, Local artisan shops, Restaurants offering traditional Cantabrian cuisine |
| Liebana Valley | A stunning natural setting surrounded by mountains and lush greenery, perfect for nature lovers and outdoor activities such as hiking and sightseeing. | Picos de Europa National Park, Hiking trails, Mountain biking, River Deva, Scenic viewpoints |
| Torre del Órgano | A beautiful spot near Potes offering breathtaking views of the mountains and valley, appealing to those seeking tranquility and nature. | Scenic viewpoints, Nature walks, Photography spots, Local wildlife, Star gazing opportunities |
| La Vega de Liébana | A scenic valley area near Potes known for its rich agricultural landscape and picturesque villages, perfect for those looking to enjoy a rural retreat. | Local farms, Traditional festivals, Cultural heritage, Rural tourism opportunities, Gastronomy |
| Barcena Mayor | An ancient mountain village that showcases traditional Cantabrian architecture and culture, attracting visitors interested in history and heritage. | Historic village architecture, Nature trails, Cultural events, Traditional cuisine, Local artisan crafts |
| Valle de Cabuérniga | A less crowded area known for its natural beauty, perfect for families and travelers looking for peace and quiet away from the tourist crowds. | Cabuérniga River, Local wildlife, Relaxing nature walks, Quiet villages, Cultural experiences |
| Somahoz | A quaint village located a short distance from Potes, known for its beautiful surroundings and traditional houses, appealing to those seeking an authentic experience. | Village architecture, Natural landscapes, Hiking trails, Cultural heritage, Local festivals |
| Fuente De | A well-known spot for starting treks into the Picos de Europa, attracting outdoor enthusiasts and adventure seekers with access to stunning landscapes. | Cable car to Picos de Europa, Hiking trails, Scenic viewpoints, Wildlife observation, Adventure sports opportunities |
Understanding Airbnb License Requirements & STR Laws in Potes (2025)
Yes, Potes, Cantabria, Spain enforces high STR regulations. Obtaining a license and ensuring compliance is almost certainly required according to current 2025 STR laws. Always verify the latest short term rental regulations and Airbnb license requirements directly with local government authorities for Potes to ensure full compliance before hosting.
(Source: AirROI data, 2025, based on 33% licensed listings)
Top Performing Airbnb Properties in Potes (2025)
Benchmark your potential! Explore examples of top-performing Airbnb properties in Potesbased on Trailing Twelve Month (TTM) revenue. Analyze their characteristics, revenue, occupancy rate, and ADR to understand what drives success in this market.
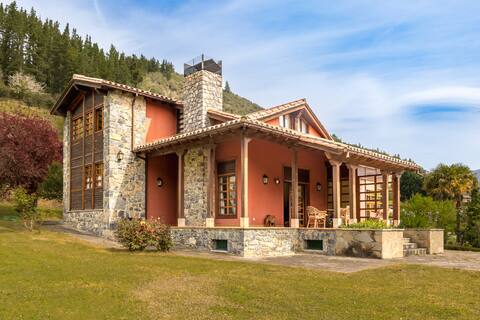
Exclusive Villa en Potes
Entire Place • 3 bedrooms
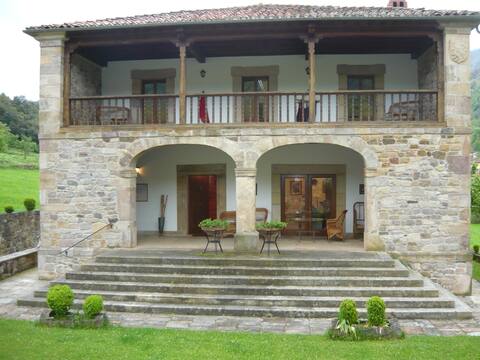
Villa San Pelayo. PICOS DE EUROPA
Entire Place • 5 bedrooms

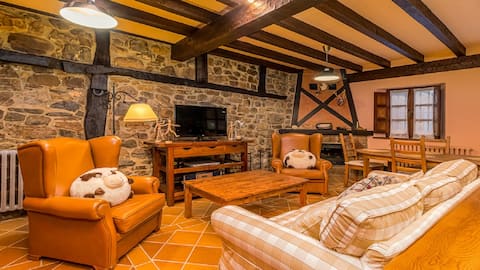
La Finca Roja Exclusiva
Entire Place • 5 bedrooms
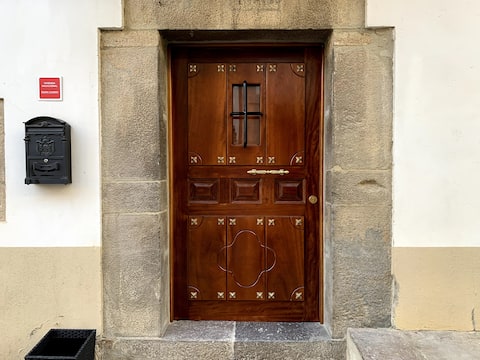
Traditional Stone House | Center of Potes | Garage
Entire Place • 2 bedrooms
Apartamentos Mora
Entire Place • 3 bedrooms

Downtown apartment in Villa Solana, de Potes
Entire Place • 2 bedrooms
Note: Performance varies based on location, size, amenities, seasonality, and management quality. Data reflects the past 12 months.
Top Performing Airbnb Hosts in Potes (2025)
Learn from the best! This table showcases top-performing Airbnb hosts in Potes based on the number of properties managed and estimated total revenue over the past year. Analyze their scale and performance metrics.
| Host Name | Properties | Grossing Revenue | Stay Reviews | Avg Rating |
|---|---|---|---|---|
| Aldine | 4 | $115,630 | 29 | 4.89/5.0 |
| Nacho | 1 | $72,156 | 28 | 4.86/5.0 |
| Elena | 3 | $67,734 | 461 | 4.83/5.0 |
| Ana | 1 | $57,066 | 47 | 4.87/5.0 |
| Pilar | 3 | $55,019 | 33 | 4.99/5.0 |
| Héctor | 2 | $51,885 | 12 | 2.42/5.0 |
| Jose Angel | 5 | $45,742 | 215 | 4.55/5.0 |
| Juan | 1 | $29,682 | 34 | 4.85/5.0 |
| Sonia | 1 | $24,095 | 67 | 4.96/5.0 |
| Cristobal | 5 | $24,086 | 57 | 3.04/5.0 |
Analyzing the strategies of top hosts, such as their property selection, pricing, and guest communication, can offer valuable lessons for optimizing your own Airbnb operations in Potes.
Dive Deeper: Advanced Potes STR Market Data (2025)
Ready to unlock more insights? AirROI provides access to advanced metrics and comprehensive Airbnb data for Potes. Explore detailed analytics beyond this report to refine your investment strategy, optimize pricing, and maximize your vacation rental profits.
Explore Advanced MetricsPotes Short-Term Rental Market Composition (2025): Property & Room Types
Room Type Distribution
Property Type Distribution
Market Composition Insights for Potes
- The Potes Airbnb market composition is heavily skewed towards Entire Home/Apt listings, which make up 91.1% of the 45 active rentals. This indicates strong guest preference for privacy and space.
- Looking at the property type distribution in Potes, Apartment/Condo properties are the most common (66.7%), reflecting the local real estate landscape.
- Houses represent a significant 20% portion, catering likely to families or larger groups.
- Smaller segments like hotel/boutique (combined 4.4%) offer potential for unique stay experiences.
Potes Airbnb Room Capacity Analysis (2025): Bedroom Distribution
Distribution of Listings by Number of Bedrooms
Room Capacity Insights for Potes
- The dominant room capacity in Potes is 1 bedroom listings, making up 37.8% of the market. This suggests a strong demand for properties suitable for couples or solo travelers.
- Together, 1 bedroom and 2 bedrooms properties represent 62.2% of the active Airbnb listings in Potes, indicating a high concentration in these sizes.
- A significant 33.2% of listings offer 3+ bedrooms, catering to larger groups and families seeking more space in Potes.
Potes Vacation Rental Guest Capacity Trends (2025)
Distribution of Listings by Guest Capacity
Guest Capacity Insights for Potes
- The most common guest capacity trend in Potes vacation rentals is listings accommodating 6 guests (20%). This suggests the primary traveler segment is likely larger groups.
- Properties designed for 6 guests and 2 guests dominate the Potes STR market, accounting for 37.8% of listings.
- 40.0% of properties accommodate 6+ guests, serving the market segment for larger families or group travel in Potes.
- On average, properties in Potes are equipped to host 4.6 guests.
Potes Airbnb Booking Patterns (2025): Available vs. Booked Days
Available Days Distribution
Booked Days Distribution
Booking Pattern Insights for Potes
- The most common availability pattern in Potes falls within the 271-366 days range, representing 53.3% of listings. This suggests many properties have significant open periods on their calendars.
- Approximately 84.4% of listings show high availability (181+ days open annually), indicating potential for increased bookings or specific owner usage patterns.
- For booked days, the 91-180 days range is most frequent in Potes (40%), reflecting common guest stay durations or potential owner blocking patterns.
- A notable 15.6% of properties secure long booking periods (181+ days booked per year), highlighting successful long-term rental strategies or significant owner usage.
Potes Airbnb Minimum Stay Requirements Analysis
Distribution of Listings by Minimum Night Requirement
1 Night
12 listings
30% of total
2 Nights
18 listings
45% of total
3 Nights
6 listings
15% of total
4-6 Nights
1 listings
2.5% of total
30+ Nights
3 listings
7.5% of total
Key Insights
- The most prevalent minimum stay requirement in Potes is 2 Nights, adopted by 45% of listings. This highlights the market's preference for shorter, flexible bookings.
- A strong majority (75.0%) of the Potes Airbnb data shows acceptance of very short stays (1-2 nights), indicating a dynamic, high-turnover market.
Recommendations
- Align with the market by considering a 2 Nights minimum stay, as 45% of Potes hosts use this setting.
- Explore offering discounts for stays of 30+ nights to attract the 7.5% of the market seeking extended stays.
- Adjust minimum nights based on seasonality – potentially shorter during low season and longer during peak demand periods in Potes.
Potes Airbnb Cancellation Policy Trends Analysis (2025)
Flexible
11 listings
26.8% of total
Moderate
18 listings
43.9% of total
Firm
1 listings
2.4% of total
Strict
11 listings
26.8% of total
Cancellation Policy Insights for Potes
- The prevailing Airbnb cancellation policy trend in Potes is Moderate, used by 43.9% of listings.
- The market strongly favors guest-friendly terms, with 70.7% of listings offering Flexible or Moderate policies. This suggests guests in Potes may expect booking flexibility.
Recommendations for Hosts
- Consider adopting a Moderate policy to align with the 43.9% market standard in Potes.
- Regularly review your cancellation policy against competitors and market demand shifts in Potes.
Potes STR Booking Lead Time Analysis (2025)
Average Booking Lead Time by Month
Booking Lead Time Insights for Potes
- The overall average booking lead time for vacation rentals in Potes is 65 days.
- Guests book furthest in advance for stays during May (average 99 days), likely coinciding with peak travel demand or local events.
- The shortest booking windows occur for stays in February (average 14 days), indicating more last-minute travel plans during this time.
- Seasonally, Summer (83 days avg.) sees the longest lead times, while Winter (24 days avg.) has the shortest, reflecting typical travel planning cycles.
Recommendations for Hosts
- Use the overall average lead time (65 days) as a baseline for your pricing and availability strategy in Potes.
- For May stays, consider implementing length-of-stay discounts or slightly higher rates for bookings made less than 99 days out to capitalize on advance planning.
- During February, focus on last-minute booking availability and promotions, as guests book with very short notice (14 days avg.).
- Target marketing efforts for the Summer season well in advance (at least 83 days) to capture early planners.
- Monitor your own booking lead times against these Potes averages to identify opportunities for dynamic pricing adjustments.
Popular & Essential Airbnb Amenities in Potes (2025)
Amenity Prevalence
Amenity Insights for Potes
- Essential amenities in Potes that guests expect include: Kitchen, TV. Lacking these (any) could significantly impact bookings.
- Popular amenities like Washer, Hot water, Wifi are common but not universal. Offering these can provide a competitive edge.
- Warning: Wifi is not universally provided but is considered essential globally. Ensure reliable Wifi is offered.
Recommendations for Hosts
- Ensure your listing includes all essential amenities for Potes: Kitchen, TV.
- Prioritize adding missing essentials: Kitchen, TV.
- Consider adding popular differentiators like Washer or Hot water to increase appeal.
- Highlight unique or less common amenities you offer (e.g., hot tub, dedicated workspace, EV charger) in your listing description and photos.
- Regularly check competitor amenities in Potes to stay competitive.
Potes Airbnb Guest Demographics & Profile Analysis (2025)
Guest Profile Summary for Potes
- The typical guest profile for Airbnb in Potes consists of a mix of domestic (41%) and international guests, with top international origins including United Kingdom, typically belonging to the Post-2000s (Gen Z/Alpha) group (50%), primarily speaking English or Spanish.
- Domestic travelers account for 40.8% of guests.
- Key international markets include Spain (40.8%) and United Kingdom (17.9%).
- Top languages spoken are English (33.3%) followed by Spanish (28.5%).
- A significant demographic segment is the Post-2000s (Gen Z/Alpha) group, representing 50% of guests.
Recommendations for Hosts
- Balance marketing efforts between domestic and international channels based on the guest mix.
- Tailor amenities and listing descriptions to appeal to the dominant Post-2000s (Gen Z/Alpha) demographic (e.g., highlight fast WiFi, smart home features, local guides).
- Highlight unique local experiences or amenities relevant to the primary guest profile.
- Consider seasonal promotions aligned with peak travel times for key origin markets.
Nearby Short-Term Rental Market Comparison
How does the Potes Airbnb market stack up against its neighbors? Compare key performance metrics like average monthly revenue, ADR, and occupancy rates in surrounding areas to understand the broader regional STR landscape.
| Market | Active Properties | Monthly Revenue | Daily Rate | Avg. Occupancy |
|---|---|---|---|---|
| Quintanilla Vivar | 12 | $2,167 | $186.62 | 41% |
| Getxo | 126 | $1,960 | $159.40 | 47% |
| Liérganes | 49 | $1,948 | $207.69 | 44% |
| Aiarako kuadrilla/Cuadrilla de Ayala | 22 | $1,936 | $197.35 | 39% |
| Santiurde de Toranzo | 14 | $1,920 | $223.21 | 38% |
| Riotuerto | 15 | $1,897 | $199.60 | 35% |
| Entrambasaguas | 40 | $1,832 | $186.39 | 36% |
| Penagos | 23 | $1,797 | $265.07 | 29% |
| Bareyo | 11 | $1,731 | $190.63 | 46% |
| Villacarriedo | 28 | $1,680 | $281.35 | 35% |